


Overview
Johor Corporation (JCorp) is the principal state-owned development institution and conglomerate of Johor, Malaysia. Established in 1968, JCorp plays a key role in driving the state’s economic growth and development.
Wholly owned by the Johor State Government, JCorp has approximately RM25 billion in assets across a diversified portfolio of businesses. Its operations span healthcare, property and infrastructure, agribusiness, food and restaurants, and investments, with key businesses including KPJ Healthcare, JLand Group, Johor Plantations Group and QSR Brands. In addition to its presence in Malaysia, JCorp has an international footprint across several countries in Southeast Asia.
Beyond its commercial activities, JCorp also plays an important role in supporting community and social development through organisations such as Yayasan Johor Corporation and Waqaf An-Nur. These organisations contribute to the well-being of society through initiatives in areas including education, welfare, healthcare and community development, supporting the broader economic and social well-being of the people of Johor.
JCorp – Operating segments
The Group comprises the following reportable segments:
|
Segment |
Description |
|
Agribusiness |
Oil palm plantation, crude palm oil processing, plantation management services and consultancy. (Johor Plantations Group Bhd, KLSE: JPG 5323) |
|
Wellness and Healthcare |
Hospitals and healthcare services. (KPJ Healthcare Bhd, KLSE: KPJ 5878) |
|
Real Estate and Infrastructure |
Property development, housing development, property management services, property investment and real estate investment trust; development and sale of industrial land and project management. (Al-SALAM REIT, KLSE: ALSREIT 5269) |
|
Others |
Non-core businesses, i.e. parking management, sales of wood-based products, bulk mailing and printing, port operation and management, and Kentucky Fried Chicken (KFC), Pizza Hut and Ayamas outlets. |
Source: Company Reports, iFAST Compilations. Data as of 31 Dec 2025.
Among the Group’s operating segments, Wellness and Healthcare has consistently remained the largest contributor to revenue, accounting for approximately 56% of total Group revenue, followed by Agribusiness (23%), Real Estate and Infrastructure (18%), and Others (3%).
A Quick Glance on JCorp’s Financials
Given that JCorp is not a publicly listed company, it is not required to announce or publish its financial results on a quarterly basis. Accordingly, the latest available financial results are for FY2025 (year ended December 2025).
Over the past few years, JCorp has demonstrated resilient financial performance, with revenue recording steady growth since 2021. In FY2025, revenue increased by approximately 10% YoY to RM7,626 million, driven primarily by stronger revenue contributions across all segments.
In FY2025, Wellness and Healthcare recorded an 8.1% YoY increase in revenue to RM4,241 million, mainly driven by higher inpatient, outpatient and surgical activities across its network.
The Agribusiness segment, supported by Johor Plantations Group (JPG), a public company listed on Bursa Malaysia, recorded a 9.6% YoY increase in revenue to RM1,756 million. The growth was supported by favourable commodity prices, improved operational efficiency and sustained productivity across its plantation operations.
Revenue from the Real Estate and Infrastructure segment increased by 14% YoY, driven primarily by stronger contributions from property development and integrated community solutions.
Despite the increase in revenue in FY2025, operating expenses (OpEx) declined slightly to RM1,976 million from RM2,055 million in FY2024, which management attributed to improved cost control during the financial year.
Overall, we view JCorp’s earnings profile as resilient, underpinned by its diversified portfolio across relatively different sectors, including healthcare, upstream crude palm oil activities, property and infrastructure. The breadth of its operations provides a degree of earnings diversification and reduces reliance on any single business segment. In particular, the relatively defensive nature of its healthcare operations provides some stability to the Group’s earnings, while the agribusiness and property-related businesses offer additional earnings growth potential.
Table 1: Profitability indicators (RM million)
|
2021 |
2022 |
2023 |
2024 |
2025 |
|
|
Revenue |
5,137 |
5,756 |
6,200 |
6,961 |
7,626 |
|
Cost of sales |
(3,208) |
(3,485) |
(3,725) |
(4,144) |
(4,552) |
|
Operating expenses (OPEX) |
(1,205) |
(1,395) |
(1,572) |
(2,055) |
(1,976) |
|
Profit before tax |
670 |
843 |
605 |
718 |
1,039 |
|
Profit after tax |
379 |
808 |
378 |
317 |
703 |
|
Net profit Margin (%) |
7.4% |
14.0% |
6.1% |
4.6% |
9.2% |
Table 2: Revenue breakdown by segment (RM million)
|
2024 |
2025 |
Change |
|
|
Agribusiness |
1,602 |
1,756 |
9.6% |
|
Wellness and healthcare |
3,922 |
4,247 |
8.3% |
|
Real estate and infrastructure |
1,003 |
1,145 |
14.2% |
|
Others |
317 |
292 |
-7.9% |
Source: Company Reports, iFAST Compilations. Data as of 31 Dec 2025.
Credit profile
From a credit perspective, JCorp has maintained a resilient credit profile, supported by a manageable level of gearing and a sound liquidity position. As shown in Table 3, the Group’s net debt-to-equity ratio improved significantly from 81% in 2021 to 53% in 2025. This improvement was primarily driven by a stronger equity base, supported by higher retained earnings, together with an increase in cash reserves.
Other credit metrics also remain supportive. The cash-to-short-term debt ratio and interest coverage ratio stood at 1.74x and 2.88x, respectively, indicating that JCorp maintains adequate liquidity to meet its short-term debt obligations and sufficient earnings capacity to service its interest expenses. In addition, operating cash flow has remained consistently positive, further supporting the Group’s liquidity position and ability to meet its ongoing financial obligations.
Overall, JCorp’s credit metrics have shown a positive trend, while its liquidity position remains sound at this juncture. The Group’s diversified earnings base, particularly its exposure to agribusiness and healthcare, also provides a degree of resilience, given the essential nature of these sectors and their relatively recurring underlying demand. Going forward, sustained positive operating cash flow, prudent leverage management and continued performance across its key operating segments will remain important in supporting JCorp’s overall credit profile.
Table 3: Credit metrics
|
|
2021 |
2022 |
2023 |
2024 |
2025 |
|
Cash and cash equivalents |
920 |
1,237 |
2,165 |
2,279 |
2,767 |
|
Total borrowings |
8,816 |
8,826 |
9,288 |
8,896 |
9,179 |
|
Operating Cash Flow |
1,275 |
1,880 |
1,517 |
1,215 |
1,840 |
|
Net debt-to-equity ratio (%) |
81% |
72% |
65% |
56% |
53% |
|
Cash to short-term debt ratio (x) |
0.23 |
0.48 |
1.42 |
2.32 |
1.74 |
|
Interest coverage ratio (x) |
2.70 |
2.87 |
2.07 |
2.42 |
2.88 |
Source: Company Reports, iFAST Compilations. Data as of 31 Dec 2025.
Debt maturity wall
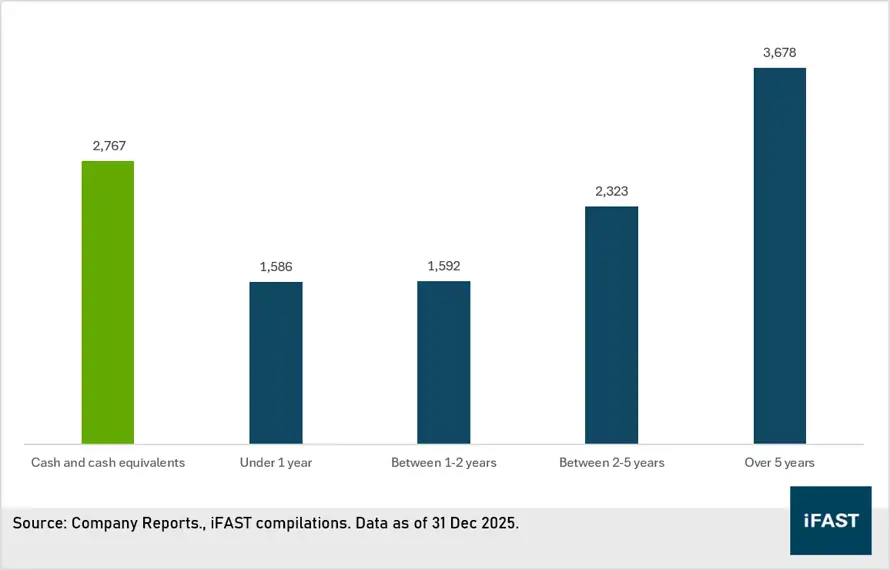
Although JCorp’s total borrowings are relatively substantial, the debt is well spread across longer maturities, which provides greater flexibility in managing its debt obligations and reduces near-term refinancing pressure. This is a further factor that provides comfort from a credit perspective and supports our assessment of the Group’s overall credit profile.
Based on the cash position as at December 2025, JCorp’s cash reserves remain sufficient to cover its near-term debt obligations, providing an additional liquidity buffer and reducing immediate refinancing risk.
Chart 1: Debt maturity profile
Key Risk
Commodity price volatility in the Agribusiness segment- The Agribusiness segment's revenue and profitability are directly exposed to global crude palm oil (CPO) and palm kernel (PK) prices, which are driven by factors largely outside the Group's control, for instance, weather conditions. As CPO is typically sold on a spot or benchmark-linked basis, using the MPOB benchmark price rather than under long-term fixed-price offtake contracts, producers remain exposed to commodity price volatility.
However, we believe that the risk has been largely mitigated through the portfolio diversification. Other than agribusiness, JCorp also involved in the non-cyclical Wellness & Healthcare division, acting as a steady and defensive cash generator when the palm oil prices fluctuate.
Upcoming issuance
JCorp is expected to issue a five-year Sukuk with an indicative yield to maturity of 4.35%. The proposed issue size is RM300 million, with the proceeds primarily intended to refinance existing borrowings of JCorp and its subsidiaries, as well as to support working capital requirements.
The AAA rating, which represents the highest investment-grade rating category, reflects RAM’s assessment of the high likelihood of extraordinary state support in the event of financial stress. This is underpinned by JCorp’s strategic position as the principal state-owned development institution of Johor, alongside its diversified business portfolio and strong financial flexibility.
Our view
Overall, we see limited concerns regarding JCorp’s underlying business operations, given its diversified business portfolio, resilient earnings performance and sound liquidity position. Its status as a wholly state-owned entity also provides an additional source of credit comfort, with the potential for government support in the event of financial distress.
Hence, the upcoming five-year Sukuk, with an indicative yield to maturity of 4.35%, may be of interest to lower risk appetite investors, given JCorp’s strong credit profile and AAA / Stable rating.
Table 4: Recommended Bonds
|
Bond |
Yield to Maturity |
Min / Sub |
|
4.35% area* |
250k / 250k |
*Indicative yield guidance
Table 5: Existing Bonds
|
Bond |
Years to Maturity |
Yield to Maturity |
Min / Sub |
|
3Y10M |
3.94% |
50k / 50k |
|
|
11Y10M |
4.37% |
50k / 50k |
Source: BSM, iFAST Compilations. Data as of 25 Sep 2026.
Declaration: For specific disclosure, at the time of publication of this report, IFPL (via its connected and associated entities) holds a position in PERBA 4.450% 05Jul2030 Qsov (MYR) and PERBA 4.720% 11Jun2027 Qsov (MYR) and the analyst who produced this report hold a NIL position in the abovementioned securities.