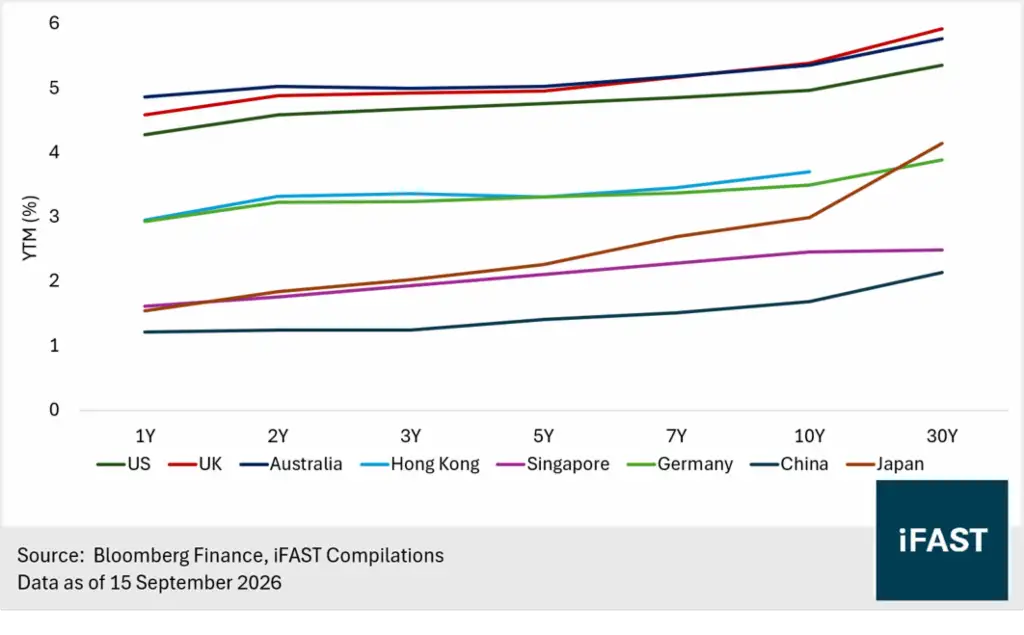
5.89% — that was the yield on the UK 30-year gilt at the start of this month, a level not seen since March 1998. In the same month, the US 10-year Treasury yield pierced 5% for the first time since 2007, and the entire Australian government curve rose to its highest level since 2011. The United States, the United Kingdom and Australia now offer the three highest sovereign yield curves in the developed world. All three prints share a single source: an escalation in the Middle East that has lifted energy prices, revived inflation that had been receding, and forced central banks — within the space of six months — to shift from preparing rate cuts to delivering rate hikes (see Chart 1).
Chart 1: Global Sovereign Yields
United States
The latest US labour-market data show August nonfarm payrolls rising by 162,000, far above the 53,000 consensus and above the 31,000 averages of the prior 12 months. June and July payrolls were revised up by a combined 55,000. The unemployment rate held at 4.1%. Employment has not weakened to the degree the market had previously feared.
In the same month, CPI rose 3.4% YoY and 0.4% MoM. Core CPI rose 2.4% YoY — the lowest reading since March 2021 — but the 0.3% MoM increase came in above expectations. Headline inflation remains well above the Federal Reserve’s 2% target.
On 16 September the FOMC voted unanimously to raise the federal funds target range by 25 bps, from 3.50%–3.75% to 3.75%–4.00% — the first hike since July 2023. At the press conference Chair Warsh said he would find it hard to describe overall financial conditions as tight, a view he said was widely shared on the Committee. The move was therefore only “removing a dose of accommodation”: the Committee regards the prior policy rate as still below neutral, so the hike was a recalibration toward neutral rather than a tightening. The newly published dot plot was equally hawkish. Of the 18 participants who submitted projections, 16 expect one further hike this year; the median implies a year-end policy rate of 4.125%.
With the hike delivered and further tightening priced in, the 2-year yield has risen to 4.63%, its highest level since July 2024. Longer-dated yields already embed a material amount of structural inflation and term premium: the 10-year briefly pierced 5% in mid-September, the first time since 2007, and the 30-year rose further to 5.36%, a near-20-year high.
Australia
The Reserve Bank of Australia has already raised the cash rate by a cumulative 75 bps this year, to 4.35%, and chose to stand pat at its 11 August meeting. Governor Michele Bullock was explicit that inflation remains too high and that a further hike cannot be ruled out if upside risks reappear. The market now assigns close to an 80% probability to a 25 bp hike to 4.60% on 29 September.
On inflation, CPI to July rose 3.5% YoY, down from 3.8% in June, but the trimmed-mean measure that the RBA watches most closely held at 3.6%. Both remain above the 2%–3% target band. Growth has not weakened in any material way: real GDP rose 0.4% QoQ and 2.1% YoY in the second quarter, still slightly above the RBA’s estimate of around 2%. The July unemployment rate edged up from 4.4% to 4.5%; the labour market is only cooling modestly.
Even after the RBA’s hikes, inflation pressure has not fully faded, and the market still sees room for further tightening. That is what has lifted Australian government yields. The entire curve is at its highest level since May 2011: the 2-year around 5.00%, the 5-year at 5.03%, and the 10-year at 5.35%–5.40%. The 10-year Australian government yield sits about 40 bps above the same-maturity US Treasury, even though the Australian sovereign is rated AAA, a notch above the United States at AA+.
United Kingdom
The Bank of England has been on hold since cutting Bank Rate to 3.75% in December 2025. At the July meeting the Committee voted 6–3 to keep rates unchanged, with three members preferring a 25 bp hike to 4.00%. Market pricing has also flipped from cuts to hikes: SONIA futures imply a policy rate of around 4.6% in the second half of 2027, which would mean three to four hikes over the next 18 months.
On inflation, CPI to July rose 2.9% YoY, up from 2.6% in June. Core CPI was 2.6%. Services inflation eased further, from 3.6% in June to 3.4%, a clear improvement from 4.4% in January. In other words, domestic inflation pressure in the UK is still cooling; the latest rebound is mainly energy. The BoE’s July projections have CPI peaking at around 3.2% in the fourth quarter and state explicitly that inflation risks are skewed to the upside. The UK’s heavy reliance on imported energy leaves it more exposed than other major economies to this Middle East supply shock.
The real swing factor in the UK market, however, is fiscal policy. Incoming Chancellor John Healey will present his first Budget on 28 October. The roughly GBP 23.6 billion of fiscal headroom he inherited from predecessor Rachel Reeves has already been eroded to about GBP 13.0 billion by the recent surge in gilt yields. The market widely expects a tax-heavy Budget. At the same time, Bank of England quantitative tightening continues: the gilt holdings stock has fallen from a peak of GBP 895 billion to GBP 489 billion as of 9 September, so long-end supply pressure has not eased.
Under the dual pressure of monetary and fiscal policy, gilts have been the most stressed part of this global rate sell-off. The 30-year gilt yield rose to 5.89% in early September, the highest since March 1998; the 10-year has pierced 5.3%, the highest since 2008. Notably, the 30-year/10-year spread is close to 60 bps — far wider than in the United States — which tells us that the compensation the market is demanding on long gilts is not just inflation, but a clear fiscal risk premium as well.
Bond Investment
In sum, the energy-price shock from the Middle East has lifted headline inflation, turned policy in all three jurisdictions from easing toward tightening, and pushed government-bond yields to multi-year highs in lockstep. For bond investors, sovereigns in these three markets are rated between AAA and AA-. That combination — low credit risk with yields of 4.4% to 5.8% — is an allocation window that has been rare over the past decade-plus.
Table 1: US, UK and Australian Sovereign Bonds on the Bondsupermart Live
|
Bond Name |
Issuer |
Currency |
Issuer Credit Rating (S&P / Fitch) |
Tenor (yrs) |
Investor buy Price |
YTM |
|
T 4.125% 30Sep2027 Govt (USD) |
US Treasury |
USD |
AA+ / AA+ |
1.04 |
99.67 |
4.41% |
|
T 3.125% 15Nov2028 Govt (USD) |
US Treasury |
USD |
AA+ / AA+ |
2.17 |
96.75 |
4.69% |
|
T 1.375% 15Nov2031 Govt (USD) |
US Treasury |
USD |
AA+ / AA+ |
5.17 |
84.11 |
4.87% |
|
T 5.000% 15May2037 Govt (USD) |
US Treasury |
USD |
AA+ / AA+ |
10.67 |
100.05 |
4.96% |
|
T 4.750% 15Feb2056 Govt (USD) |
US Treasury |
USD |
AA+ / AA+ |
29.44 |
90.29 |
5.39% |
|
UKT 4.375% 07Mar2028 Govt (GBP) |
UK Gilt |
GBP |
AA / AA- |
1.48 |
99.38 |
4.77% |
|
UKT 0.250% 31Jul2031 Govt (GBP) |
UK Gilt |
GBP |
AA / AA- |
4.88 |
79.9 |
4.90% |
|
UKT 4.500% 07Mar2035 Govt (GBP) |
UK Gilt |
GBP |
AA / AA- |
8.48 |
94.43 |
5.28% |
|
ACGB 2.750% 21Nov2028 Govt (AUD) |
Australian Government |
AUD |
AAA / AAA |
2.2 |
95.35 |
4.95% |
|
ACGB 4.500% 21Apr2033 Govt (AUD) |
Australian Government |
AUD |
AAA / AAA |
6.6 |
96.25 |
5.15% |
|
ACGB 4.750% 21Jun2054 Govt (AUD) |
Australian Government |
AUD |
AAA / AAA |
27.78 |
85.65 |
5.76% |
|
Source :
FSM Global |
||||||
For specific disclosure, at the time of publication of this report, IFPL (via its connected and associated entities) holds T 4.125% 30Sep2027 Govt (USD), T 3.125% 15Nov2028 Govt (USD) , T 1.375% 15Nov2031 Govt (USD), T 5.000% 15May2037 Govt (USD), T 4.750% 15Feb2056 Govt (USD), UKT 4.375% 07Mar2028 Govt (GBP), UKT 0.250% 31Jul2031 Govt (GBP), UKT 4.500% 07Mar2035 Govt (GBP), ACGB 2.750% 21Nov2028 Govt (AUD), ACGB 4.500% 21Apr2033 Govt (AUD), ACGB 4.750% 21Jun2054 Govt (AUD) and the analyst who produced this report holds a NIL position in the abovementioned securities.
RISK DISCLOSURE STATEMENTS FOR BONDS
Key risks of investing in bond
|
Key risks of investing in high-yield bonds
|
| Bonds with special features Some bonds may contain special features and risks that warrant special attention. These include bonds:
|
Remarks
|