Highlights:
Sunac demonstrated a stable operating performance in the first half of the year and maintained decent credit metrics. However, sales plunged in recent months and the aggressive land buying strategy in 1H21 will place its actual cash flows under market spotlight.
Markets have recently been concerned about the hidden debt of Chinese developers. Although Sunac’s off-balance sheet debt profile looks similar to its peers, we shall not underestimate its impact.
While we believe Sunac has a better credit profile than most of the B-rated developers, the Group is facing a risk of credit rating downgrade. We think investors have to be more prudent now, especially because its management did not actively repurchase its bonds when yields skyrocketed.
In the “An Analysis of Chinese Real Estate Sector & Credit Indicators” article, we mentioned that given the rising difficulties to refinance, investors may now consider some of the BB-rated issuers instead.
Sunac China has proven itself to be a leader within this tier, yet its bond yields are rising quickly. How has the Group been performing?
Stable 1H21 Operating Result; but Sales Plunged in Recent Months
Sunac’s revenue and profits attributable to shareholders in 1H21 stood at 95.8 billion yuan and 12.0 billion yuan, up 24% and 9% respectively. The gross margin declined from 23.0% to 20.8% (see Table 1), which is in line with the sector trend and relatively stable.
Table 1: Sunac’s 1H21 Operating Result
|
(billion yuan) |
1H21 |
YoY Change |
1H20 |
|
Total Contracted Sales |
320.8 |
+64.3% |
195.3 |
|
Revenue |
95.8 |
+23.9% |
77.3 |
|
Gross Profit |
20.0 |
+12.5% |
17.8 |
|
Gross Margin |
20.8% |
-2.2 ppt |
23.0% |
|
Profits Attributable to Shareholders |
12.0 |
+9.4% |
11.0 |
|
Source: Company Announcements, iFAST Compilations Data as of 30 June 2021 |
|||
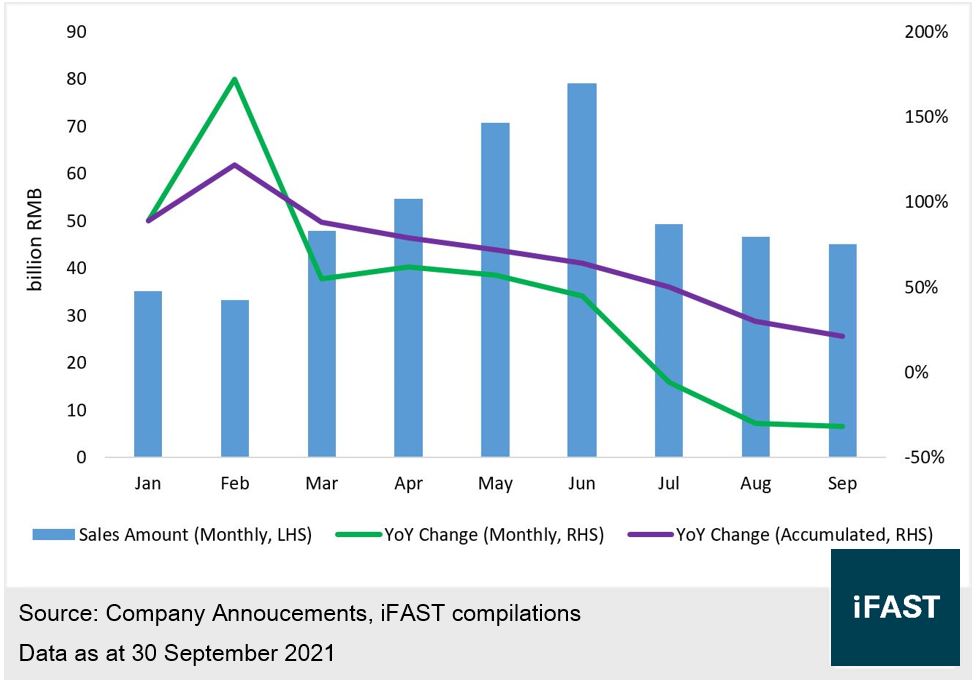
The Group’s total contracted sales in Jan-Sep increased by 21% YoY to 575.2 billion yuan, outperforming the sector average. However, under the impact of tightening mortgage quota and the Evergrande incident, the traditional peak sales season ‘Golden September, Silver October’ turned into a weak market. Given this macro background, it seems impossible for Sunac to remain unaffected.
In August and September, Sunac only recorded contracted sales of 45.1 billion yuan and 46.7 billion yuan, with YoY decline of around 30% in both months (see Chart 1). Meanwhile, the average selling price also fell below 14,000 yuan per sq.m (1H21 average: 14,763 yuan per sq.m). The Group has suffered a significant deterioration in sales performance, which would definitely weaken its cash flows.
Chart 1: Sunac’s Sales Performance
The ‘Rescue Letter’ Incident Caused Panic; but Managed within Project Company Level
On September 27, a leaked letter drafted by Sunac’s Shaoxing project company was circulated. It looked like a request for policy support from the local government and mentioned that the strict housing market regulations implemented in Shaoxing hurt the company’s cash flows, as the key development project ‘Huangjiu Xiaozhen’ failed to sell smoothly. There was about 11.7 billion yuan cash trapped, seriously affecting its liquidity.
Sunac later clarified that they ‘never will have any need or intention to submit a report like this to the government’. The leaked document was just a draft memo prepared by staff in Shaoxing for verbal communication with officials that would visit the site on the same day, in order to seek some support for online contract signing. However, it was mistakenly sent to a local real estate chat group and therefore leaked to the public.
Since the Evergrande incident, the developers are more prudent in managing the cash at holding company level. Project companies are more likely to face a cash crunch if they have encountered any kind of contract signing restriction and mortgage quota limit, because they can no longer easily obtain funding from their parent company. Regardless of whether this incident was accidental, we believe that the standalone status of a project company cannot reflect the financial health of a national giant like Sunac.
Credit Metrics Remain Decent; Actual Cash Flows under Market Spotlight
Looking at the overall credit indicators, the Group has performed decently as at end-June, improving its leverage level and stably maintaining its cash to short term debt ratio. The land bank to sales ratio is still superior to its peers’ average (see Table 2).
Table 2: Sunac’s Credit Indicators
|
(in billion yuan) |
June 2021 |
December 2020 |
Three Red Lines Requirements |
|
Total Debt |
303.5 |
303.4 |
/ |
|
Cash and Cash Equivalents |
101.1 |
98.7 |
/ |
|
Net Gearing (%) |
87% |
96% |
<100% |
|
Cash to Short Term Debt (times) |
1.35x |
1.45x |
>1.0x |
|
Unrestricted Cash to Short Term Debt (times) |
1.11x |
1.08x |
/ |
|
Adjusted Liabilities to Assets (%) |
76% |
79% |
<70% |
|
Land Bank to Sales (by Area) (times) |
6.3 |
6.3 |
/ |
|
Source: Company Announcements, iFAST Compilations Data as of 30 June 2021 |
|||
We recently saw companies with ample cash on financial statements such as Fantasia, falling into an abrupt default. Investors are starting to question the reliability of the most-used credit indicators such as the ‘three red lines’. Instead, they are now turning their attention to the actual cash flows.
In 1H21, Sunac picked up its aggressive land buying strategy again, purchasing about 17 million sq.m of attributable land parcels at the beginning of the centralized land sale era. The land cost reached 76.1 billion yuan and accounted for 38% of attributable contracted sales of the same period – a ratio higher than its peers’.
However, the property market took a sharp downturn after a strong growth in 1H21, which probably caught Sunac off guard. Furthermore, since Evergrande’s commercial paper scandal, market rumors said many developers are also missing payments on their commercial papers. Sunac has not been spared from the list. According to trading platform Tiepiaobao, some of Sunac’s commercial papers are offering a discount rate of 20% to 35%, demonstrating market doubts on its repayment ability.
It is important to note that commercial papers are not standardized and usually have a small nominal value and transaction amount. They may also lack legal binding power in some cases (for example, some developers claim that the unpaid papers are related to criminal activities). Therefore, it can only be taken as a reference unless we have visibility of a large number of overdue payments.
But, we also have to admit, as of end-June, Sunac still owed around 250 billion yuan of payables, with 130.6 billion yuan of them being trade payables that are mainly commercial papers. So the question is, if Sunac is unable to refinance, will there be a possibility of any liquidity drain?
Hidden Debt Profile Looks Reasonable
Despite decent-looking credit indicators, it is the off-balance sheet hidden debt of these developers that is worrying at this point. While we cannot analyze the undisclosed figures, we could still try to look into the statements and find clues.
With reference to S&P’s industry analysis report, we made a quantitative analysis on its joint ventures (“JV”) and associates, and created a comparison between Sunac and Evergrande on six different aspects (see Table 3).
- Guided consolidated ratio and estimated consolidated ratio (higher the difference means the sales revenue may be unreasonably high)
- Contracted liabilities / attributable contracted sales (lower the number means some projects that should be consolidated, are likely not consolidated)
- Return on JVs and associates (lower the number means the JVs may be either unprofitable or not consolidated)
- External guarantees / investments in JVs and associates (lower the number means the actual guaranteed amount may be underestimated)
- Payables to JVs and associates / total debt (higher the number means the actual debt level may be underestimated)
- Minority interests / total equity (higher the number means the flexibility to access hidden debt is higher)
Table 3: Comparison between Sunac and Evergrande
(in billion yuan) | Sunac China | China Evergrande |
1. Estimated Consolidated Ratio * | 49% | 75% |
Guided Consolidated Ratio | 63% | 95% |
- Difference between Consolidated Ratio | 14% | 20% |
2. Contracted Liabilities | 320.0 | 215.8 |
Attributable Contracted Sales (1H21 * 2) | 401.2 | 677.4 |
- Contracted Liabilities / Attributable Contracted Sales | 80% | 32% |
3. Profits from JVs and Associates (Trailing 12 Months) | 3.8 | -2.9 |
Investments in JVs and Associates (Last 12 Months Average) | 89.9 | 102.1 |
- Return on JVs and Associates | 4.2% | -2.9% |
4. External Guarantees | 42.4 | 25.1 |
Investments in JVs and Associates | 98.9 | 115.7 |
- External Guarantees / Investments on JVs and Associates | 43% | 22% |
5. Payables to JVs and Associate | 46.5 | 94.4 ^ |
Total Debt | 303.5 | 571.7 |
- Payables to JVs and Associates / Total Debt | 15% | 17% |
6. Minority Interests / Total Equity | 38% | 54% |
* Formula: (property development revenue + change in contracted liabilities) / (total contracted sales * cash collection ratio); Cash collection ratio for Sunac and Evergrande are 85% and 90% respectively ^ Not disclosed in interim report, estimated using the ratio at end-2020 (40% of other payables) | ||
Source: Company Announcements, CRIC, iFAST Compilations Data as of 30 June 2021 | ||
Looking at above-mentioned six aspects, Sunac’s off-balance sheet debt profile is better than that of Evergrande, and all these ratios look similar to its peers. Still, it does not mean the hidden debt burden of the Group is negligible because almost every developer is using such joint ventures to ‘beautify’ their financial statements.
If we classify all the payables to JVs and associates of Sunac as minor interests, and convert them into debt, it will result in an adjusted net gearing ratio of 140%, which is similar to the previous JP Morgan estimation.
One more thing to mention, the two key subsidiaries of Sunac, namely the property management company Sunac Services (Stock Code: 1516.HK) and the cultural and tourism division, have contributed around 3.3 billion yuan and 2.6 billion yuan revenue in 1H21 respectively. The Group is holding a 70% stake in Sunac Services, which has an approximately 8.4 billion yuan net cash position. With current market capitalization of about 55 billion HKD, Sunac can monetize the subsidiary during a liquidity crunch, but the final value is likely to suffer a huge discount.
Sharp increase in Bond Yields; Have to Be More Prudent Now
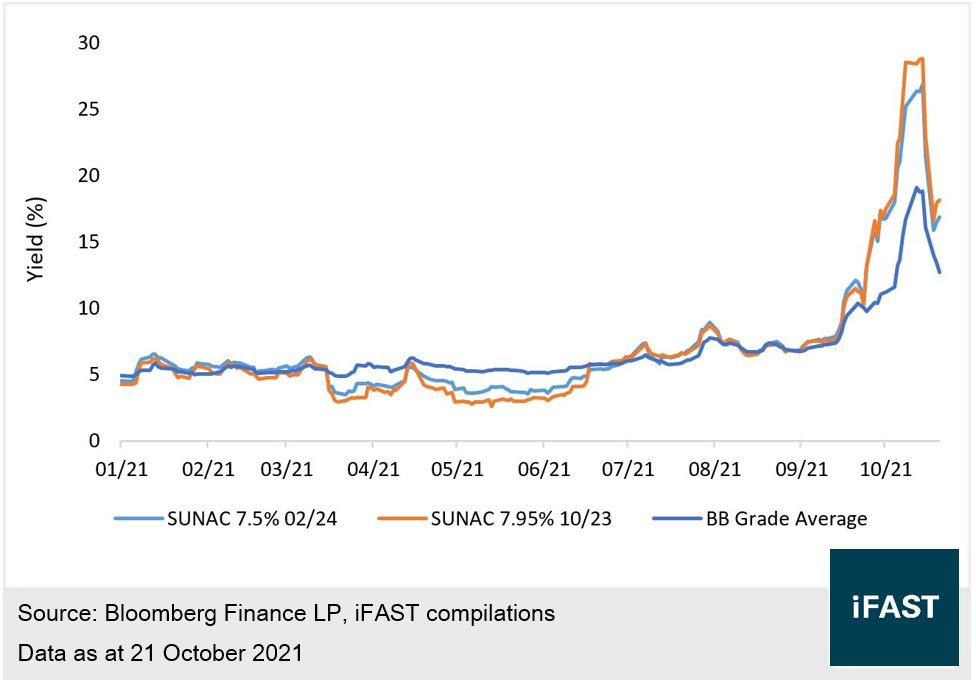
Last week, the yields of several Sunac bonds hit the 25% level. Despite the rebound in this week, its yields are still higher than the average yield of the BB-rated peers (see Chart 2).
Chart 2: Bond Yields of Sunac and Peers Average
Even though Sunac repurchased 33.6 million USD nominal amount of its 2024 bond in the open market on September 27, we did not see any follow-up when the bond prices dropped further. It shows that the management may not want to overspend the cash on hand.
At this juncture, we still believe Sunac has a better credit profile than most of the B-rated developers. However, given the increasing difficulty of refinancing and the unstable regulatory environment, the Group may be downgraded by credit agencies if the condition persists. Thus, we think investors have to be more prudent now, and perhaps a wait-and-see approach is more appropriate.
The yields of all Sunac USD bonds due on or before 2024 are listed in Table 4.
Table 4: Sunac’s Bond Yields
Bond Name | Years to Maturity | Indicative Ask Price | Ask Yield to Maturity |
0.65 | 89.0 | 26.7% | |
0.80 | 87.9 | 25.5% | |
1.50 | 84.6 | 20.8% | |
1.71 | 83.7 | 17.8% | |
1.97 | 83.4 | 18.3% | |
2.28 | 82.4 | 17.0% | |
2.51 | 77.5 | 17.3% | |
2.79 | 79.1 | 16.2% | |
2.99 | 78.8 | 15.8% | |
Source: BSM Data as of 22 October 2021 | |||
Corporate Risks
Considering Sunac’s aggressive land purchase strategy in 1H21, coupled with the possible need for continuous investment in the cultural and tourism business, its leverage level may rise again and increase debt repayment pressure.
The off-balance sheet debt of the Group has come under the spotlight. It may trigger a serious liquidity crisis if similar events happen again, such as the commercial paper and ‘rescue letter’ incidents.
Sunac may face a rating downgrade and fall into a vicious cycle of increasing bond yields. The refinancing risk is higher than before, which will eat into the cash flows if it is unable to refinance continuously.
Conclusion
Sunac demonstrated a stable operating performance in the first half of the year and maintained decent credit metrics. However, sales plunged in recent months and the aggressive land buying strategy in 1H21 will place its actual cash flows under market spotlight.
Markets have recently been concerned about the hidden debt of Chinese developers. Although Sunac’s off-balance sheet debt profile looks similar to its peers, we shall not underestimate its impact.
While we believe Sunac has a better credit profile than most of the B-rated developers, the Group is facing a risk of credit rating downgrade. We think investors have to be more prudent now, especially because its management did not actively repurchase its bonds when yields skyrocketed.
Declaration: For specific disclosure, at the time of publication of this report, IFPL (via its connected and associated entities) has a principal position in SUNAC 5.950% 26Apr2024 Corp (USD), and the analyst who produced this report hold a NIL position in the abovementioned securities.