On 2 April, President Trump announced the implementation of his reciprocal tariff policy, declaring the day as America’s “Liberation Day.” This sparked market concerns about the creditworthiness of US treasuries and the status of the US dollar. In the following week, US treasuries faced significant sell-offs and the US Dollar Index declined concurrently.
As Trump temporarily suspended the reciprocal tariffs for 90 days and his rhetoric showed signs of moderation, the sell-off in Treasuries eased temporarily. However, in mid-May, after Moody’s downgraded the US sovereign credit rating from Aaa to Aa1, 10-year and 30-year bond yields surged past 4.5% and 5.0% respectively.
Since the introduction of the reciprocal tariff policy, markets have begun re-evaluating the investment rationale for Treasuries and the dollar. Key concerns include whether Treasuries remain absolutely safe, the imbalance between Treasury supply and demand, the US debt-to-GDP ratio, fiscal deficits, dollar credibility, the global trade system and the perceived decline of American hegemony. This article analyzes the US fiscal deficit, summarizes the facts about treasuries and evaluates their safety.
US Fiscal Revenue and Expenditure Analysis
The tax revenues are the primary source of US federal revenues, with individual income taxes and social insurance and retirement receipts accounting for over 80% of total revenues. Other sources include corporate income taxes, excise, estate and gift taxes, customs duties (tariffs) and miscellaneous receipts (see Chart 1).
Chart 1: US
Government Revenue and Composition Analysis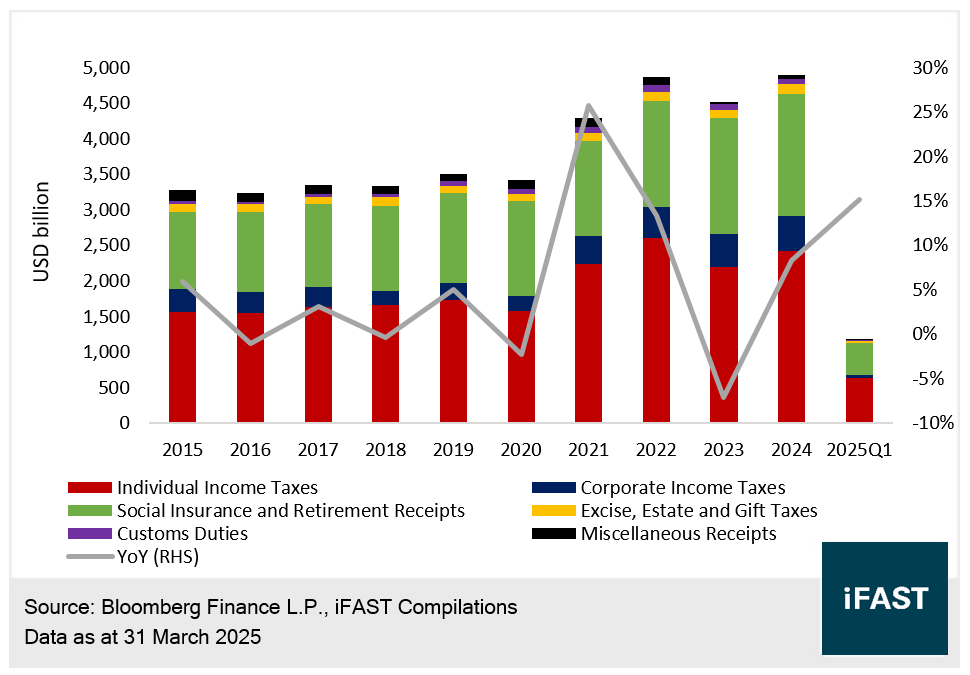
As shown in Chart 1, tariffs currently contribute only 1.6% of total revenues. The Trump administration aims to broaden the tax base by increasing tariffs to boost revenue, supporting goals like tax cuts and deficit reduction.
Based on a 10% baseline tariff, The Tax Foundation estimates an additional $2 trillion in revenue over the next decade, or roughly $200 billion annually, representing less than 5% of current revenues. This suggests that a 10% tariff alone is insufficient to achieve the administration’s deficit reduction goals. We estimate the US effective tariff rate will likely range between 10% and 20%. The current moderate trade negotiation outcomes are likely temporary measures within the 90-day suspension period, not the final resolution.
As shown in Chart 2, US federal expenditures in 2024 reached $6.8 trillion, with significant portions allocated to spending with high stickiness, including defense, mandatory outlays (social & income security, Medicare & Medicaid, federal civilian and military retirement and veterans’ programs) and net interest payments. These account for over 85% of total spending, leaving limited room for discretionary cost-cutting.
Chart 2: US Federal Expenditures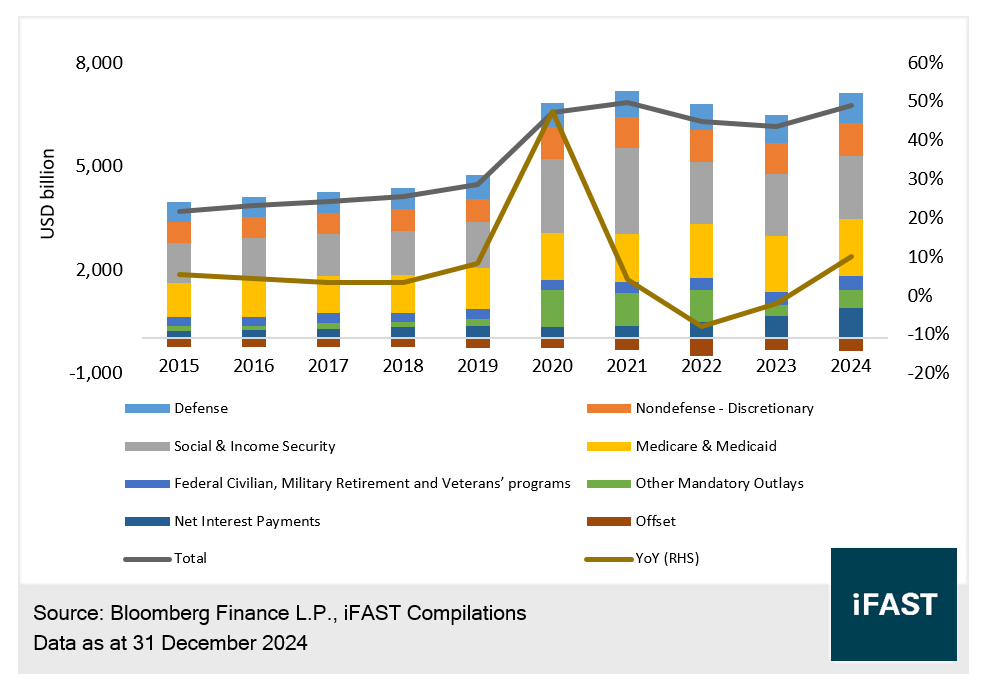
Notably, since 2020, thanks to the pandemic, aggressive fiscal policies and Fed’s rate hike, the US debt burden and bond yield level (the average cost of refinancing) also increased, resulting in a surge in interest expenses. The net interest expenses surged from 5.2% of total expenditure in 2021 to 13.1% in 2024.
As shown in Chart 3, the US fiscal deficit is primarily driven by expanding expenditures and serves as a key indicator of fiscal policy intensity and direction. Influencing factors include tax policies, election politics, bipartisan dynamics, economic cycles, financial risks, economic aid and military spending. From 1980 to 2008, the fiscal deficit remained relatively stable, averaging around $200 billion annually, with occasional surpluses. However, since 2008, deficits have soared due to increased spending to stimulate the economy, especially in the 2008 financial crisis and the 2020 pandemic.
Chart 3: US Federal Revenues,
Expenditures and Fiscal Deficit as a Percentage of GDP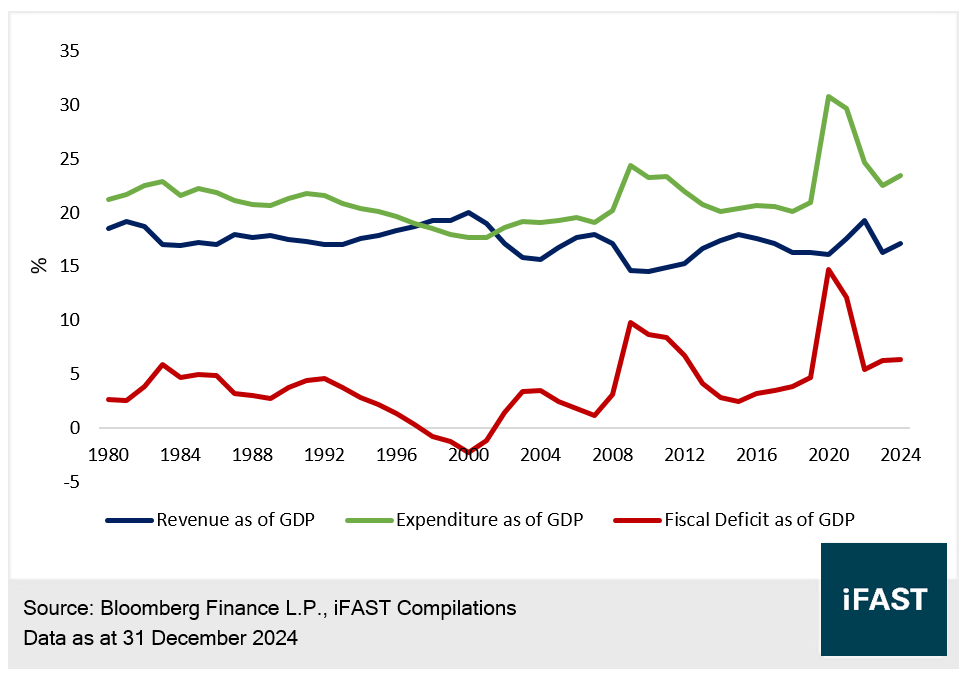
In 2024, the US fiscal deficit reached $2.0 trillion or 7% of GDP. According to the White House Office of Management and Budget, the 2025 deficit is projected at $1.8 trillion, or 6.1% of GDP, with annual deficits expected to stabilize at around $1.6 trillion going forward.
How Much Does the US Owe?
Rising fiscal expenditures have led to substantial deficits, forcing the US Treasury to issue bonds continuously to fund spending and repay maturing debt. As of April 2025, total federal debt reached $36.2 trillion, surpassing the statutory debt ceiling of $36.1 trillion set in January 2025 (see Chart 4), with the debt-to-GDP ratio exceeding 120%.
Chart 4: Federal Debt
and Statutory Debt Ceiling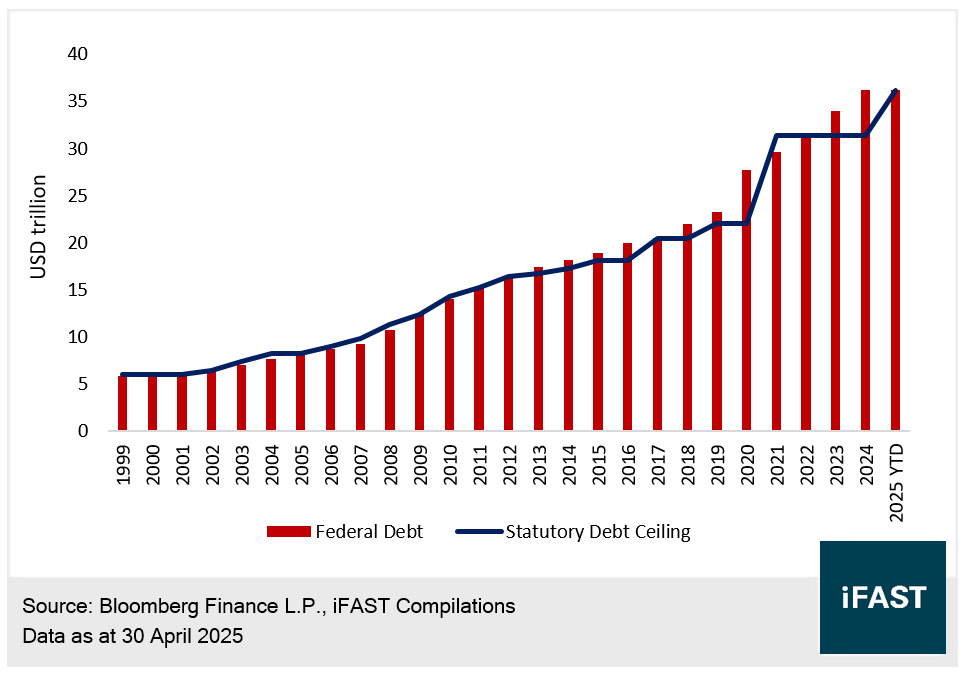
The debt ceiling is the legal limit on US Treasury borrowing. Since the end of World War II, Congress has adjusted the ceiling 104 times, including permanent increases, temporary extensions, and definition changes. According to the Bipartisan Policy Center, if Congress fails to suspend or raise the ceiling, the “X-date”—when the government cannot meet all of its obligations—could occur between mid-July and early October 2025.
However, we believe Congress will ultimately pass a suspension or increase in the debt ceiling. The ceiling is primarily a negotiation tool in bipartisan policy discussions and is unlikely to lead to a Treasury default.
As annual deficits grow, the debt-to-GDP ratio continues to rise (see Chart 5), shaking some investors’ confidence in the dollar and Treasuries. However, Japan’s debt-to-GDP ratio of 237% suggests that the US’s 121% is not an astronomical figure. While the ratio may continue to rise, it does not indicate an imminent debt crisis for the US or Treasuries.
Chart 5: Government
Debt-to-GDP Ratios Across Countries (Including Projections)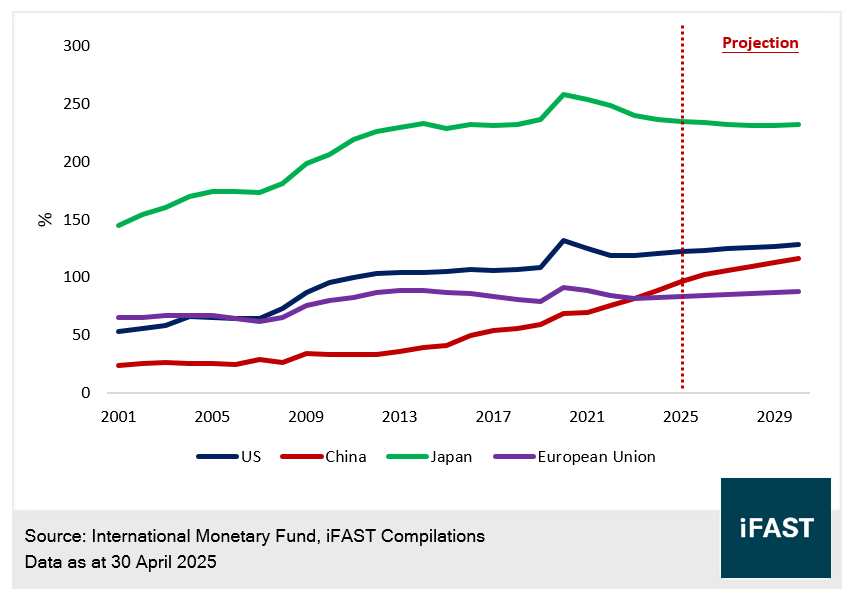
US National Debt Is Entirely Domestic Debt, Making Default Highly Unlikely
US national debt is entirely domestic, not foreign. According to Modern Monetary Theory (MMT), the US, with its ability to issue its own currency (the dollar), can theoretically issue unlimited currency to service its domestic debt (Treasuries), making default highly unlikely. As long as inflation and currency depreciation are managed, the US can continue issuing currency for the repayment of Treasuries.
Even with large-scale Treasury maturities (an average of $2.3 trillion monthly in the first half of 2025), the Treasury can sustain funding through bond auctions. This “short-term, high-frequency rollover” is standard practice.
As shown in Chart 6, bid-to-cover ratios for treasuries with different tenors are still well above 2x, indicating healthy demand despite the Trump administration’s policies or recent tariff wars.
Chart 6: Bid-to-Cover Ratios for Various Treasury Maturities
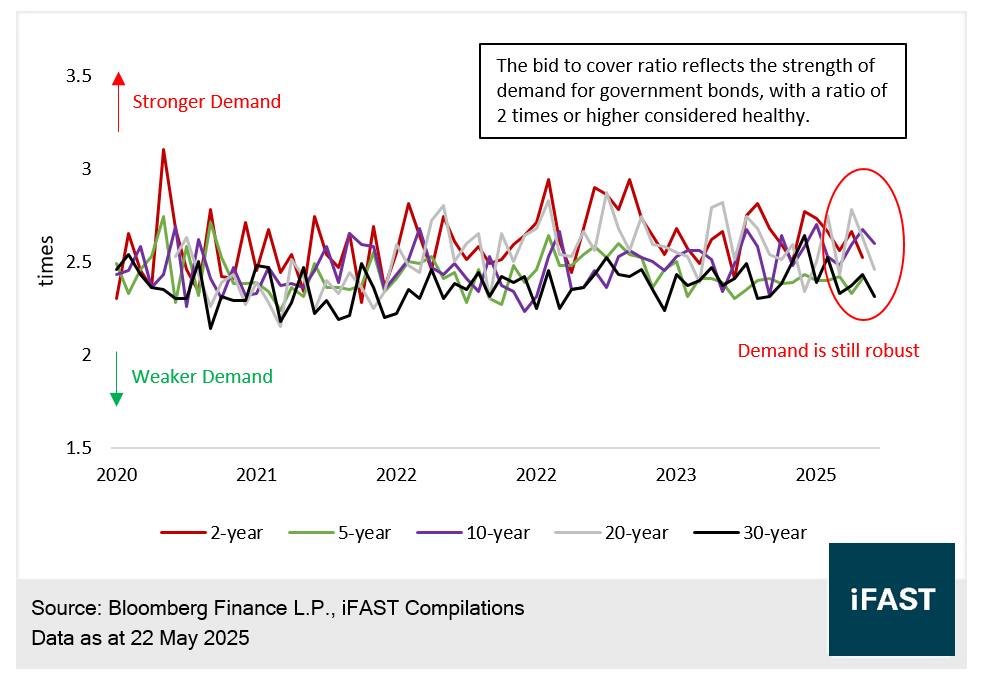
However, after Trump announced his “One Big Beautiful Bill Act” with significant tax cuts, markets grew concerned about increased debt issuance. In a recent $15 billion 20-year Treasury auction, demand weakened notably (bid-to-cover ratio fell to 2.4x), raising the market attention. We believe this may be a short-term reaction, and it is premature to conclude that Treasury demand is declining. Continued monitoring is necessary.
In extreme scenarios, if Treasury demand plummets, the Federal Reserve could purchase Treasuries through quantitative easing (QE), artificially creating demand. While this may lead to inflation or dollar depreciation, it prevents default.
Fiscal Deficit Likely to Remain High or Increase Further
To address the deficit, Trump’s “revenue generation and cost-cutting” measures include:
- Imposing tariffs to increase revenue.
- Establishing the Department of Government Efficiency (DOGE) to reduce spending.
- Reducing NATO military contributions by urging allies to increase defense spending to 5% of GDP.
- Implementing domestic tax cuts (e.g., personal income, estate, and corporate taxes) to stabilize the economy.
Under our best case scenario (see Table 1), with a 10% global tariff, 40–50% tariffs on China, NATO allies increasing defense spending to 3% of GDP, and full implementation of tax cuts, the fiscal deficit could decrease by approximately $135 billion, or 7% of the current $2 trillion deficit. However, under baseline assumptions, the deficit is likely to increase further.
Table 1: Impact of Trump’s Policies on the US Fiscal Deficit
|
Item |
Base Case Scenario |
Amount ($ Billion, Positive = Revenue Increase or Expense Reduction) |
Best Case Scenario |
Amount ($ Billion, Positive = Revenue Increase or Expense Reduction) |
|
Tariffs |
5% global, 40 - 50% on China |
+140 |
10% global, 60% on China |
+280 |
|
DOGE |
Based on current progress |
+123.5 |
More optimistic |
+181 |
|
NATO Defense |
Allies increase to 2% of GDP |
+49 |
Allies increase to 3% of GDP |
+274 |
|
Tax Cuts |
Personal, estate, corporate cuts |
-450 |
Full implementation of tax cuts |
-600 |
|
Total |
Deficit increases by ~$137.5 billion |
Deficit decreases by ~$135 billion |
||
|
Source: CITIC Securities, iFAST compilations Data as of 2 May 2025 |
||||
From a revenue perspective, tariffs would generate only an additional 6% of fiscal revenue (based on 2024 revenue and optimistic assumptions), insufficient to significantly reduce the deficit. If the reciprocal tariff policy is reinstated, most countries may struggle to absorb the high tariffs, potentially leading to a sharp decline in US imports and domestic consumption, triggering a recession. This could result in lower-than-expected tariff revenue and reduced collections from other taxes (e.g., personal income, corporate, and social security taxes), outweighing any benefits.
From a cost-cutting perspective, DOGE is expected to achieve less than 10% of its $2 trillion savings target, limiting its impact. With mandatory spending, defense, and interest payments comprising 85% of total expenditure, significant cost reductions are challenging.
In summary, whether based on policy expectations or the US fiscal structure, the fiscal deficit is likely to remain high or increase further.
Investors Need Not Worry About Treasury Default, But Long-Term Treasury Yields Face Upward Pressure
Rising deficits have raised concerns among rating agencies. Moody’s downgrade of the US sovereign rating from Aaa to Aa1 cited escalating government debt, expanding deficits, and fears that aggressive tariff policies could disrupt global trade. However, this downgrade does not indicate an increased risk of Treasury default. It merely reflects deteriorating credit metrics.
As noted, US debt is domestic debt, not foreign debt, making default highly unlikely. Investors need not worry about the default risk of Treasuries. Treasuries remain the benchmark for “risk-free” assets in financial markets.
However, we believe long-term Treasury yields face upward pressure. The current bond yields do not fully reflect the potential inflation resurgence or stagflation risks, nor do they provide adequate term premiums to compensate for duration risk. Additionally, the market’s expectation of 2–3 rate cuts this year could be overly optimistic, and the risk of slower rate cuts is not fully priced into long-term Treasuries.
For investors seeking stable returns, the ultra-short-term treasury (i.e., six-month US treasury) is an attractive option. These currently offer a yield to maturity of around 4%. A rollover strategy—reinvesting principal in six-month Treasuries upon maturity—provides a low-duration, flexible investment approach with minimal risk.
Table 2: 6-Month US Treasury
|
Bond Name |
Tenor |
Yield To Maturity |
| T 4.500% 15Nov2025 Govt (USD) | 0.5 year |
4.1% |
|
Source: Bondsupermart Data as of 26 May 2025 |
||
Declaration: For specific disclosure, at the time of publication of this report, IFPL (via its connected and associated entities) hold a position in T 4.500% 15Nov2025 Govt (USD) and the analyst who produced this report hold a NIL position in the abovementioned securities.