


- Housing activity is moderating: Higher rates, property tax reforms and weaker sentiment are weighing on demand, with 2Q26 new housing loan commitments down 5.2% QoQ and national prices down 3.1% QoQ in August 2026.
- Structural support remains intact: Around 1.2 million homes are required by September 2030, supporting underlying housing demand despite softer borrowing.
- Strong mortgage buffers: Big Four average mortgage LTVs were 37%–48% in 1H26, below their five-year averages, while high-LVR loans fell to 16.7% from 17.6%.
- Asset quality remains resilient: 30–89-day housing arrears declined to 0.54% from 0.66%, while non-performing housing loans remained low at 1.01%.
- Variable-rate mortgages support earnings resilience: Less than 5% of outstanding housing loans are fixed-rate, allowing banks to reprice most mortgage loans as rates change.
- Recommendation: We remain positive on Australia Big 4 Bank, investors may consider AUD Tier 2 bonds, offering attractive yields over 6%.
Australia Housing Market Moderates Amid Higher Interest Rates and Property Tax Reform
In 2026, the Reserve Bank of Australia (RBA) shifted from the easing cycle seen in 2025 to a tightening stance, implementing 100 basis-point rate hikes in February, March, May and September. This raised the cash rate from 3.60% to 4.60% as the RBA sought to contain persistent inflationary pressures. Adding to these headwinds, the Australian Government’s property tax reforms under the 2026–27 Federal Budget, including structural changes to negative gearing and capital gains tax, passed both houses of Parliament on 25 June 2026 and are scheduled to take effect in July 2027. The combination of higher borrowing costs and uncertainty surrounding the upcoming tax changes has reinforced caution among households and investors, contributing to a moderation in housing lending momentum.
This slowdown was particularly evident in 2Q26 (June 26), when the total value of new housing loan commitments declined by 5.2% QoQ to $97.6 billion (Table 1). The quarterly decline was primarily driven by the investor segment, where loan commitments fell by 10.2% QoQ to $37.1 billion. In contrast, owner-occupier lending proved relatively resilient, declining by a more modest 1.9% QoQ to $60.5 billion.
This is consistent with our previous assessment that the proposed property tax reforms are likely to weigh more heavily on investor demand, particularly for established residential properties. For further insight, please look previous article at Australia's Proposed Property Tax Reform: What Is the Impact on Australia's Banking Sector | Bondsupermart
Table 1: Australia Value of New Loan Commitments
|
|
June Qtr 26 $billion |
Mar Qtr 26 to Jun Qtr 26% change |
Jun Qtr 25 to Jun Qtr 26% change |
|
Owner occupier |
60.5 |
-1.9% |
6.0% |
|
Investor |
37.1 |
-10.2% |
8.1% |
|
Total loan commitments |
97.6 |
-5.2% |
6.8% |
|
Source: Australian Bureau of Statistics, iFAST Compilations. Data as of 30 June 2026 |
|||
Interest Rates Likely to Remain Restrictive in the Near Term
Looking ahead, the major Australian banks expect interest rates to remain elevated in the near term before easing gradually in 2027. CBA, WBC and NAB currently expect the cash rate to peak at 4.60%, while ANZ expects a higher peak of 4.85% following another 25bp hike in November 2026. CBA, WBC and NAB expect rate cuts to begin from August 2027.
Market pricing also points to a relatively restrictive interest rate environment, with ASX 30 Day Interbank Cash Rate Futures implying a cash rate of around 4.95% by July 2027, before cuts are priced in from February 2028.
The expectation that interest rates could remain elevated for longer may continue to weigh on housing affordability and borrowing demand in the near term. Nevertheless, the anticipated easing cycle in 2027 could provide some relief to borrowers and support housing demand. The timing and extent of future rate cuts will depend on inflation, household spending and broader economic conditions.
Table 2: Bank and Market Cash Rate Forecast
|
Bank and Market Projection |
2026 Forecast |
Forecast Peak Cash Rate |
2027 Easing Forecast (Cuts) |
|
Commonwealth Bank of Australia |
- |
4.6% |
2 x 0.25% Cuts from Aug 27 and Nov 27 |
|
Westpac Banking Corp (WBC) |
- |
4.6% |
3 × 0.25% cuts from Aug 27 |
|
National Australia Bank (NAB) |
Another hike possible in Nov |
4.6% |
Cuts expected from Aug 27 |
|
Australia and New Zealand Banking (ANZ) |
another +0.25% in Nov 2026 |
4.85% |
Cuts expected from Nov 27 |
|
ASX 30 Day Interbank Cash Rate Futures Implied Yield |
4.75% |
4.95% - Jul 27 |
Cut expected from Feb 28 |
|
Source: Respective Bank, iFAST Compilations. Data as of 29 September 2026 |
|||
Buyer Sentiment Weakens as Auction Clearance Rates Decline Amid Softer Established Housing Demand
The moderation in housing demand is also evident in forward-looking auction indicators. Following the 2026 Federal Budget announcement on 3 May 2026, the combined capital city auction clearance rate declined from 60.2% to 50.0% by 24 July 2026, before falling further to 49.1% by 20 September 2026. The clearance rate remained well below the 71.6% recorded in the corresponding week a year earlier, indicating weaker auction conditions compared with the same period in 2025.
The weaker auction clearance rate points to softer demand for established residential properties amid elevated borrowing costs and upcoming property tax changes. This is particularly relevant for investor demand, as changes to negative gearing and capital gains tax could reduce the relative attractiveness of established residential properties compared with new housing.
Table 3: Capital city auction clearance rates
|
Pre-property tax reform announcement (3 May 2026) |
24 July 2026 |
20 September 2026 |
||||
|
Last Week |
Last Year |
Last Week |
Last Year |
Last Week |
Last Year |
|
|
Sydney |
60.0% |
62.5% |
47.4% |
69.4% |
46.2% |
71.7% |
|
Melbourne |
61.8% |
66.8% |
56.5% |
71.1% |
54.2% |
71.6% |
|
Brisbane |
52.7% |
48.1% |
35.9% |
64.9% |
31.4% |
61.9% |
|
Adelaide |
64.0% |
53.5% |
54.9% |
72.1% |
46.4% |
82.1% |
|
Canberra |
51.9% |
63.0% |
27.8% |
60.7% |
53.6% |
76.0% |
|
Combined Capital |
60.2% |
63.1% |
50.0% |
69.4% |
49.1% |
71.6% |
|
Source: Cotality, iFAST Compilation. Data as of 20 September 2026 |
||||||
Housing Market Shows Increasing Regional Divergence
The cooling lending environment has contributed to an increasingly uneven housing market. National housing values declined by 0.9% MoM and 3.1% QoQ as of August 2026, although they remained 2.7% higher YoY. The weakness has been concentrated in the major East Coast markets, with Sydney and Melbourne home values declining by 4.7% and 3.9% QoQ, respectively (Table 4).
The sharper correction in Sydney and Melbourne may partly reflect higher household leverage and debt burdens in these markets, making borrowers more sensitive to elevated interest rates and tighter lending conditions. These markets also experienced weaker auction clearance rates, suggesting that softer buyer demand is increasingly feeding through to established property prices.
While most capital cities recorded negative monthly and quarterly price movements, Sydney and Melbourne recorded the largest annual declines of 4.6% and 4.7%, respectively. Conversely, Perth, Darwin and Brisbane recorded annual price growth of 15.6%, 14.6% and 10.8%, respectively. Their resilience may be partly supported by stronger population growth, with Perth, Brisbane and Darwin recording some of the fastest population growth among Australia's major capital cities in 2024–25, at 2.4%, 2.1% and 1.7%, respectively (Table 5).
Strong population inflows, supported by both internal and overseas migration, could continue to underpin housing demand in these markets. This divergence highlights the uneven impact of tighter monetary conditions across Australia's housing market, with the major East Coast markets experiencing greater price pressure while several smaller capitals and regional areas remain relatively resilient.
Table 4: Australian Home Value Growth by Capital City and Region
|
Capital City |
Month |
Quarter |
Annual |
|
Sydney |
-1.4% |
-4.7% |
-4.6% |
|
Melbourne |
-1.1% |
-3.9% |
-4.7% |
|
Brisbane |
-1.0% |
-2.7% |
10.8% |
|
Perth |
-0.8% |
-3.2% |
15.6% |
|
Adelaide |
-0.8% |
-1.6% |
8.6% |
|
Hobart |
-0.2% |
-0.2% |
8.1% |
|
Darwin |
0.6% |
0.9% |
14.6% |
|
Canberra |
-1.1% |
-2.8% |
-0.4% |
|
Combined Capital |
-1.1% |
-3.7% |
1.1% |
|
Combined regional |
-0.4% |
-1.2% |
7.7% |
|
National |
-0.9% |
-3.1% |
2.7% |
|
Source: Cotality, iFAST Compilation. Data as of 31 August 2026 |
|||
Table 5: Population change by capital city 2024-2025
|
Capital City |
Estimated Resident Population (ERP)* |
2024-25 Growth Rate |
Natural increase |
Internal migration |
Overseas migration |
|
Sydney |
5,638,830 |
1.4% |
30,109 |
-33,282 |
78,403 |
|
Melbourne |
5,435,590 |
2.0% |
32,416 |
-8,554 |
81,168 |
|
Brisbane |
2,833,524 |
2.1% |
13,212 |
11,077 |
33,934 |
|
Perth |
2,452,765 |
2.4% |
12,588 |
8,211 |
37,289 |
|
Adelaide |
1,491,015 |
1.3% |
3,248 |
-2,425 |
17,824 |
|
Hobart |
255,250 |
0.2% |
587 |
-1,878 |
1,833 |
|
Darwin |
159,284 |
1.7% |
1,302 |
-1,430 |
2,847 |
|
Canberra |
484,630 |
1.3% |
2,882 |
-1,501 |
4,819 |
|
Total Capital City |
18,750,888 |
1.8% |
96,344 |
-29,782 |
258,117 |
|
*Data as of 30 June 2025 *Natural increase (birth minus deaths) *Negative internal migration means that more people move out of a specific region or city than move in within the same country. Source: Australian Bureau of Statistics, iFAST Compilations. Data as of 2024-25 financial year |
|||||
Structural Supply Shortfall Supports Housing Prices
Despite the near-term moderation in demand, structural supply constraints remain an important support for Australian housing prices. The National Housing Supply and Affordability Council (NHSAC) forecasts that Australia will require 1.2 million new homes over the five years to September 2030 to meet projected housing demand, driven by population growth and higher net overseas migration since 2022. The Australian Government has also maintained the Permanent Migration Program at 185,000 places for 2026–27 although gradually moderate, providing continued support for population growth and underlying housing demand.
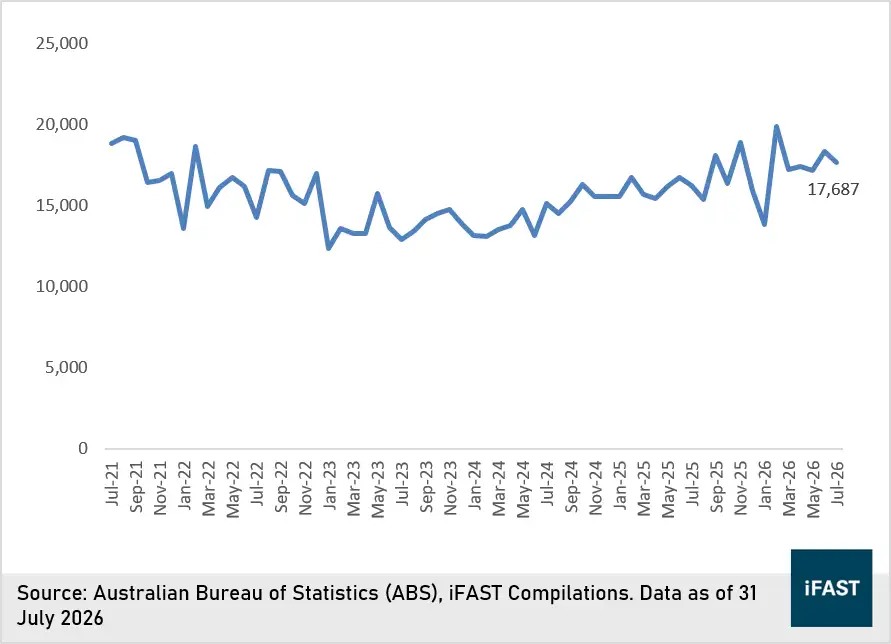
This implies a requirement of approximately 20,000 new homes per month. However, historical building approvals have generally remained below this level. Approximately 938,888 new homes were approved over the past five years, equivalent to an average of around 15,648 approvals per month. More recently, building approvals stood at 17,687 in July 2026, still below the estimated monthly requirement (Chart 1).
At the same time, higher construction costs and labour shortages continue to constrain housing supply. Building construction cost growth accelerated from 2.2% in June 2025 to 4.9% in June 2026, while the recent conflict in the Middle East has added further uncertainty through higher fuel and transportation costs.
If housing supply continues to lag underlying demand, the resulting supply-demand imbalance could provide support for housing prices, particularly in areas where population growth and housing demand remain strong.
Chart 1: Australia Building Units Approved
Near-Term Moderation but Structural Support Remains
Looking ahead, Australia’s housing market is likely to remain under pressure in the near term as elevated interest rates and uncertainty surrounding the upcoming property tax reforms weigh on borrowing demand and buyer sentiment. Housing prices could remain soft, particularly in Sydney and Melbourne, where prices have already declined significantly from recent peaks.
However, a broad-based downturn appears less likely given the persistent housing supply shortage and continued population growth. The anticipated easing cycle from 2027 could also provide relief to household borrowing costs and support housing demand and prices.
Big Four Banks: Strong Mortgage Exposure but Significant Loan To Value Buffer Against Property Price Declines
Australia’s banking sector is dominated by the “Big Four” banks: Commonwealth Bank of Australia (CBA), Westpac Banking Corporation (WBC), National Australia Bank (NAB) and Australia and New Zealand Banking Group (ANZ). As of 31 August 2026, the four banks collectively accounted for around 70% of the Australian banking market, with combined loan portfolio exceeding AUD4.2 trillion, compared with approximately AUD5.9 trillion for the national banking system, as shown in Table 6.
From a credit perspective, mortgages account for a significant portion of the Big Four banks’ domestic loan books, ranging from 49% to 71%, underscoring the importance of housing credit to their asset portfolios.
The Big Four banks’ relatively low average loan-to-value (LTV) ratios provide a sizeable buffer against property price declines. As of 1H26, LTVs, adjusted for property appreciation and principal repayments, ranged from 37.0% to 48.0%, slightly below their respective five-year averages of 39.4% to 49.2%.
Even under a worst-case scenario of a 50% decline in property values (just on a theoretical basis, not our base case), the banks’ average LTVs would increase to between 74% and 96%, remaining below 100%. This indicates that, on an average portfolio basis, the mortgage portfolios would still be supported by positive property equity even under a substantial property price correction.
Table 6: Big Four Banks’ Market Capitalisation and Loan Portfolio
|
CBA |
WBC |
NAB |
ANZ |
|
|
Market Capitalisation (AUD $Billion) |
268 |
120 |
118 |
112 |
|
Loan Portfolio (AUD $Billion) |
1,252 |
1,192 |
984 |
781 |
|
Source: Savings.com.au, iFAST Compilations. Data as of 31 August 2026 |
||||
Table 7 Loan-to-Value Sensitivity to Property Price Declines
|
Banks |
Loan Book Exposure to Mortgages |
Average 5Y |
1H26 |
10% decline |
30% decline |
50% decline |
|
CBA |
71% |
44.4% |
41.3% |
45.9% |
59.0% |
82.6% |
|
WBC |
60% |
49.2% |
48.0% |
53.3% |
68.6% |
96.0% |
|
NAB |
55% |
39.4% |
37.0% |
41.1% |
52.9% |
74.0% |
|
ANZ |
49% |
42.8% |
39.0% |
43.3% |
55.7% |
78.0% |
|
Source: Company Report, iFAST Compilations. Data as of 31 December 2025 and 31 March 2026 |
||||||
Variable-Rate Mortgages Support Bank Earnings Despite Manageable Borrower Pressure
Fixed-rate mortgages now account for less than 5% of outstanding housing loans, meaning most borrowers are exposed to prevailing variable mortgage rates. For the Big Four banks, this allows a large proportion of mortgage loans to be repriced as interest rates change, supporting lending income while rates remain elevated, although higher funding costs and weaker loan demand could offset part of the benefit.
For borrowers, the low fixed-rate share means higher interest rates are transmitted relatively quickly into monthly mortgage repayments. This could place greater pressure on household disposable income, particularly among highly leveraged borrowers or those with limited repayment buffers.
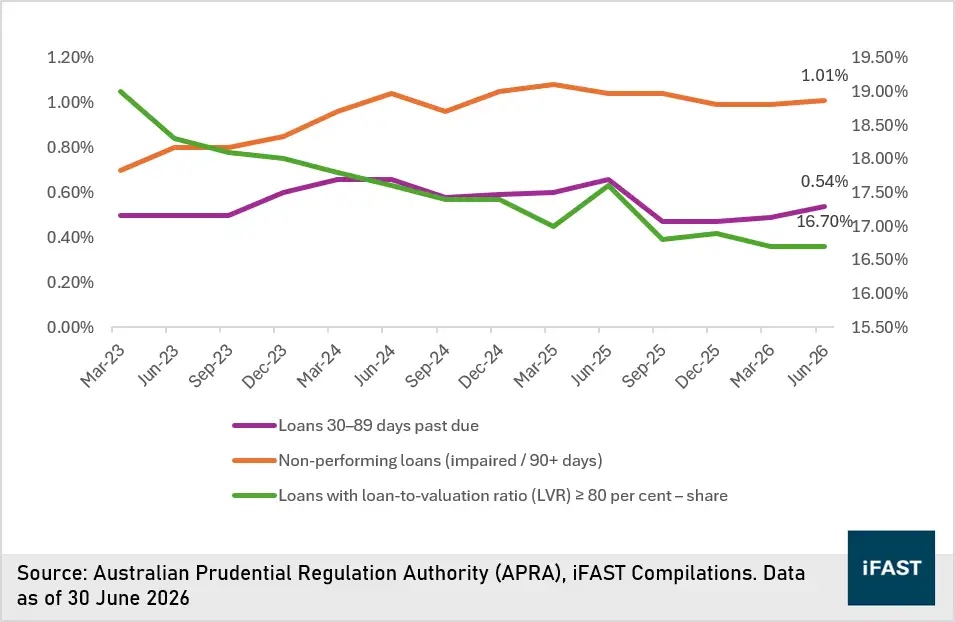
Encouragingly, underlying borrower fundamentals remain sound. According to the APRA, key asset quality indicators for Authorised Deposit-taking Institutions (ADIs) continue to improve (Chart 2). Short-Term Arrears (30–89 days past due) has dropped from 0.66% (Jun ’25) to 0.54% (Jun’ 26) which serves as an early sign that fewer households are experiencing short-term mortgage stress. Furthermore, non-performing loans (90+ days) decreased from 1.04% to 1.01% over the same period, suggesting that severe defaults are shrinking and remains historically very low.
In addition, the proportion of loans with loan-to-valuation ratios (LVR) above 80% fell slightly from 17.6% into 16.7% in the same period. A decline in this metric indicates lower risk to lenders and an improved borrower equity positions which provides a better financial buffer if house prices fall.
Chart 2: Australian Authorised Deposit-taking Institution Residential Mortgage Risk Indicators
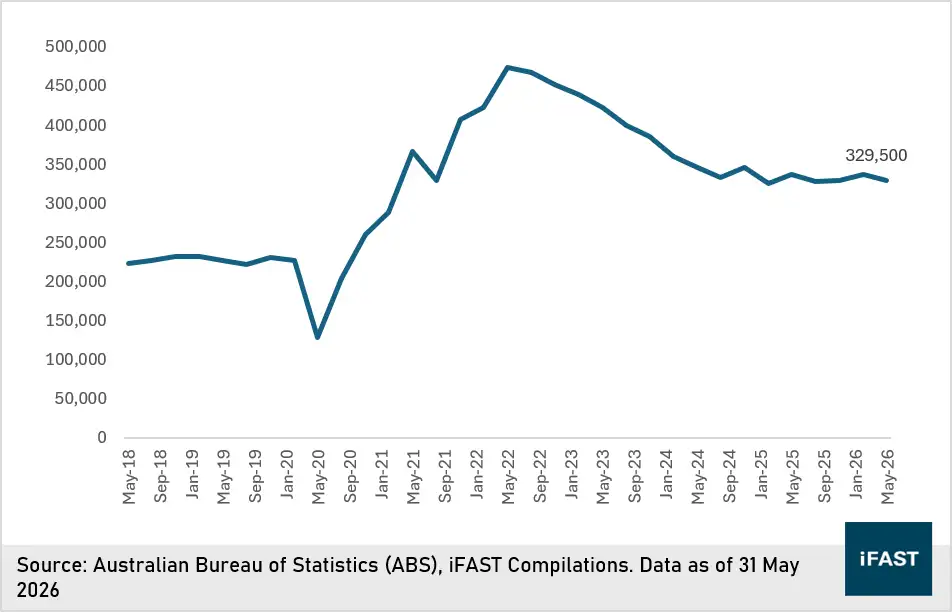
At the same time, Australia’s labour market conditions remain supportive, with the unemployment rate at 4.5% in July 2026, below the pre-pandemic annual average of 5.2%. (Chart 3) Job vacancies has fell slightly to 329,500 in May 2026, down from 336,600 in February 2026, and remain well above the pre-pandemic average of 226,000. (Chart 4) This reflects resilient employment conditions, which underpin household income stability and help contain mortgage credit risk.
Overall, Australia’s housing market is expected to moderate in 2026 given higher interest rates and macro uncertainty. Nonetheless, the combination of a tighter underwriting, sound borrower fundamentals and resilience labour market conditions should help cushion and limit the extent of any potential downturn.
Chart 3: Australia’s unemployment level
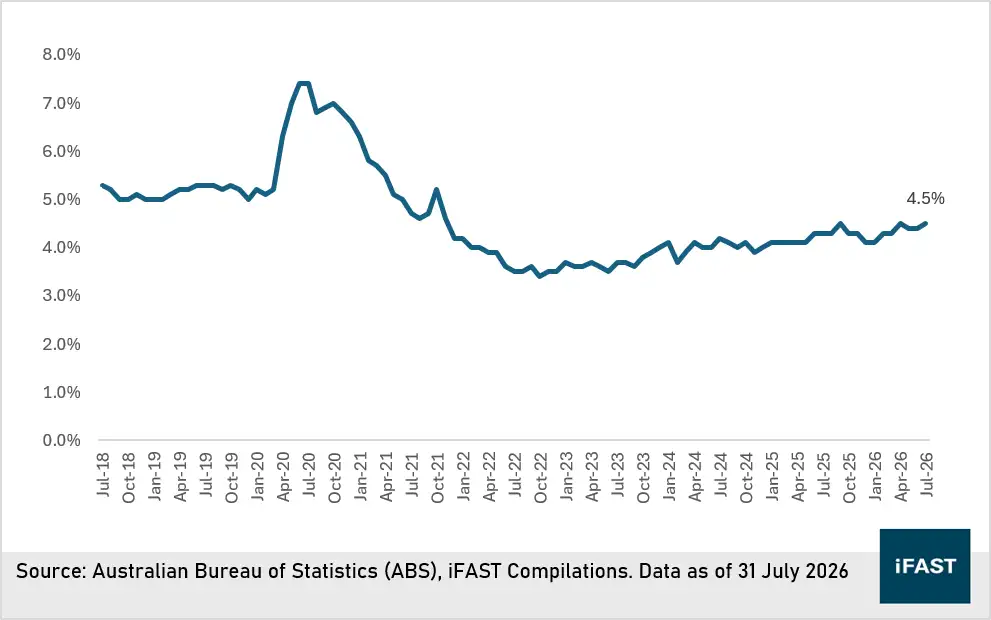
Chart 4: Australia’s Job vacancies
All in One
In our view, Australian housing prices are more likely to moderate gradually rather than experience a significant downturn, while the expected slowdown should be viewed as a moderation in housing lending growth rather than a deterioration in credit quality, supported by:
- Housing activity is moderating as elevated interest rates, upcoming property tax reform weaker buyer sentiment weigh on new lending and property prices, particularly in Sydney and Melbourne.
- Structural housing undersupply and population growth should continue to provide underlying support for housing demand and prices, despite weaker near-term borrowing demand.
- The Big Four banks remain well buffered against housing downside, with average mortgage LTVs below their five-year averages and relatively limited exposure to high-LTV mortgages.
- Variable-rate mortgages support bank earnings resilience, as most outstanding mortgages can be repriced as interest rates change. However, prolonged high rates continue to place pressure on borrowers and could weigh on loan growth.
- Resilient household and labour market fundamentals should support mortgage repayment capacity, with unemployment remaining relatively low and mortgage arrears and non-performing loans showing improvement.
Overall, while we expect weaker housing activity and softer property prices to weigh on mortgage lending growth in the near term, structural housing shortages, resilient household fundamentals, strong borrower equity buffers and contained asset quality deterioration should help limit risks to the Big Four banks.
At the same time, the predominantly variable-rate mortgage structure allows banks to reprice a large portion of their housing loan books as interest rates change, providing support for overall lending income and earnings resilience despite slower loan growth.
Recommendation
For investors seeking higher yields and willing to accept modestly higher risk, subordinated Tier 2 bonds from these banks offer an attractive opportunity, with yields to call ranging from 6.6% to 6.8%, as highlighted in Table 8.
It is important to note that Tier 2 bonds carry loss absorption risk, as their loss-absorbing features may be triggered in the event of a non-viability scenario. When assessing these instruments, both yield and years to call are key considerations. Under Basel III regulations, Tier 2 bonds not redeemed past their call date must be amortised, which encourages issuers to call and refresh their Tier 2 capital earlier, ultimately benefiting investors. Additionally, investors should remain mindful of currency risk, particularly potential depreciation of foreign currencies against the MYR, which could reduce overall returns.
In addition, APRA is phasing out the use of Additional Tier 1 (AT1) capital and increasing reliance on Tier 2 capital from 2027. This could lead to greater Tier 2 bond issuance and potentially put upward pressure on spreads, which may affect the market value of existing Tier 2 bonds.
Table 8: Long Term AUD Tier 2 bonds
|
Bond name |
Ask Price |
Year to Call/Maturity |
Yield to Call/Maturity |
Min / Sub investment amount |
Credit Rating (Fitch) |
|
96.592 |
8.2/13.2 |
6.6%/6.5% |
AUD200,000/10,000 |
A |
|
|
93.160 |
8.7/13.7 |
6.7%/6.6% |
AUD10,000/10,000 |
A- |
|
|
98.350 |
9.6/14.6 |
6.8%/6.7% |
AUD1,000/1,000 |
A- |
|
|
96.860 |
7.8/12.8 |
6.6%/6.6% |
AUD1,000/1,000 |
A- |
|
|
Source: Bondsupermart, iFAST Compilations. Data as of 01 October 2026 |
|||||









