March was a decent month for fixed income markets, closing out the volatile quarter on a good note. Fixed income markets generally delivered positive returns in March with Global bonds (gauged by the Bloomberg Barclays Global Aggregate Index) rising by 0.6% (fixed income performances are on a total returns basis in local currency terms, unless otherwise stated).
US treasury yields, both the shorter and longer tenors, edged higher in the month, falling in the first week but rebounding after inflation data came in hotter than expected. Both the Fed and ECB opted to leave policy rates unchanged during their respective March meetings. In particular, the Fed remained cautious on early rate cuts and maintained its stance on cutting rates only when “inflation is moving sustainably toward 2%”.
Similar to prior months, credit spread compression continued to drive the performance of bond markets in March. Global high-yield bonds (gauged by the Bloomberg Barclays Global High Yield Index) rose by 1.5%, helped by spread compression from US high-yield bonds. Asian high-yield bonds (gauged by the Bloomberg Barclays Asia USD High Yield Index) rose by 1.9%, as spreads from ex-China high-yield credit compressed.
Emerging market hard currency bonds (gauged by the Bloomberg Barclays EM Hard Ccy Agg Index) were the strongest performer in March, rising by 2.8%. As compared to February, upward pressure on the US dollar eased, helping to alleviate headwinds that weighed on this segment last month.
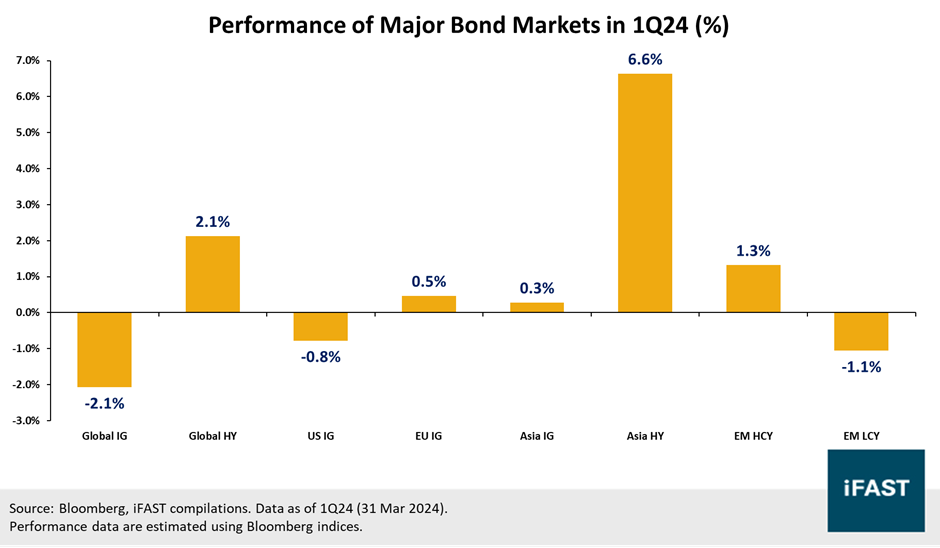
On a quarterly basis, fixed income markets took a breather after a spectacular rally in the previous quarter 4Q23 (Chart 1). Global investment grade bonds (gauged by the Bloomberg Barclays Global Aggregate Index) returned -2.1% and were the bottom-performing market this quarter. The steep re-pricing (higher) of government yields across the quarter weighed on performance for global bonds, which generally possess a longer aggregate duration.
On the other hand, Asian high yield and Global high yield bonds were among the top-performing fixed income markets, returning 6.6% and 2.1% respectively. Resilient economic data continued illuminating a soft-landing outcome, supporting spread compression over the quarter. Meanwhile, multiple government support measures for China’s property sector were announced in 1Q24, driving the spread compression of Asian high yield bonds which have a large exposure to China property bonds.
For an in-depth discussion on the top fixed income markets in 1Q24, do read our article - "Top Fixed Income Markets in 1Q24".
Chart 1 : Performance of Major Bond Markets in 1Q24
*Bond market performances are on a total returns basis in local currency terms
Across the fixed income landscape, we continue to see yield opportunities. The re-surgence of energy prices and ongoing US labor market tightness is increasingly suggesting a slower-than-expected decline in inflation. At the same time, central bankers remain committed to rein in inflation and are cautious to cut policy rates. Collectively, resilient data and central banks’ have resulted in further push back of the timeline and magnitude of rate cuts.
Amidst this backdrop, which we expect to persist for majority of 2024, we recommend a shorter-duration bond exposure. Assuming that shorter-end yields remain anchored, we see room for longer-end yields to increase, and for the yield curve to re-steepen, before investors consider adding duration. We also recommend investors stay up in quality, with a preference for investment-grade over high-yield bonds as highlighted above. We generally prefer investment-grade bonds with shorter duration.
In March, we saw more trades in SGD than USD bonds. Thomson Medical Group’s 5.5% bond was the top traded bond. Other top trades include Commerzbank Aktiengesellschaft’ 5.7% bond, HSBC’s 5.3% bond, BNP Paribas; 4.75% bond and Barclays’ 8.3% perp.
Table 1: Top traded bonds on SG Bond Express in March
Thomson Medical Group (“TMG”)
Established in 1979, TMG has since become one of the leading listed healthcare players in the Southeast Asian region, with operations in Singapore and Malaysia – and has recently expanded into the Vietnamese market. In January, TMG acquired Far East Medical Vietnam Limited (“FEMV”), which operates a range of healthcare facilities in Vietnam, giving the Group a strategic position in the nation’s healthcare market.
For the half year ended 31 December 2023 (1H24), TMG recorded an 8.6% year-on-year (“YoY”) decline in revenue due to lower contribution from its Singapore business. Consequently, EBITDA (adjusted from one-off transactions and non-recurring costs) and profit after tax fell -20.3% YoY and - 79.7% respectively, weighed down further by higher finance costs and operating expenses. Operating expenses were higher mainly due to one-time transaction costs and foreign exchange loss incurred in relation to the acquisition of FEMV. That said, moving ahead, we expect FEMV to contribute and be accretive to the Group’s net profit.
TMG’s credit profile has deteriorated post-acquisition. Total debt has risen from SGD 747.8M (Jun ’23) to SGD 1,106.9M (Dec ‘23) while cash balance has moderated from SGD 286.6M (Jun ’23) to SGD 271.9M (Dec ‘23). As such, net gearing has risen from 0.8x (Jun ’23) to 1.5x (Dec ‘23), while net debt to EBITD has risen from 4.5x (Jun ’23) to 10.9x (Dec ‘23). We believe the additional contributions from FEMV will allow for gradual improvements in its credit profile, although this may take time.
Given the deterioration in the credit profile, higher credit spreads, and elevated benchmark rates, we believe it will be unlikely for Thomson Medical to opt for the earlier call option on TMGSP 5.500% 31May2028 Corp (SGD).
BNP Paribas (“BNP”)
BNP Paribas is a France-based multi-national bank and the overall banking leader across the European Union. Within the region, the bank oversees four key domestic markets – Belgium, France, Italy, and Luxembourg. BNP Paribas segregates its operations into three major divisions – Corporate & Institutional Banking (“CIB”), Commercial, Personal Banking & Services (“CPBS”) and Investment & Protection Services (“IPS”).
For the full year ended 31 December 2023 (“FY23”), revenue rose by 3.3% YoY, while operating expenses managed to fall by 1.0% YoY. The higher revenue was driven by organic growth across most of its businesses, further bolstered by lower expenses. Operating income and net income increased significantly y 14.9% and 14.1% YoY respectively, with the sale of the Bank of the West (February 2023) making a significant contribution.
Asset quality for BNP remains stable as the cost of risk was 32 bps for FY23, within the guidance of below 40 bps. Meanwhile, the Group is well-capitalized with a CET1 ratio of 13.2% as of 31 December 2023, above the regulatory minimum level of 10.2%. Liquidity remains robust with a liquidity coverage ratio of 148% and liquidity reserve of EUR 474b, covering more than 60% of the total deposits as of 31 December 2023.
HSBC Holdings PLC (“HSBC”)
HSBC Holdings PLC (“HSBC”) is one of the world’s largest banking and financial services organisation, which serves customers across 62 countries and territories. Headquartered in London, HSBC has been building a global network of operations – with a particular focus on Asia in the foreseeable future.
For the full year ended 31 December 2023 (“FY23”), HSBC saw an increase in revenue by 32% YoY driven by the rise in both net interest and non-net interest income. HSBC’s profit before tax (“PBT”) saw a drastic 78% YoY jump, hitting record profits. We remain optimistic about HSBC’s profit outlook anchored by its 1) proposition as a global bank, 2) continued cost discipline, and 3) resilient banking NII.
HSBC’s credit profile remained resilient and largely stable. The Group’s asset quality was roughly unchanged, with expected credit losses (“ECL”) at 33 bps in FY23 as compared to 35 bps in FY22. The Group expects an ECL charge of 40 bps in FY24. Despite continuing to hold its portfolio in China, we expect a minor impact on further credit losses coming from China.
HSBC’s CET1 ratio was 14.8% as of December 2023, providing a substantial buffer over the 11.2% regulatory minimum level. Meanwhile, liquidity continues to remain adequate with a liquidity coverage ratio of 136%, net stable funding ratio of 133%, and high-quality liquid assets of USD 795b (against total deposits of USD 1,612b).
Barclays Bank (“Barclays”)
Barclays PLC (“Barclays”) is a British multinational bank, primarily operating in the United Kingdom although its footprints can be found across the globe. The Group’s operations are segregated into two divisions, Barclays UK (“BUK”) and Barclays International, while its operations are supported by its service company, Barclays Execution Services.
For the full year ended 31 December 2023 (“FY23”), Barclays saw a 2% YoY improvement in revenue. However, higher total operating expenses and higher credit impairment charges resulted in a -15% YoY decline in attributable profit. We believe net interest margin has peaked for Barclays and growth in net interest income will be minimal as deposits passthrough is expected to increase moving forward. We think management are optimistic in their guidance but we remain conservative and expect single-digit earnings growth for Barclays moving forward.
Barclays’ credit profile remained relatively stable. The Group’s CET1 ratio was 13.8% as of December 2023, staying within the Group’s 13-14% target range, and above the 12.0% regulatory minimum level. Barclays has more than sufficient liquidity, with an estimated liquidity pool at GBP 298b as of December 2023, covering around 55% of total deposits. The average liquidity coverage ratio and net stable funding ratio were at 161% and 138% respectively, well-buffered from the regulatory requirement of 100%.
Commerzbank Aktiengesellschaft (“CMZB”)
CMZB is one of Germany’s largest commercial banks with operations in around 50 countries. The lender serves its clients through approximately 800 branches in Germany, as well as multiple operational foreign branches and representative offices outside of Germany.
For the full year ended 31 December 2023 (“FY23”), CMZB saw a 29% YoY growth in net interest income (“NII”), driven by strong customer business and rates despite higher interest expense. Operating profit also climbed by 63% YoY, supporting a 55% YoY growth in net profit which was the best in over 15 years. Moving ahead, management expects NII to contract slightly but remain higher than FY22 based on forward rates. That said, the Group aims for a net result above last year.
CMZB’s credit profile remains resilient, supported by improved profits. The Group’s CET1 ratio was 14.7% as of 31 December 2023, providing a large buffer above the 10.3% regulatory minimum level. Liquidity position remains comfortable with a liquidity coverage ratio of 145.4% and a net stable funding ratio of 130.2%, above the regulatory requirement of 100%. The Group recorded a 14% YoY increase in highly liquid assets to EUR 134b. In November 2023, S&P Global Ratings upgraded CMZB’s outlook to positive from stable and affirmed its 'A-/A-2' ratings.