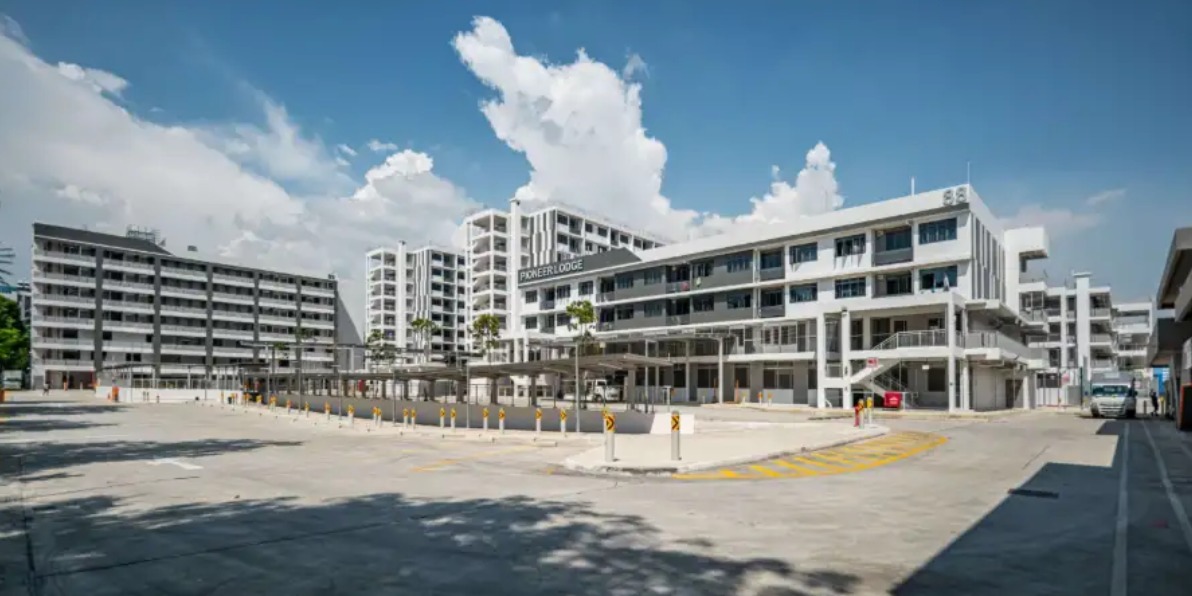
Ho Bee Land (HBL) is a property development and investment company headquartered in Singapore. It started as a residential developer (and is perhaps most well-known as the pioneer developer of Sentosa Cove) but has gradually diversified over the years into commercial developments.
We first covered this issuer when it did its inaugural green bond issuance in July 2024 (see link below). Following their recent FY24 results release, we think HBL remains a steady issuer, and think its bonds are an attractive proposition as one of the few remaining within the SGD space with yields of around 4%.
Related article: Ho Bee Land announces 5y SGD senior unsecured green bonds at IPG of 4.60%
Financial highlights
(Note: Dollar amounts refer to SGD, and growth rates are YoY unless otherwise stated. Results are for FY24 unless otherwise stated.)
Top-line revenues grew strongly by +19%, from $445m in FY23 to $528m in FY24. This was primarily attributed to higher property development revenues (+39% to $262m), driven by the sales of a development site in Gold Coast (Australia) and increased sales recognition from Turquoise in Sentosa Cove. Meanwhile, property investment – this tends to be the more stable of the two segments – delivered a small but steady +4% increase in revenues to $266m, attributed to additional contributions from the newly-completed Elementum.
However, operating costs generally increased in line with higher revenues. Cost of sales for (residential) property development climbed by +50% to $207m, while direct rental expenses rose by +45% to $32m. Taking these together, operating profits increased only by a marginal +1% (Chart 1).
Changes in FY24 profits (relative to FY23) were instead driven by other line items regarding divestment-related and fair value changes (Chart 2).
- HBL saw much smaller fair value losses of -$17m in FY24, compared to the -$364m in FY23. Management reported that this was mainly due to a stabilisation of valuations of its London investment properties.
- HBL also recorded $70m in ‘other gains’ in FY24, +33% higher than the $53m in FY23. A large proportion of this $70m figure was driven by the sale of its 49% stake in Elementum (announced in August 2024) which resulted in a combination of divestment gains (about $35m) and remeasurement gains (about $36m).
Net finance costs remained stable, falling by -3% from $158m in FY23 to $153m in FY24. This appears to be another sign of stabilisation for HBL after these costs had previously increased by +79% in FY23 (from FY22). Management attributed this to multiple factors, including lower debt levels (from loan repayments) and lower policy rates by central banks (likely primarily from the Bank of England).
To conclude, HBL’s profitability rebounded into the green in FY24 (Table 1). Profit before tax (PBT) rebounded from -$219m (losses) in FY23 to $152m in FY24, while profit after tax (PAT) also rebounded from -$259m (losses) in FY23 to $110m in FY24. As referenced above, the large improvement in profitability can be attributed to divestment-related and fair-value changes.
Chart 1: Operating profits were largely unchanged despite higher revenues
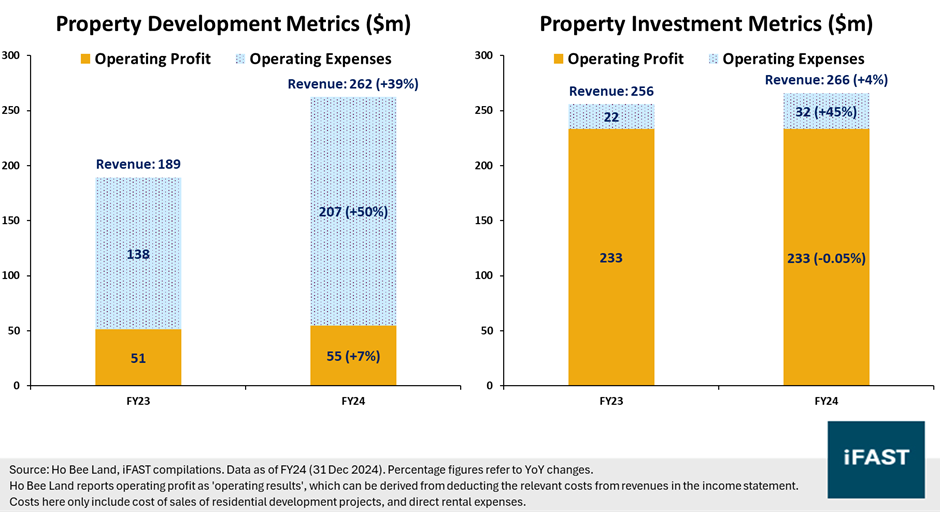
Chart 2: Other gains from Elementum helped to lift profits
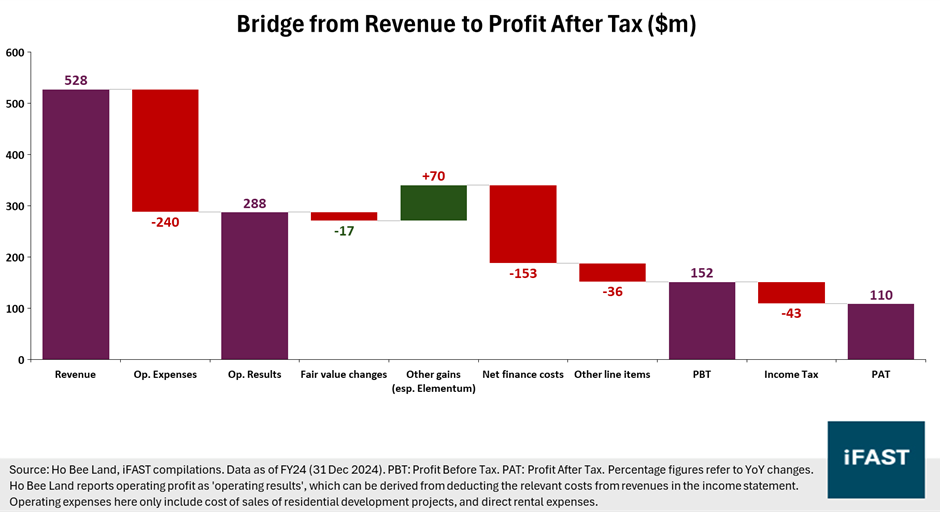
Table 1: HBL turned profitable in FY24, after losses in FY23
| Breakdown of Profits ($m) | FY23 | FY24 | YoY Change |
| Revenue | 445 | 528 | +19% |
| Operating Expenses | -160 | -240 | +50% |
| Operating Results | 285 | 288 | +1% |
| Fair value changes | -364 | -17 | N.M. |
| Other gains (esp. Elementum) | 53 | 70 | +33% |
| Net finance costs | -158 | -153 | -3% |
| Other line items | -34 | -36 | +5% |
| Profit Before Tax | -219 | 152 | N.M. |
| Income tax | -40 | -43 | +5% |
| Profit After Tax | -259 | 110 | N.M. |
| Source: Ho Bee Land, iFAST compilations. Data as of FY24 (31 Dec 2024). Ho Bee Land reports operating profit as 'operating results', which can be derived from deducting the relevant costs from revenues in the income statement. Operating expenses here only include cost of sales of residential development projects, and direct rental expenses. | |||
Thoughts on FY24 results, and outlook ahead
We think these results reflect a stable operating performance (rather than a sharp improvement). As referenced above, operating profits were little changed, and fair-value changes were instead the primary driver between PBT and PAT movements. Operating cashflows even fell slightly from $319m in FY23 to $279m in FY24 – apart from the factors mentioned above, there were also slight FX effects in play ($31m in FY23 vs $12m in FY24).
These results were not too surprising to us. When we last covered this issuer, we mentioned that significant fair value losses were unlikely to repeat themselves in FY24, while HBL’s overall revenues and profitability should not deteriorate significantly too.
Looking ahead, we expect HBL’s revenues to remain stable over the next few years, with rental income serving as a source of stability (compared to other issuers more focused on development). HBL did not provide operational updates for FY24, but it shared in earlier cycles that it had an occupancy rate of around 95%, which we think indicates the high quality of its property investment assets.
We also do not expect HBL’s profitability to decline significantly over the next few years. On one hand, (i) gains related to Elementum may be hard to repeat given that HBL only owns a 51% stake today (vs 100% previously), and (ii) the significant improvement in fair value changes (lesser losses) may be hard to replicate to the same extent in FY25 (given the already-large improvement in FY24). On the other hand, we also don’t see signs of major weakening across both the development and investment space, while net finance costs appear to have stabilised. We think the coming years will be marked by more modest growth (in the single-decent percentages) for both revenues and profits.
Credit highlights
HBL’s debt position and debt ratios generally improved in FY24, as management actively paid down various bank loans (Table 2). Total debt fell by -14% to $2,624m, leading to net debt also falling similarly by -16% to $2,441m. These helped to drive improvements in its net gearing ratio (net debt to equity) from 80% to 66%, and in its leverage ratio (total debt to assets) from 44% to 40%, both of which are healthy signs of HBL’s overall debt sustainability.
The debt reduction was reflected in current liabilities too, which fell by -47% to $366m. Consequently, HBL’s current ratio (current assets to current liabilities) improved from 112% to 187%, while its cash ratio (cash to current liabilities) similarly rose from 25% to 50%. These improvements underscore the issuer’s ability to manage its near-term borrowings.
Meanwhile, HBL’s interest coverage ratios remained fairly stable, helped by slightly lower net finance costs (-3% to $153m) (Table 3). Estimated PBITDA coverage (profits before interest, tax, depreciation and amortisation divided by net financing costs) improved from 1.9x to 2.1x, while cashflow coverage (operating cashflow divided by net financing costs) worsened slightly from 2.0x to 1.8x. Coupled with HBL’s $183m in cash (and equivalents), we think it should have little major issues making interest payments over the coming years.
To summarise, we think HBL’s credit profile appears stable in FY24. Management previously mentioned a desire to keep net gearing under the 80% level, and the consequent drop in net gearing to 66% in FY24 (referenced above) may be a sign of this commitment. Meanwhile, coverage ratios also remain decent (despite cashflow coverage dropping) and we do not see major red flags.
Table 2: Debt metrics generally improved in FY24
| Debt Metrics | FY23 | FY24 | YoY Change |
| Total Debt ($m) | 3,065 | 2,624 | -14% |
| Net Debt ($m) | 2,892 | 2,441 | -16% |
| Total Equity ($m) | 3,610 | 3,705 | +3% |
| Net Gearing (Net Debt / Equity) (%) | 80% | 66% | -14pp |
| Total Assets ($m) | 6,976 | 6,580 | -6% |
| Leverage Ratio (Total Debt / Assets) (%) | 44% | 40% | +4pp |
| Source: Ho Bee Land, iFAST compilations. Data as of FY24 (31 Dec 2024). | |||
Table 3: Interest coverage metrics were stable in FY24
| Interest Coverage Metrics | FY23 | FY24 | YoY Change |
| Est. PBITDA before fair value changes ($m) | 304 | 323 | +6% |
| Net finance costs ($m) | 158 | 153 | -3% |
| Est. PBITDA coverage ratio (x) | 1.93 | 2.11 | +18pp |
| Operating cashflow ($m) | 319 | 279 | -13% |
| Cashflow coverage ratio (x) | 2.02 | 1.82 | -20pp |
| Source: Ho Bee Land, iFAST compilations. Data as of FY24 (31 Dec 2024). | |||
Proposed AVJennings acquisition
(Note: For this section on AVJennings, its financial year (FY) ends in June each year, meaning 1H25 data is as of 31 December 2024.)
AVJennings Limited (AVJ) is a residential property development company based in Australia (with operations in New Zealand too), and the company is listed on both the ASX and SGX.
In January 2025, HBL announced that it had made a non-binding offer for all the outstanding shares of AVJ, offering AUD 0.70 per AVJ share. Based on latest figures, AVJ has about 558m shares outstanding; taking into account HBL has already acquired a 5.49% stake, a successful offer would require an outlay of about AUD 369m or SGD 314m (based on 1 AUD = 0.8492 SGD as of 17 March 2025).
(Note: There is a competing offer of AUD 0.67 made by another party which the Board of AVJ is concurrently considering – this may reduce the probability of Ho Bee Land succeeding.)
AVJ generally remained profitable in its last few reporting periods (observation period from June 2023 [FY23] to December 2024 [1H25]). Revenues grew by +9% to AUD 131m, though higher cost of sales meant that AVJ’s profitability weakened in 1H25 – for example, PAT fell by -13% from AUD 2.8m in 1H24 to AUD 2.5m in 1H25. A more concerning factor is AVJ’s net operating cashflows, which came in negative in FY23 and FY24 (specifically: negative in 1H24, positive in 2H24) and only recently turned mildly positive in 1H25 (AUD 2.0m), which might affect the overall cashflow profile of HBL if the acquisition succeeds.
Its debt levels and ratios are generally better (lower) than HBL’s, with a net gearing of 45% (HBL: 66%) and leverage ratio of 26% (HBL: 40%). A fully debt-funded acquisition might bring HBL’s leverage ratio up slightly, but the effects on net gearing are hard to determine at this point without knowing how HBL plans to fund this acquisition.
It is important to note that this is very much in the initial discussion stages and there is very little detail on whether the offer will succeed, and/or how Ho Bee Land plans to finance this acquisition. We think it is premature to conclude how this will affect HBL’s credit profile, and will revisit this when there is more clarity.
About the bonds
HBL’s bonds (HOBEE 4.350% 11Jul2029 Corp (SGD)) are one of the few 4%-yielding names remaining within the SGD universe. We provide a bond comparison in Table 4 below.
While HBL itself is not a REIT, it does have a strong commercial real estate presence, allowing us to compare its bonds against commercial-focused REITs’ bonds. It is clear that spreads in the SGD bond space have tightened significantly, with bonds from OUE REIT, CapitaLand Integrated Commercial Trust, Frasers Logistics and Commercial Trust, Mapletree Commercial Trust, and Suntec REIT, all trading at significantly lower yields. While HBL generally has worse ratios compared to these larger and better-established REITs (note: Suntec REIT is also a little more leveraged than the other names there), we think the yield pickup justifies the additional risk.
We also look at bonds of property developers, since HBL also has a sizeable part of its business there. Again, it is hard to compare them directly as HBL’s developments are more focused in Singapore (Sentosa Cove) and Australia, while GuocoLand and Wing Tai have lesser Australian exposure. However, it is again evident that HBL’s bonds offer a decent yield pickup, once again due to its comparatively weaker ratios.
To summarise, we think Ho Bee Land’s 2029 bonds offer an attractive proposition for investors hunting for yields around the 4% level – an increasing rarity within the SGD space. We think its financial and credit profiles remain decent (despite being relatively worse than better-established names from CapitaLand / Frasers / Mapletree), and Ho Bee Land should have little issue with repaying its bonds in 2029.
Table 4: Bond comparison (HBL bond bolded)
| Bond Name | Maturity Date (Years to Maturity) |
Ask Price | Yield to Maturity (%) | Credit Rating (S&P / Moody's / Fitch) |
| HOBEE 4.350% 11Jul2029 Corp (SGD) | - / 11 Jul 2029 (- / 4.3) |
101.200 | 4.04% | - / - / - |
| OUECT 4.100% 14Jun2027 Corp (SGD) | - / 14 Jun
2027 (- / 2.2) |
101.533 | 3.37% | BBB- / - / - |
| OUECT 3.900% 26Sep2031 Corp (SGD) | - / 26 Sep 2031 (- / 6.5) |
100.700 | 3.78% | BBB- / - / - |
| CAPITA 2.100% 08Mar2028 Corp (SGD) | - / 08 Mar
2028 (- / 3.0) |
97.533 | 2.98% | A- / A3 / - |
| CAPITA 3.938% 19Jun2030 Corp (SGD) | - / 19 Jun 2030 (- / 5.2) |
104.592 | 2.98% | - / A3 / - |
| FLTSP 3.830% 26Mar2029 Corp (SGD) | - / 26 Mar
2029 (- / 4.0) |
102.517 | 3.16% | NR / - / BBB+ |
| MCTSP 3.045% 27Aug2027 Corp (SGD) | - / 27 Aug 2027 (- / 2.4) |
100.200 | 2.96% | - / Baa1 / - |
| MCTSP 3.050% 22Nov2029 Corp (SGD) | - / 22 Nov
2029 (- / 4.7) |
100.110 | 3.02% | - / - / - |
| SUNSP 2.950% 05Feb2027 Corp (SGD) | - / 05 Feb 2027 (- / 1.9) |
99.379 | 3.30% | - / - / - |
| SUNSP 3.400% 27Mar2031 Corp (SGD) | - / 27 Mar
2031 (- / 6.0) |
100.100 | 3.38% | - / - / - |
| GUOLSP 4.400% 27Jul2028 Corp (SGD) | - / 27 Jul 2028 (- / 3.3) |
102.600 | 3.56% | - / - / - |
| WINGTA 4.380% 03Apr2029 Corp (SGD) | - / 03 Apr
2029 (- / 4.0) |
102.900 | 3.60% | - / - / - |
| Source: Bloomberg, Bondsupermart, iFAST compilations. Data as of 24 Mar 2025. | ||||
Declaration: For specific disclosure, at the time of publication of this report, IFPL (via its connected and associated entities) holds a position in HOBEE 4.350% 11Jul2029 Corp (SGD). The analyst who produced this report holds an NIL position in the abovementioned securities.
Our podcast series, Yield Hunters, is available on Spotify, iTunes Podcasts and Google Podcasts. We share our thoughts on new bond issues and hold discussions on the fixed income space. Listen to our latest episode below and follow us!