


About FWD Group Limited
FWD Group Limited (“FWDG”) was established less than a decade ago when Pacific Century Group (“PCG”) acquired the Hong Kong, Macau and Thailand insurance arm of ING Groep NV in February 2013, with the FWD brand being unveiled later in August that year. FWDG is an insurer that offers a wide range of insurance products such as life and medical insurance, employee benefits and Shariah and family takaful products.
Following a series of acquisitions, the group now offers insurance services mainly in the Southeast Asia region including Indonesia, Singapore, Vietnam and Philippines. It also offers insurance products in Japan. As at 30 Jun 19, the fast-growing insurer has total assets of USD17.1 billion.
A privately held organisation, FWDG is mainly owned by Mr Richard Li (75.4% interest indirectly held via PCG) and Swiss Re Group (13.4%) (see Figure 1). Mr Richard Li, a businessman and philanthropist with a net worth of USD4.5 billion, is the younger son of Sir Li Ka-Shing. Swiss Re Group is a leading Swiss-listed reinsurer with a market cap of CHF34.9 billion as at 19 Nov 19. The two shareholders have the right to appoint up to eight and two members, respectively, of FWDG’s board of directors.
Figure 1: FWDG’s organisation chart
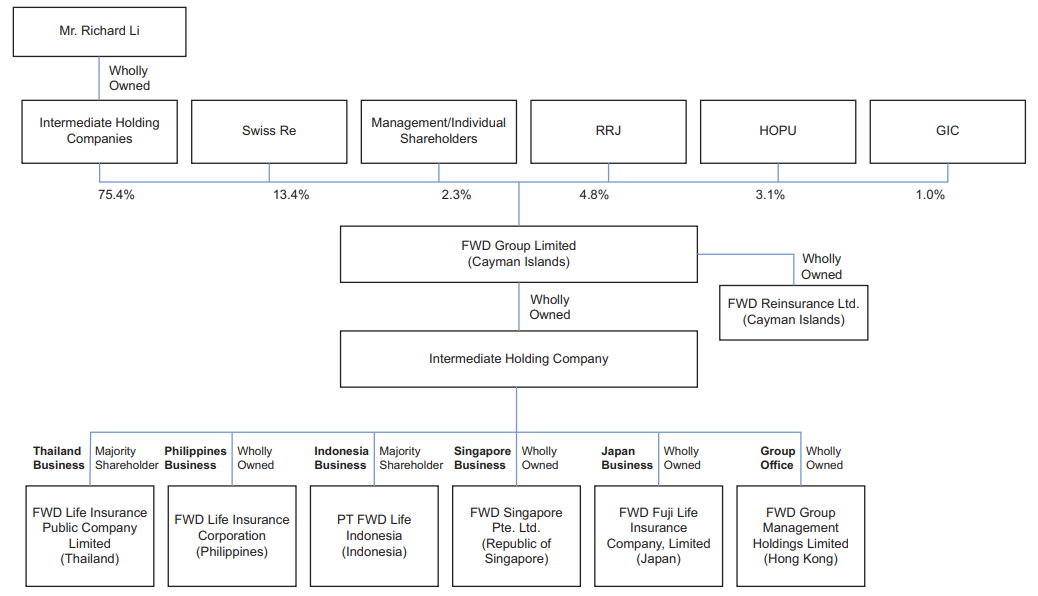
Source: preliminary offering circular dated 9 Sep 19 of the FWDGRP 6.375% Perpetual Corp (USD)
Mr Richard Li also owns a shareholding interest of 79.3% (as of 19 Jan 18) in FWD Limited (“FWDL”). Although they share common shareholders, FWDL and FWDG are separate entities operating independently. FWDL focuses on the offering of insurance products mainly in Hong Kong and Macau, while FWDG operates primarily in Southeast Asia and Japan.
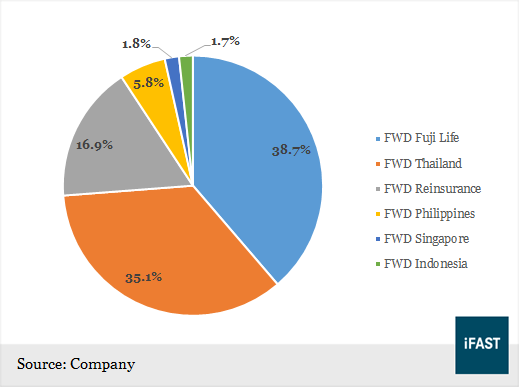
FWDG segments its business mainly by the geographical markets in which it operates, namely Thailand, Japan, Other Markets (the Philippines, Singapore, Indonesia and reinsurance operations in the Cayman Islands) and Corporate and Others. As shown in Figure 2, most of its revenue (i.e. written premiums) comes from Thailand and Japan.
Figure 2: total revenue by geographical markets
Recent corporate developments
In March 2019, FWDG completed the acquisition of a 49% stake in HSBC Amanah Takaful (Malaysia) Bhd. The acquisition not only added one more region to the group’s geographical coverage, but also brought in more than 83,000 customers and widened its product offering to include family takaful products.
In September, FWDG completed the acquisition of the entire stake in SCB Life Assurance Public Company Limited and entered into a distribution agreement to establish a long-term bancassurance partnership with Siam Commercial Bank Public Company Limited (“SCB”), under which SCB will distribute FWDG’s life insurance products to its customers in Thailand for a period of 15 years. Post-acquisition of SCB Life Assurance, FWDG is expected to be the fourth largest life insurance company in Thailand on a gross written premium basis.
We like that FWDG has continued to expand itself, which shows that the group recognises the importance of having a large operating scale. A bigger market share would strengthen the insurer’s brand identity, boost consumer confidence and enhance competitiveness.
1H19 results highlights
As a privately held entity, FWDG is subject to lower regulatory requirements for financial disclosures. Therefore, investors will have to make do with a lower level of transparency into the company’s financial health.
Nonetheless, we note that FWDG has been consistently releasing its consolidated financial statements at regular intervals (every six months), available upon request at the company’s website. These reports may not be as detailed as a conventional annual report published by public entities but are nevertheless able to offer an understanding of the group’s financial performance. Given the lack of management discussion and analysis of results, most of the explanation below about the group’s financial results are based on our own inferences and estimations.
In 1H19, FWDG’s net premiums rose 10.8% YoY to USD1.52 billion, mainly led by increases from its operations in Thailand (+22.4% YoY) and Other Markets (+25.2% YoY). Net premiums in the Japan segment weakened slightly by 3.4% to USD631.6m over the same period. Net premiums constituted 91% of total revenue in 1H19, which grew 13.1% YoY to USD1.67 billion.
Meanwhile, total net benefits and claims, and other operating and administrative expenses rose 15.9% YoY and 24.7% YoY to USD1.36 billion and USD309.0m respectively in the six months ended 30 Jun 19. Overall, FWDG’s loss before tax widened to USD116.2m in 1H19 (1H18: loss of USD28.0m), mainly because the increase in abovementioned expenses outpaced revenue growth.
FWDG’s Thailand business has been the bright spot among its operating segments. In addition to being FWDG’s second-largest contributor of net premiums, FWD Thailand has been profit making in the past few years. Although the Japan segment is the biggest revenue contributor within the group with net premiums of USD631.6m in 1H19 (41% of total net premiums), the segment incurred USD87.0m of loss before tax during the period.
FWDG’s operations in individual markets within Other Markets were much smaller than Thailand and Japan, with FWD Indonesia, Philippines and Singapore generating USD61.6m, USD145.5m and USD69.5m of gross written premiums respectively in 1H19. These three markets have been loss-making for FWDG since at least 2015.
Investment return, which measures the investment income, gains and losses and fair value changes of FWDG’s invested assets, rose 26.7% YoY to USD89.0m in 1H19. Most of the growth came from more interest and dividend income earned during the period. Net realised gain on financial assets fell 12.5% YoY to USD30.7m, while unrealised fair value change on financial assets swung to a gain of USD17.8m (1H18: loss of USD39.7m). In 1H19, the group recorded USD37.7m of fair value gains on financial assets designated at fair value through profit or loss, against losses of USD28.9m in 1H18.
We note that losses from foreign exchange difference spiked to USD72.9m in 1H19 from USD18.7m in 1H18, likely due to the weakening of Thai baht and Japanese yen against the US dollar in 1H19. We infer that most of the foreign exchange losses came from THB- and JPY-denominated investments as these two currencies made up the bulk of the group’s debt investments. In the next section, we discuss in detail about FWDG’s investment holdings.
Profitability analysis
Several useful ratios are commonly used to analyse the profitability of insurance companies. One example is the loss ratio, which is the ratio of losses incurred in claims plus the cost of settling claims over written premiums. This ratio indicates how successful an insurer is in estimating the risks insured and the premiums it charge. Another ratio is the underwriting expense ratio, defined here as underwriting expenses over written premiums, which measures the efficiency of an insurer’s operations.
The sum of the two ratios described above is often referred to as the combined ratio. Generally, a combined ratio of less than 100% is considered as an indicator of efficient management and good profitability.
As seen in Figure 3, our estimations show that FWDG recorded combined ratios above the 100% level for all segments in 1H19 and 1H18 respectively. Particularly, Other Markets had the highest level of combined ratio. Unsurprisingly, FWD Thailand, being the most profitable segment within the group, recorded the lowest level of combined ratio. All told, FWDG’s combined ratio in recent periods signalled the need to improve cost efficiency.
That said, the high level of combined ratio at this juncture is still within our expectations. As a relatively newcomer to the industry, FWDG still have much work to do to reduce costs, increase market share and strengthen competitiveness.
Figure 3: our estimates of FWDG’s underwriting ratios in 1H19
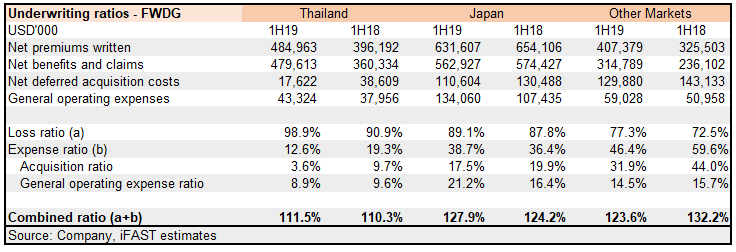
We notice that net deferred acquisition costs (“DAC”) have fallen YoY in all segments, with the Thailand segment incurring the least acquisition costs within the group. DACs are costs incurred to acquire new insurance contracts or contract renewals, and include commissions and distribution costs, and underwriting and other policy issue expenses.
Japan and Other Markets have significantly higher DACs, indicating that the two segments are experiencing high customer acquisition activity. Within Other Markets, the Philippine market likely contributed the most growth in 1H19, with a value of new business (“VNB”) and VNB margin of USD11.6m and 52.3% respectively. The total DAC on FWDG’s balance sheet stood at USD1.41 billion at the end of June, up 26.7% from six months ago, reflecting the increase in new businesses.
Healthy investment portfolio
A diversified asset allocation is desirable for insurers as investment returns are a key source of income for the sector. Good investment returns are especially important in the case of FWDG, as the company is still incurring claims and underwriting expenses that are higher than its collected premiums.
As at 30 Jun 19, FWDG has USD11.77 billion of financial assets, of which 82% (USD9.71 billion) are debt securities. As shown in Figure 4, a large part of the debt securities in FWDG’s investment portfolio comprises of government bonds and government agency bonds, which are expected to generate stable returns. During 1H19, FWDG has increased its exposure to asset classes of higher risk, as corporate bonds as a percentage of total debt securities rose from 28.8% to 35.2% over the period.
Figure 4: FWDG’s portfolio of debt securities
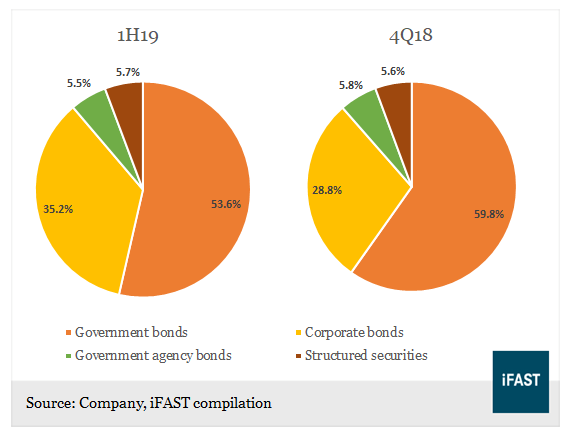
While corporate bonds tend to carry higher risk than sovereign bonds, we take comfort that most of these investments are rated investment grade. Just 11.9% of corporate bonds held by FWDG have ratings below investment grade or are unrated. This was a more conservative allocation than the 13.2% recorded in 4Q18. Overall, 4.9% of total debt securities invested were below investment grade or unrated.
FWDG seems to have adopted a relatively conservative investment approach compared to other Asia Pacific-focused insurers. As a reference, AIA Group Limited invested 53% of its total bond portfolio in corporate bonds.
Strong capital adequacy ratios
A geographically diversified insurer like FWDG will have its solvency ratio subject to local regulations, and the definition of solvency ratio and capital requirements may differ by jurisdictions. Broadly speaking, the solvency ratio is commonly used to indicate how much buffer an insurance company has to cover claims in an adverse scenario.
FWDG defined the solvency ratio as the ratio of total available capital to required capital. Total available capital is defined as the amount of assets less liabilities, while required capital is defined as the minimum required margin of solvency. Both numbers are calculated in accordance with the relevant local regulations where FWDG operates in.
Table 1 shows that FWDG has a strong set of solvency ratios, which are way above regulatory requirements. All segments have their capital adequacy ratio improved from 4Q18, except FWD Thailand. In addition, although the Thai subsidiary’s decent solvency ratio presents ample capital buffer, we note that the ratio was lower than its peers. As at 30 Jun 19, Muang Thai Life Assurance and Prudential Life Assurance (Thailand) have capital adequacy ratios of 340% and 436% respectively.
Table 1: Capital positions of FWDG’s principal subsidiaries
|
Principal Subsidiary |
Solvency ratio
|
Regulatory minimum solvency ratio |
|
|
30 Jun 19 |
31 Dec 18 |
||
|
FWD Thailand |
231% |
241% |
100% |
|
FWD Japan |
1,062% |
1,043% |
200% |
|
FWD Indonesia |
9,217% |
298% |
120% |
|
FWD Philippines |
300% |
203% |
125% |
|
FWD Singapore |
337% |
372% |
100% |
|
FWD Reinsurance |
2,353% |
2,338% |
400% |
|
Source: Company |
|||
While the Indonesia segment represents a small segment of the group, contributing just 2.4% of total gross premiums and is still loss-making, FWDG intends to continue expanding its business in Indonesia. On 23 Oct 18, the group announced that it had agreed to acquire up to 100% of PT Commonwealth Life, along with a 15-year exclusive life insurance distribution agreement with PT Commonwealth Bank. The acquisition was expected to be completed in 3Q19.
Noticeably, FWD Indonesia’s solvency ratio jumped to 9,217% in 2Q19 (4Q18: 298%), reflecting an increase in available capital to USD405.2m (4Q18: USD8.5m). The unusually high solvency ratio was due to a capital injection of IDR5.43 trillion in 2Q19 to fund the acquisition of PT Commonwealth Life. Excluding this capital injection, FWD Indonesia’s solvency ratio would have been 481%, still a very healthy level in our opinion.
FWDG’s aggressive acquisitions have started to pay off. Net cash flows generated from operating activities rose 21.8% YoY to USD713.0m 1H19, partly lifted by higher increase in insurance contract liabilities and higher dividend and interest received. Despite being still loss-making in most segments, the group has been generating positive operating cash flow consistently.
Key risks
The insurance industry typically has a high barrier to entry. New participants will have to be prepared for competition with established operators like Prudential and AIA. Newly formed brands like FWDG will see heavy customer acquisition costs and marketing expenses initially to keep up with competition.
FWDG has grown its business mainly through acquisitions of insurance units from various financial institutions. These insurance units have varied operating history, structure and presence. The group may experience difficulties in integrating the acquired units into its existing business structure. In 1H19, other operating and administrative expenses recorded in Corporate and Others (which we took as a proxy for corporate centre) amounted to 4.4% of total revenue. As a reference, the equivalent figure of AIA was just 0.6%.
Meanwhile, we also observed that FWDG’s commission and commission-related expenses were high at 20.8% of total revenue in 1H19, more than double the 10.2% of AIA. We are not surprised by the group’s high commission expenses as we think they are needed to acquire new business for a relatively newcomer like FWDG.
We believe FWDG has a higher underwriting risk and claims risk than its peers, as net benefits and claims nearly offset all of net premiums written. For example, net benefits and claims as a percentage of net premiums written were 98.9% in the Thailand segment in 1H19 (1H18: 90.9%) and 89.1% (1H18: 85.1%) at the group level. The equivalent figure of AIA Group was 83.2%.
FWDG’s rapid acquisition-fuelled growth over the span of just six years would not have been possible without the financial backing of Mr Richard Li and the key investors behind the group. Their equity injections were instrumental to the enormous yearly growth of FWDG.
While we acknowledge that aggressive acquisitions may increase operational risks and expected benefits of acquisitions could take significant time to materialise, the substantial amount of equity capital already invested in the firm supports our belief that the likelihood of shareholder support in times of need is high. As at 30 Jun 19, FWDG booked USD1.82 billion of share premium, accounting for 85.4% of its total equity. At this juncture, we consider the likelihood of financial support from shareholders as a key element of our credit opinion.
All of FWDG’s outstanding bonds come with a change-of-control provision (“CoC”), which is triggered when Mr Richard Li or any of his affiliates ceases to control the issuer. The CoC clause provides an option for the issuer to redeem the notes when it is triggered. If the bonds are not redeemed upon the occurrence of a CoC event, their coupon rate would increase by 500 basis points.
Bond recommendations
We like the FWDGRP 5.75% ’24s
FWDG’s numerous acquisitions were also partly funded by debt. The FWDG curve is made up of the USD900m FWDGRP 5.750% 09Jul2024 Corp (USD), the USD600mFWDGRP 6.375% Perpetual Corp (USD) and two zero-coupon perpetual bonds totalling USD1.06 billion.
Despite its decent set of capital ratios and rapid growth, FWDG’s profitability is still weak as the group is still in the early phase of building its business. As such, we believe the FWDG bonds at their current prices are reflecting the risks associated with FWDG’s relatively short operating history. As shown in Figure 5, the FWDGRP 5.75% ‘24s carry substantially higher yields above other insurer credits.
Figure 5: relative valuation (straight bonds)
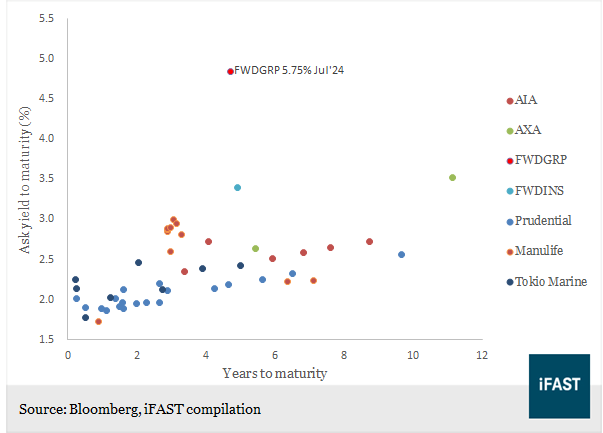
The FWDGRP 5.75% ’24s have an ask yield to maturity (“YTM”) of 4.84%, representing 334bps above five-year US Treasury yields and 144bps more than the YTM of FWDL’s similar-dated FWDINS 5.000% 24Sep2024 Corp (USD) (ask YTM: 3.40%). To reiterate, FWDL has a very similar business as FWDG in the provision of life insurance products, except that FWDL primarily focuses on Hong Kong and Macau, while FWDG mainly operates in the Southeast Asia region. The sister companies are both substantially owned by Mr Richard Li.
FWDL is rated BBB+ and Baa3 by Fitch and Moody’s respectively, while the FWDINS 5% ’24s are rated BBB by Fitch. Both Fitch and Moody’s have raised concerns over the company’s credit outlook, citing uncertainties surrounding the acquisition of MetLife Hong Kong, particularly on the funding package (which was not disclosed) and potential impact on the company’s leverage.
In comparison, FWDG is unrated but likewise is in the midst of a major acquisition—the purchase of SCB Life Assurance mentioned earlier. The acquisition, which was recently completed in September, cost a whopping THB92.7 billion (~USD3 billion).
Given the similarities between FWDG and FWDL, we think FWDG’s 5.75% 2024 notes are undervalued and offer a generous yield pickup of 144bps against the FWDINS 5% ’24s.
The FWDGRP 6.375% perp is a rewarding choice for high-yield seekers
At its ask YTW of 5.97% (Z-spread: 438bps), we think the FWDGRP 6.375% perp also offers lucrative reward for its subordinated ranking relative to the FWDGRP 5.75% ’24s. The perps are first callable on 13 Sep 24. If not redeemed at first call, the coupon rate on the perps will reset to the sum of the prevailing 5-year US Treasury yield plus the initial spread of 4.876%.
The hefty initial spread as compared to the current spread suggests a decent likelihood of the perps being redeemed at first call. Nonetheless, we note that FWDG is facing significant debt maturities in 2024, as the USD900m FWDGRP 5.75% ’24s will mature about two months before the perps are first callable.
Like FWDG’s straight bond, the FWDGRP 6.375% perp is also one of the highest-yielding USD perp in the insurance sector. As shown in Table 2, the FWDGRP 6.375% perp with its ask YTW of 5.97% offers a decent yield pickup relative to its peers. For instance, a switch from the FWDINS 5.5% perp to the FWDGRP 6.375% perp will offer 77bps pickup, which is appealing in our view for the latter’s 1.5-year longer tenor (assuming redemption at first call).
Table 2: relative valuation (perpetual bonds)
|
Issuer ticker |
Coupon rate (%) |
Next call date |
Next coupon reset date |
Ask YTW (%) |
Ask YTC (%) |
Ask YTM (%) |
Z-spread (bps) |
Bond rating (Moody’s/S&P/Fitch) |
|
MET |
5.250 |
15-Jun-20 |
15-Jun-20 |
2.71 |
2.71 |
5.43 |
113 |
Baa2/BBB/BBB |
|
PRUFIN |
5.250 |
20-Jul-21 |
N.A. |
4.18 |
4.18 |
5.16 |
262 |
A3/BBB+/BBB |
|
PRUFIN |
4.375 |
20-Oct-21 |
N.A. |
4.42 |
4.95 |
4.42 |
271 |
A3/BBB+/BBB |
|
FWDINS |
6.250 |
24-Jan-22 |
24-Jan-22 |
4.65 |
4.65 |
5.87 |
309 |
Ba2/N.A./BB+ |
|
ALVGR |
3.875 |
3-Mar-22 |
N.A. |
4.09 |
6.31 |
4.09 |
235 |
A2/A+/Au |
|
AXASA |
4.500 |
15-Mar-22 |
N.A. |
4.51 |
4.64 |
4.51 |
278 |
A3/BBB+/BBB |
|
PRUFIN |
4.875 |
20-Jan-23 |
N.A. |
4.39 |
4.39 |
4.81 |
283 |
A3/BBB+/BBB |
|
FWDINS |
5.500 |
1-Feb-23 |
1-Feb-23 |
6.74 |
6.74 |
5.00 |
353 |
Ba2/N.A./BB+ |
|
FWDGRP |
6.375 |
13-Sep-24 |
13-Sep-24 |
5.97 |
5.97 |
6.36 |
438 |
N.A/N.A/N.A |
|
Source: Bloomberg, iFAST compilations; pricing data as of 20 Nov 19 |
||||||||
Only for the most aggressive investor: the FWDG zero-coupon perps
FWDG also has two zero-coupon subordinated perpetual bonds with issue sizes of USD750m and USD314m respectively, as summarised in Table 3. The former is first callable on 15 Jun 22. If not redeemed on first call, the perp will start accruing interest at the distribution rate of the sum of the prevailing 5-year US Treasury rate and the initial spread of 4.865%. The latter is first callable on 16 Nov 22, and a coupon rate of the prevailing 5-year US Treasury rate plus the initial spread of 4.492% will be applicable starting from the first-call date.
Table 3: FWDG’s zero-coupon perpetual bonds
|
ISIN |
Issue size |
First call/reset date |
Reset rate |
Ask price |
Ask YTC (%) |
Ask YTW (%) |
Z-spread to call (bps) |
|
XS1628340538 |
USD750m |
15-Jun-22 |
5Y UST + 4.865% |
82.45 |
7.67 |
6.78 |
610 |
|
XS1716777344 |
USD314m |
16-Nov-22 |
5Y UST + 4.492% |
79.22 |
7.96 |
6.52 |
640 |
|
Source: Bloomberg, iFAST compilations; pricing data as of 20 Nov 19 |
|||||||
The high spreads (to call) on the two zero-coupon perps (“ZCP”) as compared to the initial spreads seem to suggest a high non-call risk. Nonetheless, we think current prices are more reflective of relative valuation versus the FWDGRP 6.375% perp (which was issued two years after the ZCPs) than market expectation of a non-call—the ZCPs should reasonably be priced at a discount vis-à-vis the 6.375% perp due to their higher risk.
Besides extension risk, given their lack of interest payments (at least until six months after the first call date), the ZCPs carry a much higher interest rate risk than a fixed-rate bond. As their name implies, zero-coupon bonds are simply bonds that do not pay interest. They are issued at a deeply discounted price and redeemed at its face value upon maturity (or on their callable dates in the case of zero-coupon perpetual bonds). Zero-coupon bonds are highly sensitive to changes in interest rates, as bondholders only get their pay-out on the redemption date. In a rising interest rate environment, zero coupon bonds tend to suffer huge price declines.
For specific disclosure, at the time of publication of this report, IFPL (via its connected and associated entities) and the analyst who produced this report hold a NIL position in the abovementioned securities.









