- UBS’s higher revenues in 3Q23 were more than offset by higher operating costs, leading to negative operating profits before tax on a reported basis.
- However, on an underlying basis excluding the effects of integration and other expenses, we find that operating profits before tax actually remained positive.
- Looking ahead, we see UBS’s profitability to be mainly driven by cost savings and synergies rather than strong revenue growth, as UBS seeks to stabilise the ship post-acquisition.
- UBS’s credit profile remains resilient with ratios like CET1 having a solid buffer above regulatory minimums.
- We recommend UBS 5.125% 15May2024 Corp (USD) and UBS 4.125% 24Sep2025 Corp (USD) within the USD space, as well as UBS 2.750% 08Aug2025 Corp (GBP) and UBS 7.000% 30Sep2027 Corp (GBP) within the GBP space.
About UBS
Earlier this year, the Swiss government brokered a deal where UBS Group AG (UBS) would purchase Credit Suisse Group AG (Credit Suisse, or CS) for a total consideration of CHF 3b. For our initial reaction to this deal, please see our article “UBS – will merger with Credit Suisse affect its AT1 bonds?”.
UBS recently announced its results for the third quarter ending on 30 September 2023 (3Q23), with its first full quarter of post-acquisition results since the deal was completed in June. We take a closer look at its results and provide recommendations on UBS bonds.
Financial highlights
UBS saw higher revenues of $11.7b in 3Q23 (all dollar figures in USD unless otherwise stated). This marked a sharp increase from the previous quarter’s $9.5b (+23% QoQ) and 3Q22’s $8.2b (+42% YoY). On a YoY basis, a large part of the increase was due to the consolidation of CS revenues of $3.47b. On a QoQ basis (using UBS’s new reporting format), the Group also saw revenue growth across its core segments, especially for the Wealth Management and Personal & Corporate Banking segments, which benefited from higher net interest income (Chart 1).
Operating expenses also saw a large increase post-CS acquisition (Chart 2), rising +97% YoY and +37% QoQ to $11.6b in 3Q23 (3Q22: $5.9b / 2Q23: $8.5b). A bulk of these costs arose from the CS acquisition. On a YoY basis, personnel expenses rose by about $3.4b (+80%), of which $2.9b was attributed to a result of a consolidation of CS expenses. As a whole, on a QoQ basis, operating expenses for the quarter also included about $2.1b of integration and other expenses (deemed to be temporary or one-time for the quarter). However, excluding this $2.1b, UBS estimates that underlying operating expenses actually fell by -5% to $9.6b instead. (Note: Underlying refers to those deemed temporary or one-time for the quarter, among other factors.)
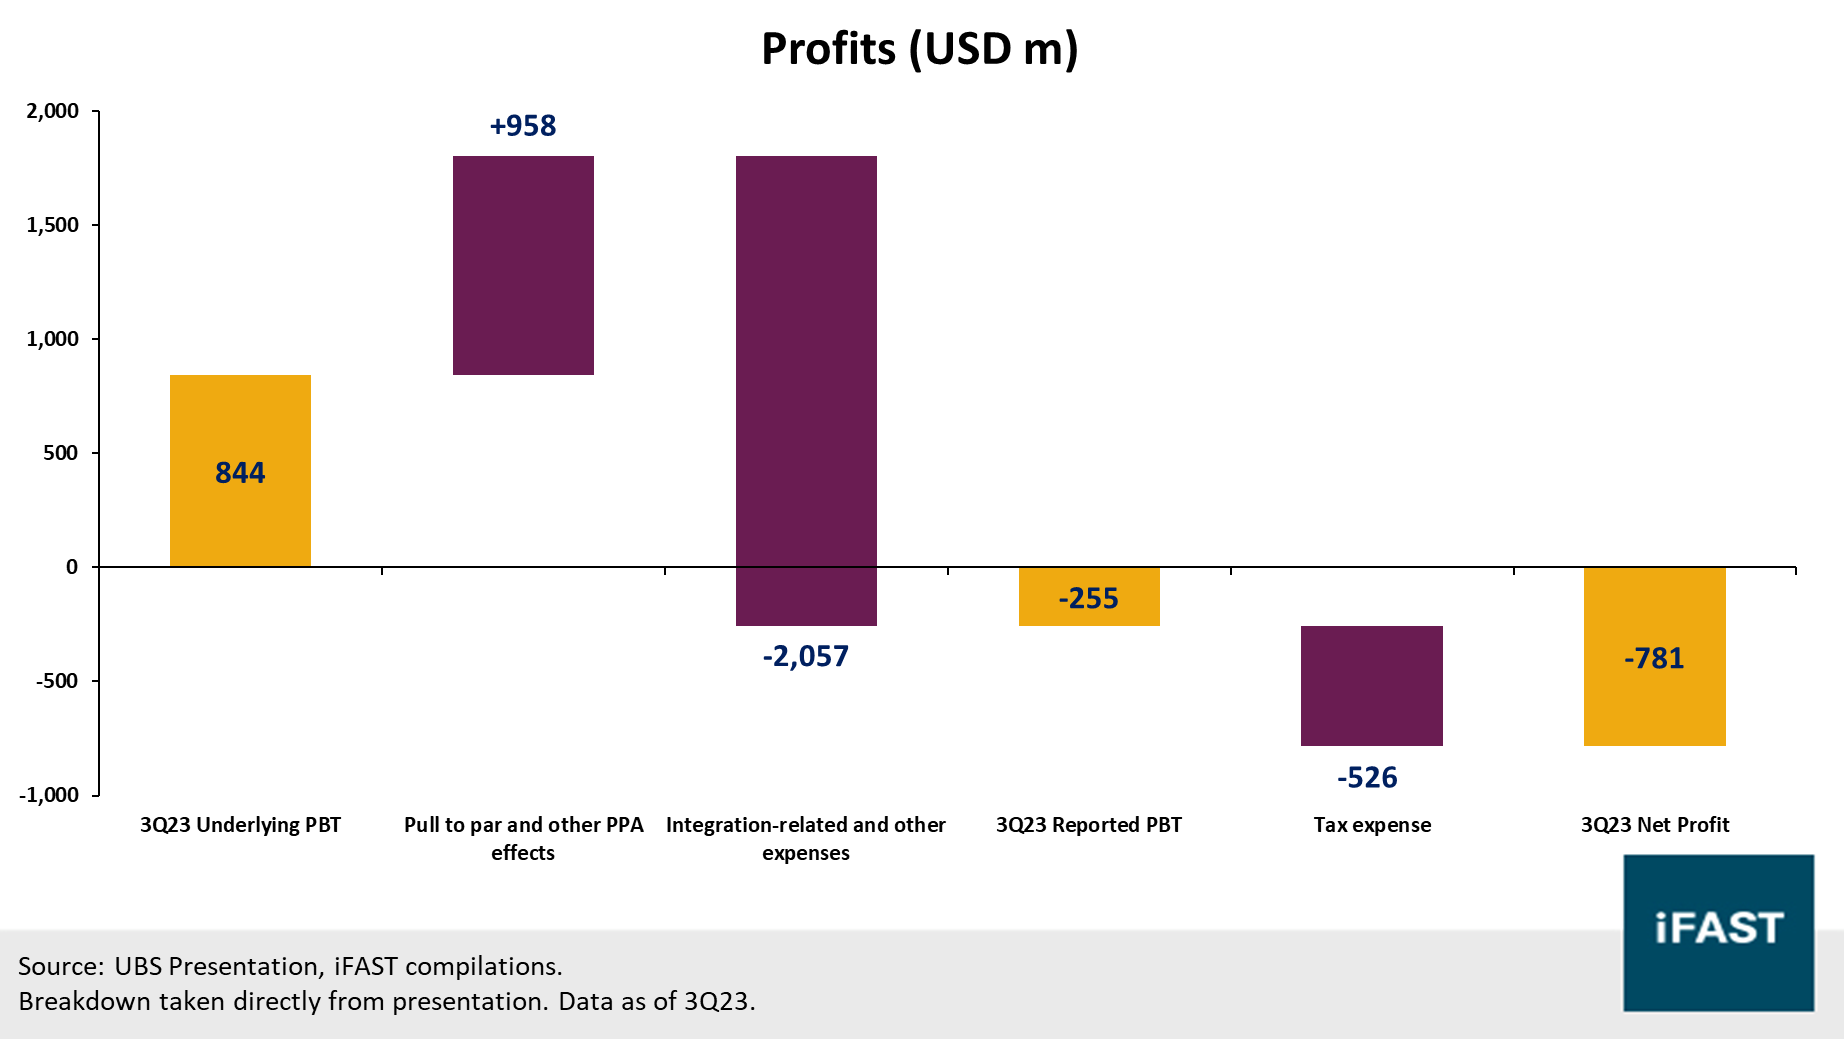
With operating expenses rising quicker than revenues, UBS delivered operating losses before tax on a reported basis, but positive operating profits before tax (PBT) on an underlying basis. Underlying PBT benefited from higher revenues and lower underlying operating expenses, though the $2.1b of integration and other expenses (mentioned above) ultimately contributed to negative reported PBT. As a whole, UBS reported a 3Q23 PBT of -$0.3b, and a 3Q23 net loss of -$0.8b (Chart 3).
Chart 1: Solid revenue growth across most core segments
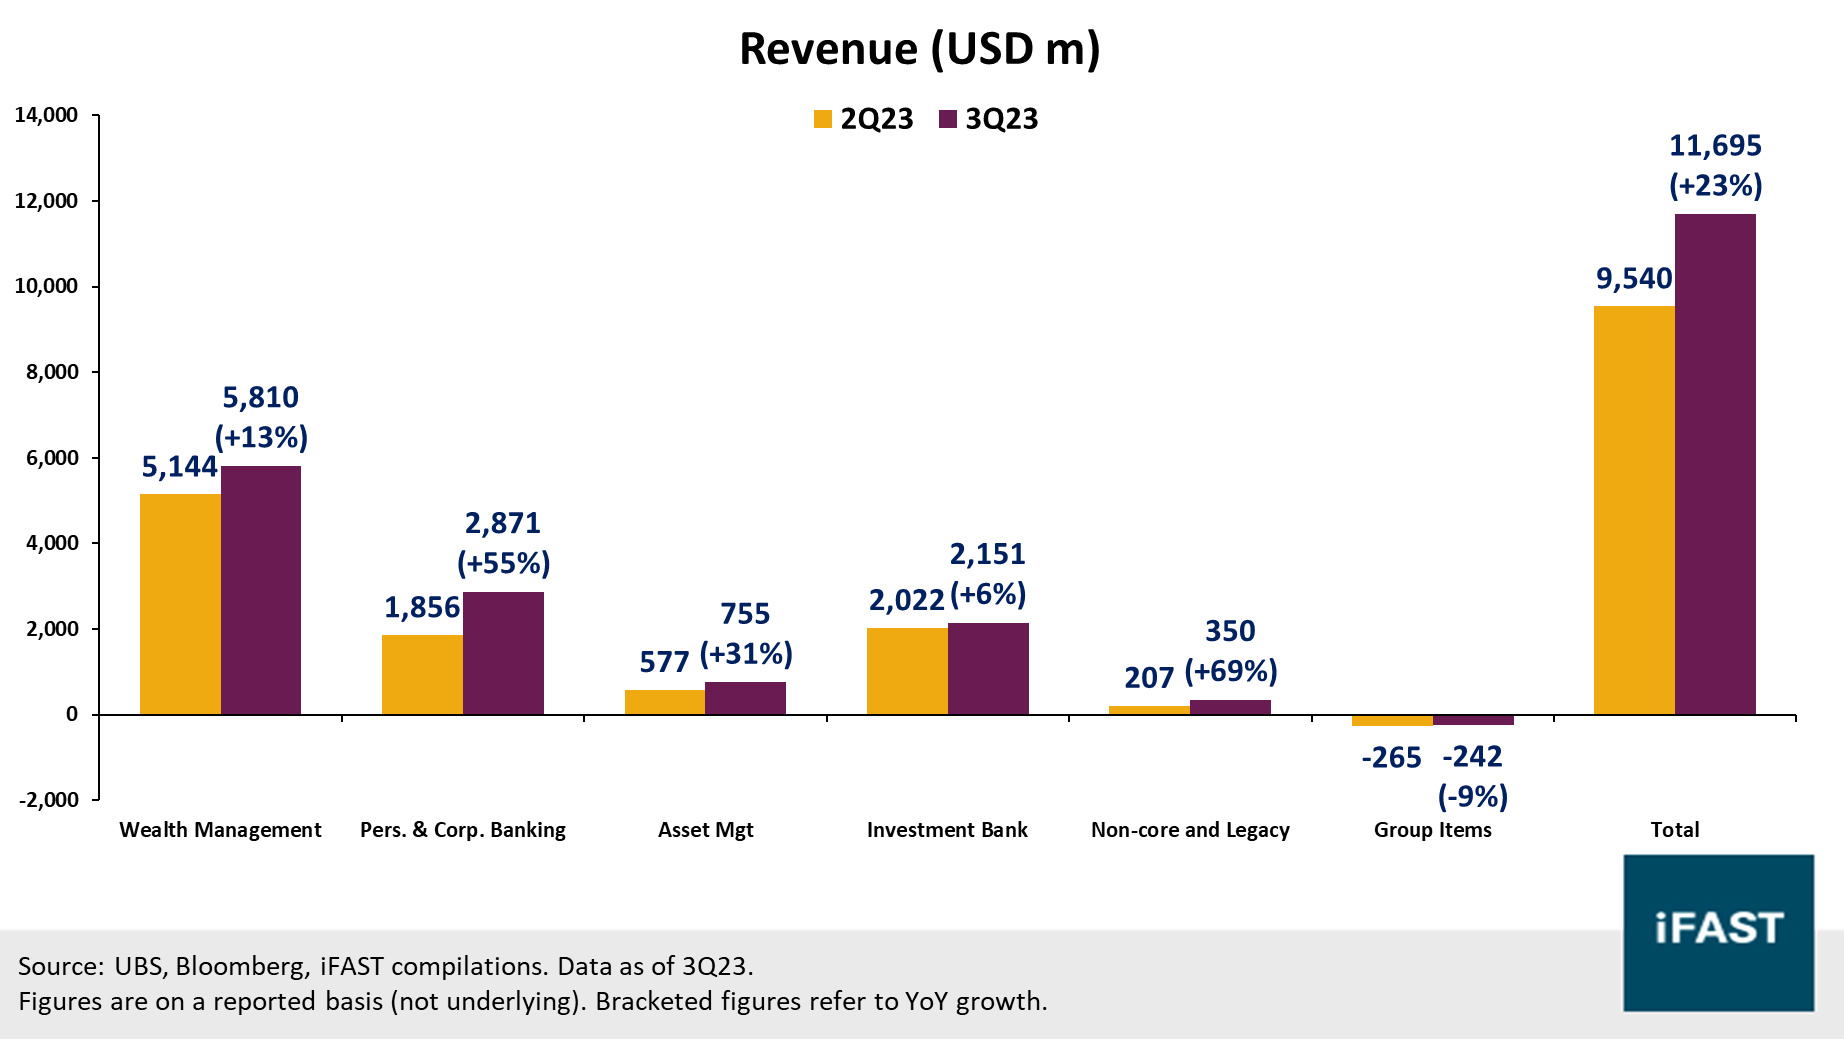
Chart 2: Operating expenses rose significantly after CS acquisition
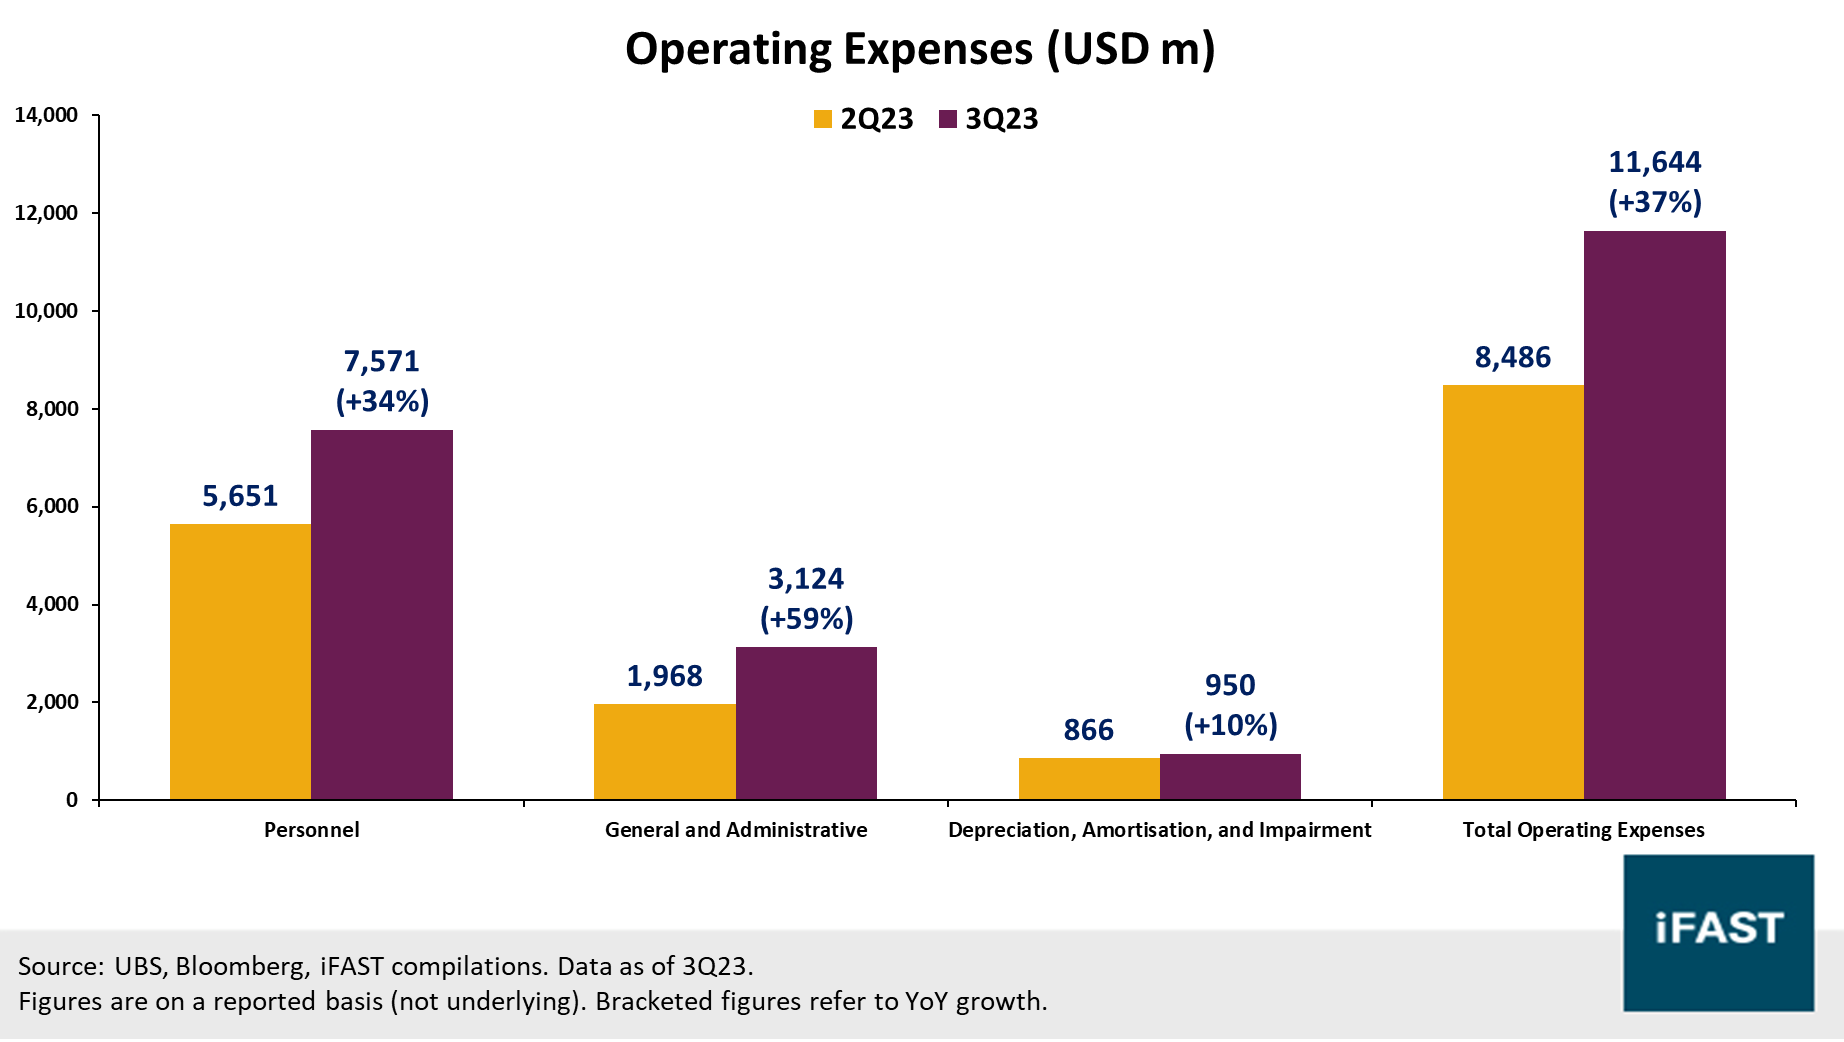
Chart 3: Underlying profits remained positive, but integration expenses were a key drag
Outlook
We expect revenue growth to remain in a modest single-digit range over the next few years. The recent double-digit revenue growth in 3Q23 (see above) was mainly boosted by contributions from CS, but we do not expect similarly large acquisitions anytime in the near to medium term. Management has guided that $50b would be a ‘blue-sky’ scenario for 2026 revenues at best - for comparison, UBS’s current revenues are already close to the $40b region. (Note: 3Q23 underlying revenues of $10.7b and 9M23 revenues of $28.6b translate to full-year run rates of $42.9b and $38.2b respectively.)
We expect improvement in profits to come from cost reductions and synergies (rather than revenue). Management has disclosed that they have already achieved about $3b (annualised) in the YTD from cost-savings initiatives, hitting their target one quarter ahead of schedule, while we also saw above that underlying operating expenses also declined in 3Q23 itself. Looking ahead to end-2026, they aim to achieve gross cost reductions of over $10b (compared to pre-acquisition UBS and CS combined in 2022).
However, we acknowledge some uncertainty on the extent of cost savings arising from the ongoing UBS-CS restructuring. UBS has highlighted that legal consolidation and restructuring will be key targets in 2023 and 2024, while some other key priorities and milestones include client migrations as well. These will come with execution risks, and may even result in higher costs in the near term before the eventual synergies can be realised in the longer term.
Overall, we think the outlook for UBS remains decent, but caution on the execution risks involved in the ongoing UBS-CS consolidation in the near term. UBS is likely focused on stabilising the ship for now (rather than rapidly expanding), but if they manage to pull it off without losing revenue, their cost savings should translate to greater profitability over the longer term.
Credit highlights
UBS reported a CET1 ratio of 14.38%, in line with its medium-term target of ‘about 14%’ throughout the CS integration timeline. This ratio was similar to that in the previous quarter (14.4%). Its current CET1 ratio is well above the minimum regulatory requirement of 10.6%. We note that UBS was recently moved up a GSIB bucket (as it is a bigger bank following the CS acquisition), resulting in an additional capital buffer requirement of 1.5% (50 bps higher than the existing 1%), to take effect from 2025. Overall, we like that UBS retains a healthy CET1 buffer.
UBS’s AT1 capital remained fairly steady, falling by just $0.07b due to interest rate hedges and FX translation, among other factors. As such, its going-concern capital ratio (i.e. including AT1s) remained stable at 16.8% (2Q23: 16.8%), with a decent buffer over the regulatory requirement of 14.9%. Similarly, UBS’s total loss-absorbing capacity (TLAC) also remained fairly steady at $194.9b in 3Q23 (2Q23: $196.0b), giving it a TLAC ratio of 35.7%, above that in the previous quarter (2Q23: 35.2%) and the regulatory requirement of 25.6%.
Looking ahead, UBS has guided that regulatory-driven updates to its credit risk models are expected to result in about a $2b increase in RWA in 4Q23. On the other hand, they also expect a $2b decrease in RWA from its non-core and legacy portfolio. Overall, we think these changes do not have a significant effect on UBS’s credit outlook, considering their magnitude relative to UBS’s current RWA of $547b.
Recommendations
UBS has several bonds outstanding, including a senior unsecured bond originally issued by Credit Suisse, as well as several AT1 perpetuals. We provide some recommendations (Table 1 – bolded) for USD and GBP bonds, with a preference for shorter-maturity bonds in general given the higher-for-longer rates outlook.
Within the USD space, we prefer UBS 5.125% 15May2024 Corp (USD) and UBS 4.125% 24Sep2025 Corp (USD).
- The 2024s have the highest yield of the USD bonds in the table, but this comes with the downsides of (i) a very short maturity, meaning investors will have to reinvest their monies in less than 6 months; and (ii) lower seniority, as it is subordinated compared to the other USD bonds which are senior unsecured.
- The 2025s have a yield of 5.48%; while these have a lower yield compared to the 2028s, they also come with significantly less maturity and duration risks. Their spreads of about 135 bps are also only slightly lower than the CS 7.500% bonds’ 146 bps.
Within the GBP space, we prefer UBS 2.750% 08Aug2025 Corp (GBP) and UBS 7.000% 30Sep2027 Corp (GBP).
- The 2025s have a yield of about 5.64%, lower than those of the 2027s and 2028s. They also have relatively tight spreads (102 bps) compared to the other two bonds (between 165 and 170 bps). As such, we see the 2025s as an option for investors who are cautious about adding too much duration risks.
- The 2027s are a suitable option for investors who are willing to take on slightly more duration, as they mature in under 4 years with an optional call (issuer call) 1 year before that. These come with a decent yield pickup, with a yield-to-call of 6.08% and yield-to-maturity of 6.75%.
Table 1: List of UBS (and CS) bonds (recommendations bolded)
| Bond Name | Call / Maturity Date (Years to Call / Maturity) |
Ask Price | Yield to Call / Maturity (%) |
| UBS 5.125% 15May2024 Corp (USD) |
15 May 2024 (0.4) |
98.990 | 7.45% |
| UBS 4.125% 24Sep2025 Corp (USD) |
24 Sep 2025 (1.8) |
97.386 | 5.80% |
| CS 7.500% 15Feb2028 Corp (USD) |
15 Feb 2028 (4.2) |
108.017 | 5.37% |
| UBS 4.253% 23Mar2028 Corp (USD) |
23 Mar 2028 (4.3) |
94.844 | 6.03% / 5.64% |
| UBS 2.750% 08Aug2025 Corp (GBP) |
08 Aug 2025 (1.7) |
95.316 | 5.76% |
| UBS 7.000% 30Sep2027 Corp (GBP) |
30 Sep 2027 (3.8) |
102.252 | 6.08% / 6.75% |
| UBS 2.250% 09Jun2028 Corp (GBP) |
09 Jun 2028 (4.5) |
88.520 | 5.96% / 6.19% |
| UBS 6.875% Perpetual Corp (USD) |
07 Aug 2165 (141.8) |
96.810 | 8.96% |
| UBS 4.375% Perpetual Corp (AUD) |
27 Aug 2165 (141.8) |
96.007 | 10.81% |
| UBS 4.850% Perpetual Corp (SGD) |
04 Sep 2165 (141.8) |
99.807 | 5.66% |
| Source: Bloomberg, Bondsupermart, iFAST compilations. Data as of 03 Dec 2023. | |||
Our podcast series, Yield Hunters, is available on Spotify, iTunes Podcasts and Google Podcasts. We share our thoughts on new bond issues and hold discussions on the fixed income space. Listen to our latest episode below and follow us!