


Coty Inc. (Coty) is one of the world’s largest beauty brands, with a strong portfolio across prestige and mass-market brands, covering fragrances, colour cosmetics, and skincare products.
In this article, we review Coty’s latest FY25 (ended 30 Jun 2025) and 1Q26 (ended 30 Sep 2025) results and share our views on selected Coty bonds. We believe Coty’s bonds are best suited for investors looking to lock in 5+% yields (USD) without taking too much maturity and duration risks!
About Coty Inc.
(Unless otherwise stated, all figures are in USD terms. Results refer to FY25 or 1Q26 depending on data availability, and growth rates are year-on-year [YoY])
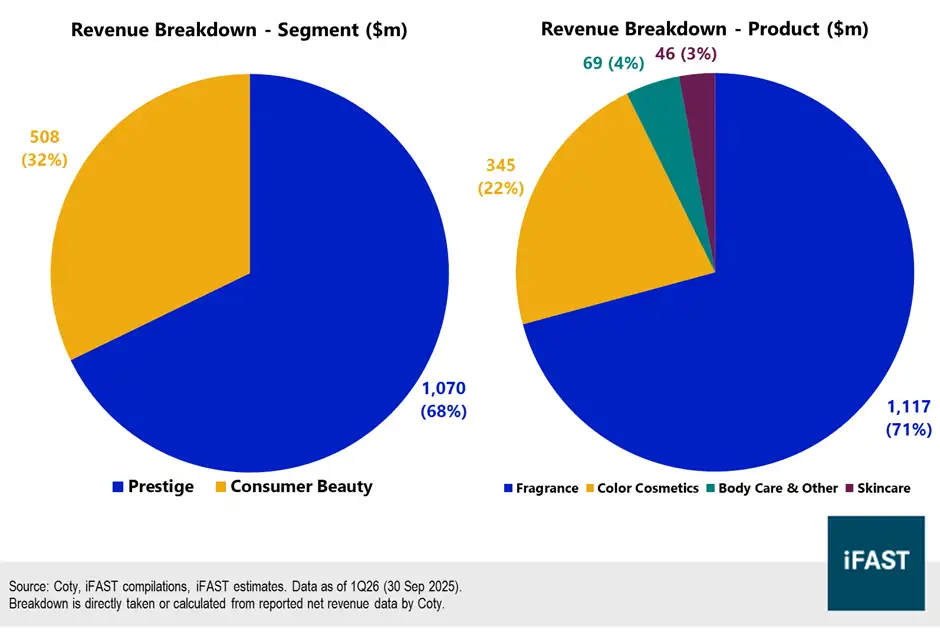
Coty operates two main business segments: ‘Consumer Beauty’ (mass-market cosmetics) and ‘Prestige’ (primarily fragrances). Prestige is its core driver, contributing 68% of 1Q26 net revenues, underpinned by Coty’s entrenched market position as the third-largest global player in prestige fragrances (Chart 1). By product category, Coty is a leader in fragrances across both mass-market and prestige segments, complemented by a meaningful exposure to colour cosmetics (Chart 2).
Coty’s portfolio comprises 17 Consumer Beauty and 17 Prestige brands. It owns 17 brands outright, while the remainder are operated under licensing agreements. Owned brands include Max Factor and CoverGirl (Consumer Beauty), and Lancaster (Prestige); licensed brands include David Beckham (Consumer Beauty) and Calvin Klein (Prestige).
Management disclosed that these license agreements are mostly long-dated in nature, providing good visibility and stability to Coty’s revenues. These agreements have an average duration of about 24 years, with 48% either owned or under ‘effectively perpetual’ licenses, and another 37% under agreements with 7 – 25 years remaining.
Chart 1: Coty has a leading position in prestige fragrances
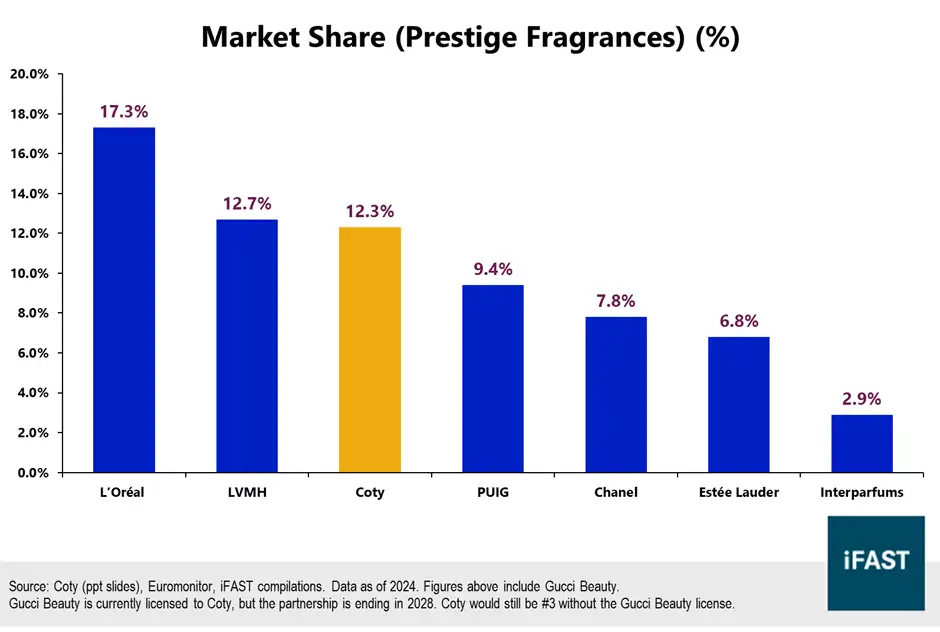
Chart 2: Coty has exposures to different market segments within the beauty industry
Top-line performance weighed down by industry headwinds
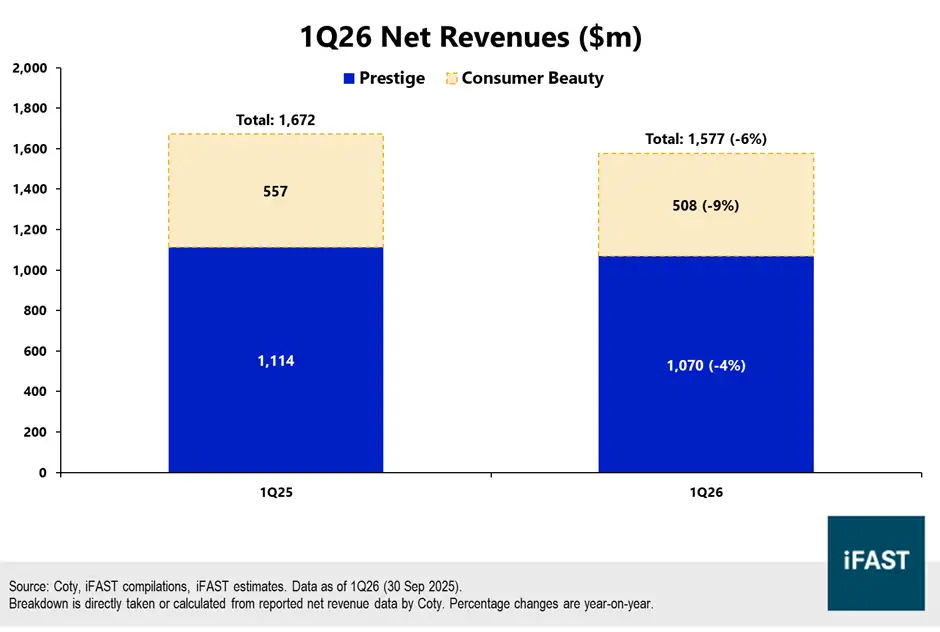
Coty reported softer revenues in 1Q26, with net revenues declining -6% to $1,577m, extending the -4% YoY drop in FY25 (to $5,892m). Revenues fell in both Prestige and Consumer Beauty segments, with Prestige holding up better (-4%) than Consumer Beauty (-9%) (Chart 3).
Challenging market and industry conditions were a key drag on Coty’s performance. Management estimates the global prestige fragrances market expanded only at a mid-single-digit pace in recent quarters, while the mass cosmetics market was weaker and may have contracted slightly.
Coty also faced some company-specific headwinds. Revenue growth has trailed industry averages, particularly in its Consumer Beauty portfolio. Inventory destocking by retailers likely weighed on its broad 1Q26 performance too. As retailers work to destock inventory levels, they would temporarily lower their order volumes, translating into softer reported sales for Coty.
Chart 3: Revenues fell in 1Q26, with Prestige holding up better (relatively)
Lower costs helped to mitigate the hit on profitability, with tariff impact as expected
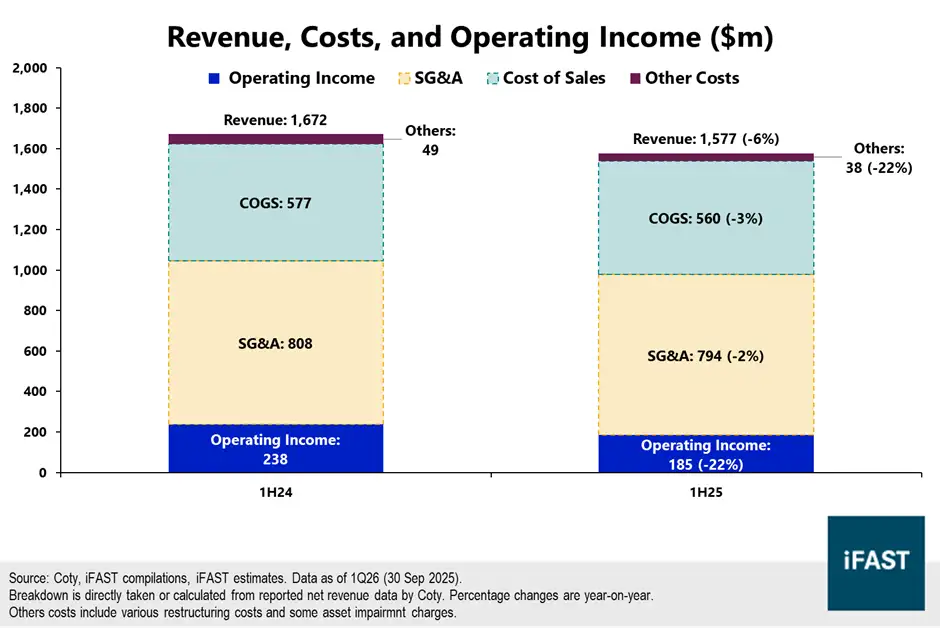
Lower costs for Coty helped to partially offset weaker revenues in 1Q26. Cost of sales dropped by -3% to $560m, while selling, general & administrative expenses (SG&A) dipped modestly too (-2%).
Tariffs were an additional headwind, with $5m of net tariff costs incurred in 1Q26. Management is also guiding for $30m of tariff costs in FY26, followed by another $5m in 1Q27. Encouragingly, this appears lower than the previous guidance of $50m - $55m. This reflects a less severe tariff outcome than initially expected, possibly due to more recent developments from the Trump administration.
Overall, Coty’s profitability moderated in 1Q26 mainly due to weaker revenues. Operating income fell by -22% to $185m (Chart 4) with operating margins contracting to 11.7% (1Q25: 14.2%). Net income was down -18% to $68m with net margins also lower YoY.
Chart 4: Operating income fell by -22%, mainly from the dip in revenues
Prestige continues to be Coty’s better-performing sector
Between Prestige and Consumer Beauty, Coty’s Prestige segment appears to be the stronger division of the two. Prestige is Coty’s main profit engine (Chart 5): in 1Q26, it delivered $209m in operating income, compared to operating losses of -$8m in Consumer Beauty, and -$16m under ‘Corporate’.
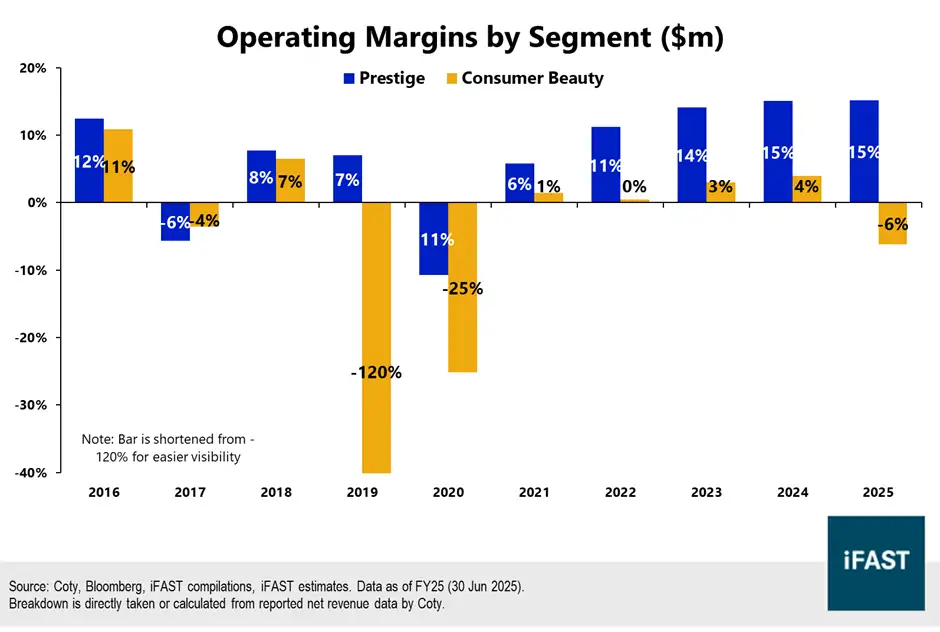
This continues a longer-term trend, where Prestige has consistently been the stronger segment. Prestige has consistently grown faster, enabling it to take up a larger proportion of Coty’s revenues (Chart 6) and operating profits over time. Furthermore, Prestige’s margins have grown over the longer term and stabilised in recent years despite market headwinds (Chart 7).
Looking ahead, we think the growing importance of Prestige will be a positive for Coty. The segment continues to show better growth across the industry, while Coty itself already has a track record of execution in this space. We think the Prestige segment will not only lift its performance in the coming years but also add stability to Coty’s profitability and margins.
Chart 5: Prestige is Coty’s main profit engine today (vs Consumer Beauty)
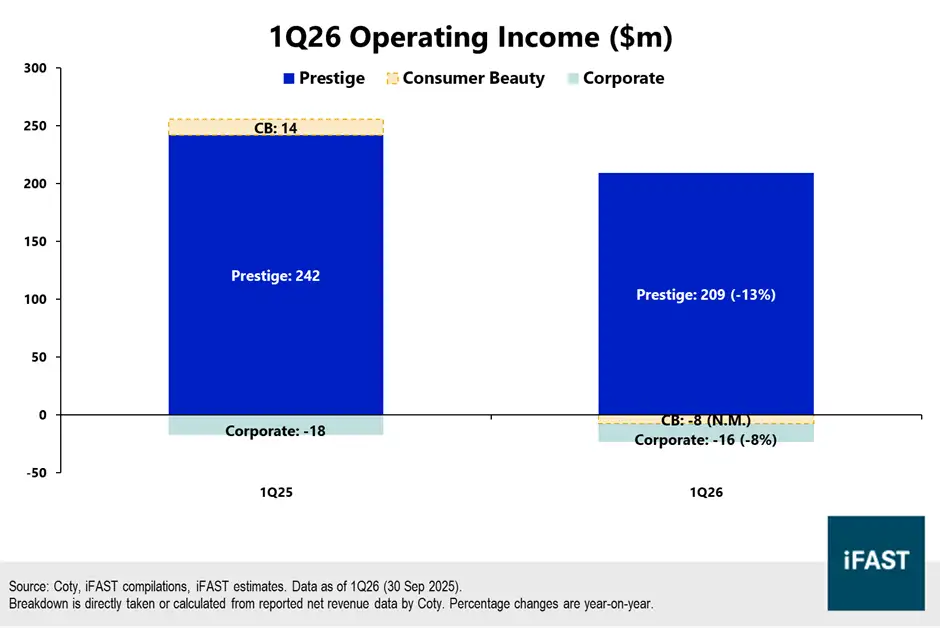
Chart 6: Prestige has a growing importance in Coty’s brand portfolio
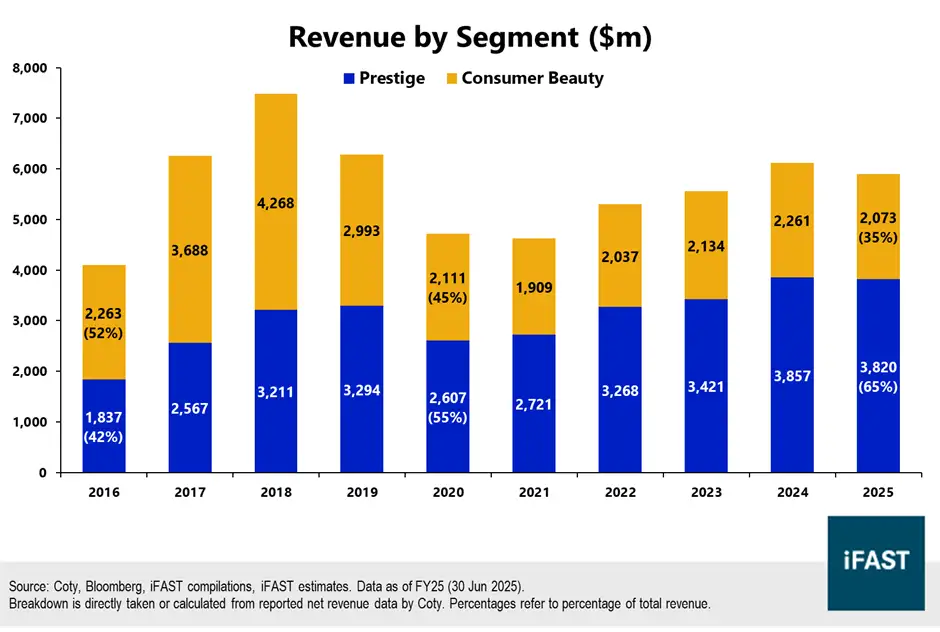
Chart 7: Prestige’s margins have held up much better than Consumer Beauty, and grown over the long term
Profit outlook: Expect a gradual recovery amidst multiple headwinds
Management expects Coty’s performance to remain resilient despite market headwinds, with a weaker 1H26 followed by a stronger 2H26, for both revenue and EBITDA. 1Q26 results so far appear broadly consistent with this forecast, while the 40 bps (negative) impact on gross margins in 1Q26 also appears in line with FY26 guidance.
i) Positive drivers for Coty …
Potential drivers of a 2H26 recovery include: (i) tariff mitigation measures kicking in; (ii) some major brand launches (exact details not disclosed by management); (iii) better base effects versus 2H25; and (iv) right-sizing of inventory levels over the fiscal year. While it is difficult to pinpoint the exact timing of these factors, we think they should broadly support Coty’s performance over the medium term.
There could also be further mild upside in Coty’s revenues and earnings in FY26 and FY27. A newly-announced ‘strategic review’ and ‘performance improvement plan’ for its weaker Consumer Beauty Cosmetics business could improve its operational efficiency or lead to portfolio rationalisation. Management has also stated they are seeing gradual improvements in ‘underlying business trends’, which could bode well for Coty and the wider industry.
ii) … with one key negative headline from its Gucci license
Looking even further out, we acknowledge recent news that Coty would be losing its Gucci Beauty license when it expires in 2028. This could represent a hit of $500m of sales per year (no single brand accounts for >10% of total sales), and is also expected to negatively impact Coty’s profits, considering the Prestige segment has been the key driver of margins and profits as highlighted previously.
(Note: Operating margin for Prestige was about 19.5% in 1Q26 and 21.7% in 1Q25. Extrapolating this to $500m of sales would result in about a $200m impact on operating income.)
Coty has expressed optimism that it can ‘overdrive’ its remaining core brands to mitigate this negative impact. We maintain a wait-and-see approach for now, with a preference for shorter-tenor Coty bonds closer to the 2028 license expiry, until more clarity emerges on Coty’s mitigating actions.
iii) Navigating challenges with resilience
We expect Coty’s performance to remain resilient over the next few years. This should last at least until the loss of its Gucci Beauty license in 2028, following which its outlook becomes more uncertain – in any case, bondholders would likely already benefit from Coty’s near-term resilience.
Coty’s management and ownership have clearly acknowledged the challenges facing the company and industry and are actively taking steps to improve their branding strategy moving forward. We think such a shakeup could present itself as an opportunity for Coty to improve on its business performance over the medium term.
Interest coverage remains decent despite falling cashflows in 1H26
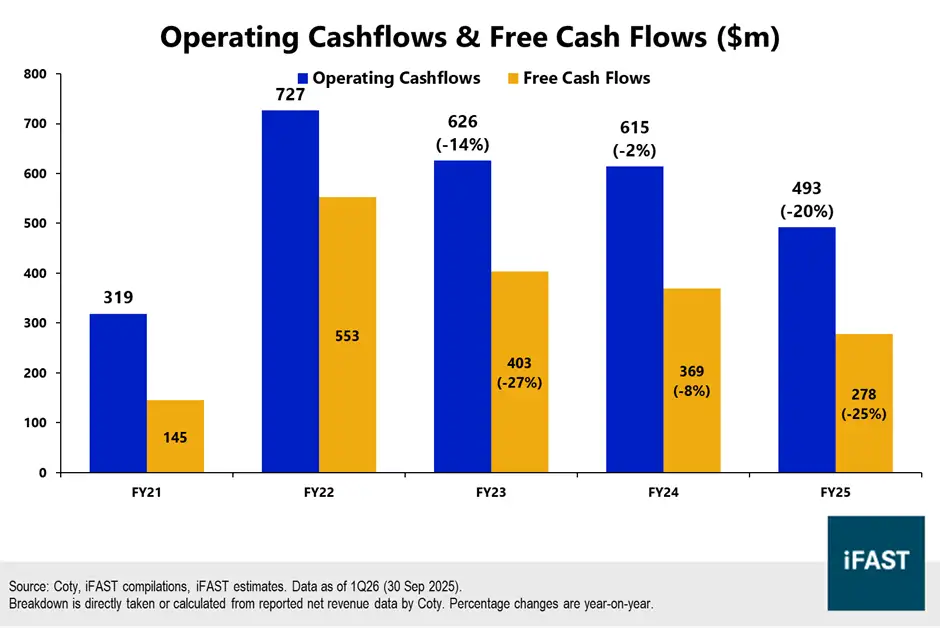
Despite weaker earnings, Coty continues to generate positive and resilient cashflows, which remain consistently in the green (Chart 8). Operating cashflows and free-cash-flow dipped by similar amounts (with stable capex) but remain at decent levels.
These cashflows remain sufficient to cover Coty’s ongoing interest expenses ($214m in FY25), with an implied operating cashflow coverage ratio of about 2.3x as of FY25 and 1.4x as of 1Q26. Similarly, Coty’s EBITDA coverage remains healthy at 3.1x as of FY25.
(Note: Coty’s cashflows tend to be somewhat seasonal in nature. For instance, 1Q cashflows have historically been lower than the other quarters due to a higher proportion of [non-cash] receivables in its P&L.)
Looking ahead, management has guided for FCF to come in above $350m in 1H26. This would still be lower than its results in the previous year (1H25: $411m), which appears fair considering the industry headwinds referenced above. As Coty delivers an improved performance going into 2H26, we hence expect its cashflows to remain robust and positive, starting with the guided $350m+ in 1H26 and likely remaining positive in 1H26.
Chart 8: Cashflows remain resilient (and are consistently positive)
Management focused on deleveraging, possibly through a future Wella sale
We focus on Coty’s leverage ratio (net debt to adjusted EBITDA), which is also the main ratio management focuses on. This ratio is used to calculate the spread (and hence the eventual interest rate) charged by its revolving credit facilities, with notable cut-offs for this ratio at 4x, 2.75x, and 2x, below which Coty would be entitled to lower interest rates. In addition, this ratio is part of Coty’s financial covenants regarding its loans, where Coty is required to keep a leverage ratio below 4x over each quarter.
Coty’s leverage ratio was approximately 3.5x as of FY25, and 3.1x based on its 1Q26 EBITDA run-rate (i.e. multiplied by 4). This represents a comfortable buffer below the 4x requirement referenced above. Looking ahead, we expect Coty’s leverage ratio to stay in the 3.0x to 3.5x range (similar to existing levels), as a challenging industry environment in FY26 may make it difficult for Coty to deleverage significantly.
However, one positive catalyst could come from a sale (partial or full) of its 25.84% stake in Wella. Coty has already pared its stake gradually over time following its initial 100% acquisition a decade ago, but still holds a 25.84% stake valued at $1,003m as of 30 Sep 2025 (30 Jun 2025: $1,002m). With Coty continuing to push for a sale (as guided in recent quarters), we note that a full Wella sale (assuming it reduces net debt by the same amount) would push its leverage ratio down from the 3.5x in FY25 to about 2.5x. Even a partial sale could still be a net positive for Coty’s leverage profile.
Summarising Coty and its bonds
Coty has several bonds outstanding. These mature between 2029 and 2031, though each bond may have multiple call dates before maturity at different prices – these are listed in Table 1 below. Consequently, we primarily focus on their yield-to-worst, which represents the most economically viable option for Coty at the time of writing.
(Note: These bonds are currently unsecured, as the associated collateral was released after it achieved an investment-grade rating in 2024. However, it will revert to a secured status should it lose this investment-grade rating in future.)
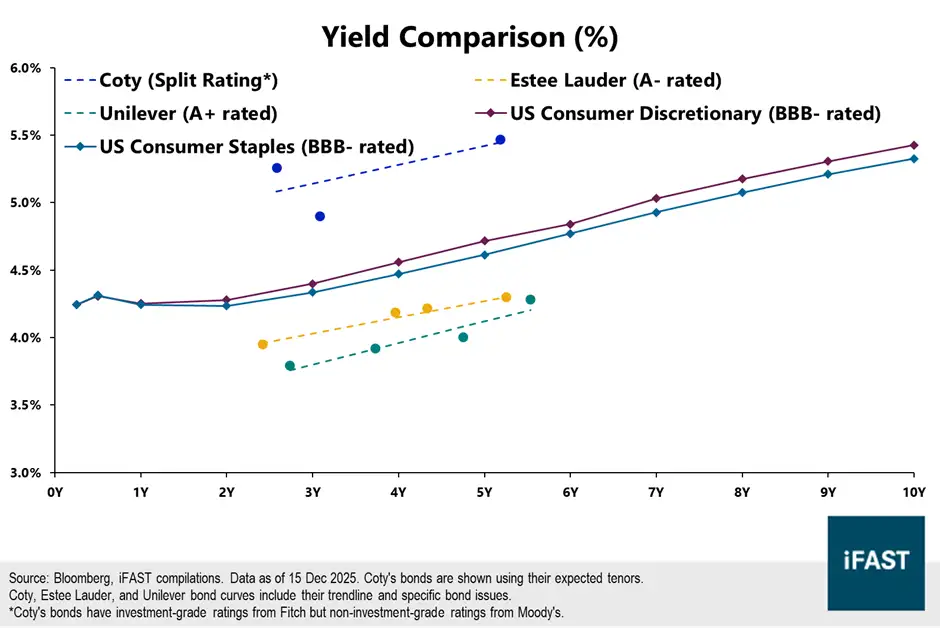
Coty’s bonds continue to trade around the 5% level, above the corporate yield curve for US investment-grade rated consumer names (Chart 9). While Coty itself has a split rating, its issuances offer a sizeable yield pickup for bond investors. In any case, issuances also offer comparable yields to BB-rated US Consumer Staples names. Additionally, compared to higher-rated peers like Estee Lauder and Unilever, Coty’s bonds offer decent yield pickups for similar tenors.
In all, we think Coty remains a decent proposition for bond investors. Bond investors can benefit from its resilient cashflows, particularly derived from its strong Prestige franchise. Furthermore, the possibility of non-core asset divestments (e.g. Wella) will give Coty additional room to deleverage over time, as management continues to focus on balance sheet discipline.
Table 1: Peer comparison – prefer Coty’s 2029 and 2030 bonds
| Bond Name | Reset / Maturity Date (Years to Reset / Maturity) |
Ask Price | Yield* | Credit Rating (S&P / Moody's / Fitch) | Notes on Call Prices |
| COTY 4.750% 15Jan2029 Corp (USD) | 15 Jan 2026 / 15 Jan 2027 / 15 Jan 2029 (0.1 / 1.1 / 3.1) |
99.586 | 5.15% (to Jan 2027) 4.90% (to Jan 2029) |
BBB- / Ba1 / BBB- | Current: 102.375 After 15 Jan 2026: 101.188 After 15 Jan 2027: 100 |
| COTY 6.625% 15Jul2030 Corp (USD) | 16 Jul
2026 / 15 Jul 2027 / 15 Jul 2028 / 15 Jul 2030 (0.6 / 1.6 / 2.6 / 4.6) |
103.254 | 5.46% (to
Jul 2027) 5.26% (to Jul 2028) 5.80% (to Jul 2030) |
BBB- / Ba1 / BBB- | After 16 Jul 2026: 103.313 After 15 Jul 2027: 101.656 After 15 Jul 2028: 100 |
| COTY 5.600% 15Jan2031 Corp (USD) | 15 Dec 2030 / 15 Jan 2031 (5.0 / 5.1) |
100.557 | 5.47% | BBB- / Ba1 / BBB- | - |
| EL 4.375% 15May2028 Corp (USD) | 15 Apr
2028 / 15 May 2028 (2.3 / 2.4) |
100.929 | 3.95% | A- / A3 / - | - |
| EL 2.375% 01Dec2029 Corp (USD) | 01 Sept 2029 / 01 Dec 2029 (3.7 / 4.0) |
93.454 | 4.19% | A- / A3 / - | - |
| EL 2.600% 15Apr2030 Corp (USD) | 15 Jan
2030 / 15 Apr 2030 (4.1 / 4.3) |
93.662 | 4.22% | A- / A3 / - | - |
| EL 1.950% 15Mar2031 Corp (USD) | 15 Dec 2030 / 15 Mar 2031 (5.0 / 5.2) |
89.069 | 4.30% | A- / A3 / - | - |
| UNANA 4.875% 08Sept2028 Corp (USD) | 08 Aug
2028 / 08 Sept 2028 (2.6 / 2.7) |
102.694 | 3.79% | A+ / A1 / WD | - |
| UNANA 2.125% 06Sept2029 Corp (USD) | 06 Jun 2029 / 06 Sept 2029 (3.5 / 3.7) |
93.843 | 3.92% | A+ / A1 / WD | - |
| UNANA 1.375% 14Sept2030 Corp (USD) | 14 Jun
2030 / 14 Sept 2030 (4.5 / 4.7) |
88.748 | 4.00% | A+ / A1 / WD | - |
| UNANA 4.750% 27Jun2031 Corp (USD) | - / 27 Jun 2031 (- / 5.5) |
102.269 | 4.28% | - / - / - | - |
| Source: Bloomberg, Bondsupermart, iFAST compilations. Data as of
15 Dec 2025. *Yield to worst is shown for most bonds, except for Coty 2029s and 2030s. |
|||||
Chart 9: Peer comparison with US Consumer names & Estee Lauder / Unilever
Declaration: For specific disclosure, at the time of publication of this report, IFPL (via its connected and associated entities) and the analyst who produced this report hold NIL positions in the abovementioned securities.
Our podcast series, Yield Hunters, is available on Spotify, iTunes Podcasts and Google Podcasts. We share our thoughts on new bond issues and hold discussions on the fixed income space. Listen to our latest episode below and follow us!









