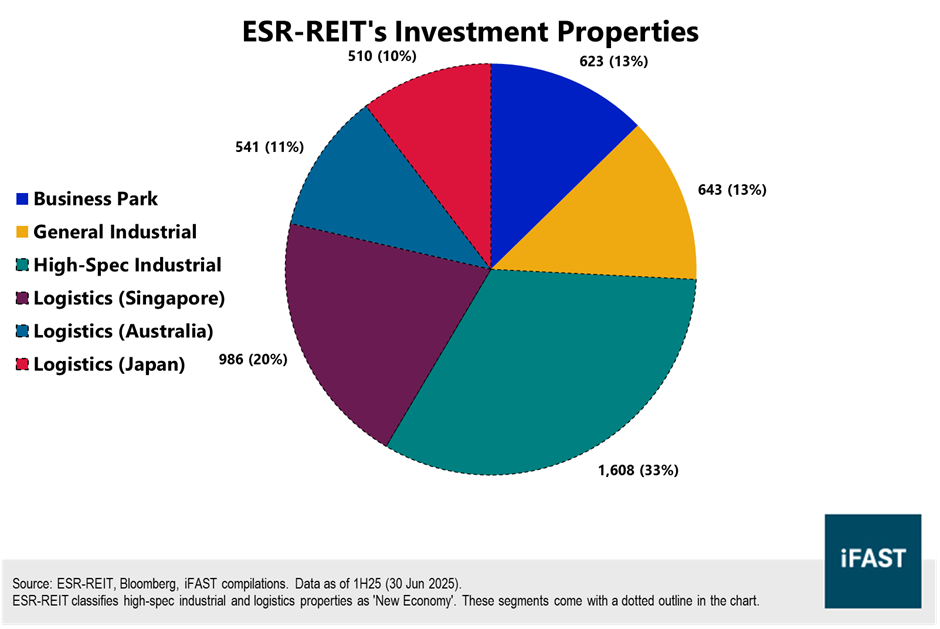
ESR-REIT is an SGX-listed industrial & logistics REIT. Its portfolio comprises 70 properties across Singapore, Australia, and Japan, generating steady rental income from a diverse mix of 378 tenants as of 30 June 2025. In recent years, the company has been gradually pivoting toward ‘New Economy’ assets, which it believes can benefit from long-term secular growth trends (Chart 1).
We previously covered ESR-REIT’s new issuances earlier this year based on their FY24 financials. This article will provide a credit update based on their recently released 1H25 financials. Yield hunters can read on if they are interested in SGD bonds yielding over 3%!
Related article: ESR-REIT announces SGD 5-year senior unsecured bonds at an IPG of 4.25%
Related article: ESR-REIT announces SGD NC5 perpetuals at an IPG of 6.00%
Chart 1: ESR-REIT’s investment properties
Financial highlights
(Unless otherwise stated: Results are in Singapore Dollars [SGD]. ESR-REIT’s latest results are for the first half of 2025 [January to June 2025] [1H25]. Growth figures are year-on-year [YoY].)
Stable operational metrics
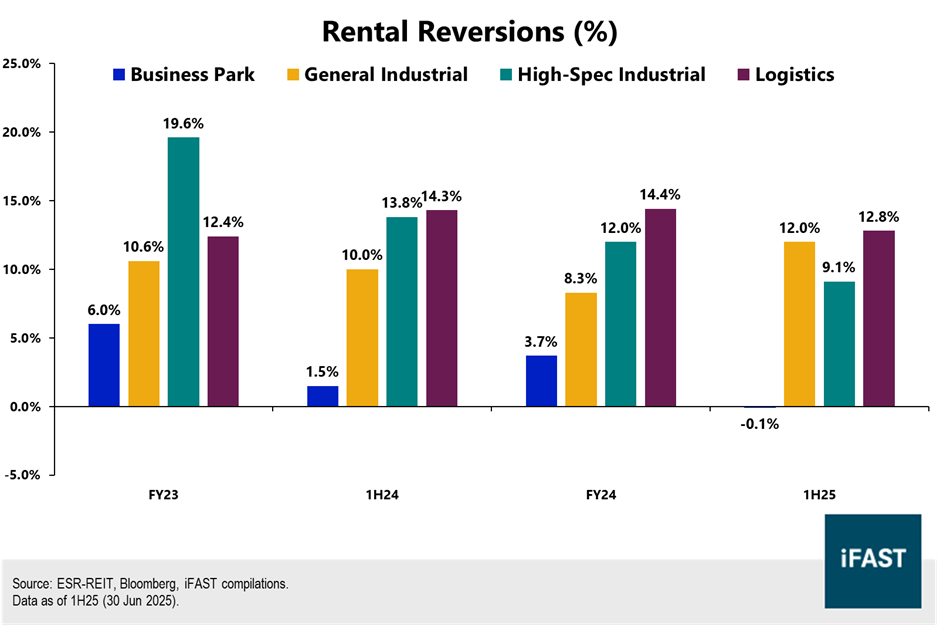
ESR-REIT reported healthy rental reversions of +9.7% in 1H25, driven by solid performances in its core industrial and logistics segments. The exception was the ‘Business Park’ segment, which once again saw the weakest rental reversion at -0.1% (Chart 2). Portfolio occupancy rates held relatively steady at 91.2% in 1H25, marginally lower than the 91.4% in 1H24. The dip was largely attributed to the Japan segment, where ESR-REIT cited a subdued growth outlook in Japan, coupled with a rising supply of logistics facilities.
On the whole, we view ESR-REIT’s operational metrics as stable and relatively healthy. While a few indicators technically softened modestly year-on-year, we think the changes were minor and are not indicative of any structural deterioration.
Chart 2: 1H25 Rental reversions
Profitability improved in 1H25
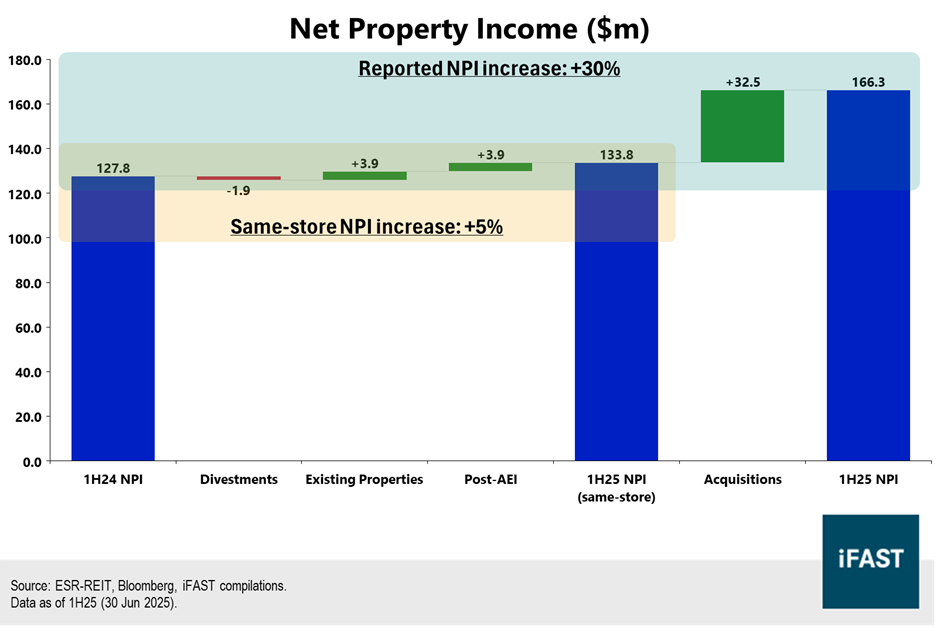
In 1H25, ESR-REIT’s revenues grew +23% from $181m to $223m, while property expenses grew at a much slower pace (+7% to $57m). This lifted net property income (NPI) by +30% to $166m. This improvement was largely driven by the November 2024 acquisitions of ESR Yatomi Kisosaki Distribution Centre and 20 Tuas South Avenue 14. However, even on a same-store basis, NPI still grew by +5% (Chart 3).
On the expenses front, net borrowing costs surged +38% to $45m (reflecting the impact of these debt-driven acquisitions), standing out as the most significant drag in an otherwise well-contained cost base. Other expense line items (e.g. finance costs on lease liabilities) saw more moderate increases, generally within the +5% to +15% range.
Fair value losses (on investment properties) were a recurring challenge, though they narrowed to just -$42m in 1H25 (1H24: -$84m). The ‘Business Park’ segment continued to be under pressure, as the fair value of its (four) properties fell to $623m, -14% lower than $725m a year back in 1H24. Valuations across other reportable segments (including ‘New Economy’) remained under pressure too, though declines were less pronounced.
Overall, ESR-REIT delivered improved profitability in 1H25, supported by a stronger operational performance and further supplemented by moderating fair value losses. Total returns after tax swung into the black at $34m compared to a -$13m loss in 1H24.
Chart 3: Net property income grew strongly YoY, based on both same-store and reported metrics
Cashflows weakened slightly, but nothing too major
ESR-REIT’s operating cashflows remained decent at +$149m in 1H25, higher than 1H24’s figure of +$105m, again reflecting the improved operational performance mentioned previously. However, investing and financing cashflows were lower in 1H25 relative to 1H24 due to a slower pace of (non-core) asset disposals and higher finance costs. Hence, net cashflows came in at -$17m in 1H25, worse than 1H24’s +$6m.
We are, however, not overly concerned with weaker investing cashflows as asset disposals can generally be lumpy across reporting periods. In addition, higher finance costs were unsurprising given ESR-REIT’s recent debt-fuelled acquisitions. Instead, we think the improvement in operating cashflows reflects the improving fundamentals of ESR-REIT. Over the medium term, we expect continued non-core asset disposals as ESR-REIT pivots toward ‘New Economy’ segments, and such disposals can continue to provide additional liquidity over time.
Credit profile has softened but looks to be stabilising
ESR-REIT’s total assets and total liabilities both increased significantly from 1H24 to 1H25, partially reflecting the large acquisitions made in November 2024 totalling about $775m (Table 1). In addition, current liabilities increased by +48% to $521m, reflecting the re-classification of some borrowings from non-current to current. This in turn resulted in its cash ratio and operating cashflow ratio both weakening to varying extents. Nonetheless, we highlight that management has acknowledged its net current liabilities position and expressed confidence in refinancing these borrowings.
Its MAS Aggregate Leverage ratio similarly worsened from 36.5% in 1H24 to 42.6% in 1H25. This was due to debt and asset levels both increasing by similar dollar amounts, as a direct result of the acquisitions mentioned above (in November 2024). While this gearing ratio of 42.6% gives it a decent buffer over regulatory requirements of 50%, ESR-REIT remains one of the more leveraged names within the S-REIT space.
ESR-REIT also reported a debt headroom of $793m based on the 50% regulatory limit, which is markedly lower than the $1,208m in 1H24 but still sizeable. Nonetheless, perpetual-holders should note that this calculation likely assumes any debt taken results in a similar increase to assets (e.g. to cash, or to acquire a property of that value); if the calculation assumes any debt taken is used to redeem / refinance perpetuals, then that figure would be significantly lower at $385m (Table 2).
Finally, we highlight that ESR-REIT’s interest coverage ratio remained relatively steady at 2.4x (1H24: 2.5x). This is unsurprising as the improved operational performance (new profit contributions from the fresh acquisitions) helped to mitigate higher borrowing costs. ESR-REIT also managed to refinance borrowings at lower rates (cost of debt was 3.47% in 1H25 vs 3.84% in FY24), helping to mitigate interest pressures.
In all, we acknowledge that ESR-REIT’s credit profile has weakened. However, this weakening was likely due to major acquisitions conducted in late 2024; with management not signalling further major acquisitions ahead, we think the underlying credit fundamentals of ESR-REIT remain similar to before.
Table 1: Total assets and liabilities both increased, with current liabilities seeing a large increase too
| ESR-REIT Credit Metrics | As of 30 Jun 2024 | As of 31 Dec 2024 | As of 30 Jun 2025 | Comparison from 1H24 to 1H25 |
| Total Assets [A] | 4,982 | 6,007 | 5,906 | +924 (+19%) |
| Total Liabilities [B] | 2,333 | 3,332 | 3,254 | +921 (+39%) |
| Total Assets / Total Liabilities (x) [A / B] | 2.1 | 1.8 | 1.8 | -0.3pp |
| Cash (excluding Restricted Cash) [C] | 43 | 70 | 54 | +25% |
| Current Liabilities [D] | 351 | 242 | 521 | +48% |
| Cash Ratio (%) [C / D] | 12% | 29% | 10% | -2.0pp |
| Operating Cash Flow [E] | 105 | 165 | 149 | +42% |
| Operating Cash Flow Ratio (%) [E / D] | 30% | 68% | 29% | -1.3pp |
| Source: ESR-REIT, Bloomberg, iFAST compilations.
Data as of 1H25 (30 Jun 2025). Figures are in $m unless otherwise stated. |
||||
Table 2: ESR-REIT’s credit metrics, including MAS-related ratios
| ESR REIT - MAS Requirements | As of 30 Jun 2024 | As of 31 Dec 2024 | As of 30 Jun 2025 | Yearly Comparison |
| Total Debt | 1,553.1 | 2,269.7 | 2,218.4 | +43% |
| MAS Aggregate Leverage (Debt to Total Assets) (%) | 36.5% | 42.8% | 42.6% | +6.1pp |
Reported Debt Headroom (debt taken increases assets by equivalent amount) |
1,207.8 | 790.2 | 792.5 | -34% |
Debt Headroom (debt taken is used to redeem perpetuals) |
574.4 | 381.8 | 385.4 | -33% |
| MAS ICR (including perpetuals) (x) | 2.5 | 2.5 | 2.4 | -0.1x |
| Source: ESR-REIT, Bloomberg, iFAST compilations.
Data as of 1H25 (30 Jun 2025). Figures are in $m unless otherwise stated. |
||||
Our take on their 1H25 results and outlook ahead
We think the stable operational metrics and improved profitability referenced above indicate positive earnings momentum for ESR-REIT. Management has guided for revenues to continue increasing following the acquisitions and asset enhancements made recently. Meanwhile, rental reversions are projected to remain positive, though management expects it to slow from the +9.7% reported in 1H25. Based on this, we would also expect revenue growth to slow down (but remain positive), especially from 2026 onward, after we have seen the full-year impact from these acquisitions and asset enhancements.
Fair value losses will be something worth monitoring moving forward. We highlight this considering the magnitude of fair value losses, and the persistence of said losses for consecutive reports now, particularly within the Business Park segment (which is also suffering from low rental reversions). These are non-cash and may not be a major issue in the near-term as ESR-REIT’s operating cashflow profile is on the upswing. However, it may emerge as a longer-term issue if fair-value losses persist, as it may affect ESR-REIT’s ability to sell non-core assets at attractive valuations as it pivots toward ‘New Economy’ segments. This may hence affect ESR-REIT’s longer-term liquidity profile, which would then influence the callability of its perpetuals.
ESR-REIT’s credit profile remains fairly leveraged compared to peers, though our base case is for it to stabilise moving forward. Management appears to now be focusing more on debt management rather than further (large) acquisitions, and has targeted to reduce aggregate leverage below 40% through sales of non-core assets. Meanwhile, they are also looking to continue lowering their cost of debt, especially if Australian and Singapore rates fall (e.g. due to rate cuts), ultimately helping to ease interest coverage pressures.
To summarise, we acknowledge ESR-REIT is one of the more leveraged S-REIT names today, but think that their broader profit growth and credit profiles remain manageable. This issuer would be a decent consideration for those comfortable with slightly higher-than-average risks.
Consider ESR-REIT’s 2030 bonds
ESR-REIT’s bonds generally have higher yields compared to those from comparable peers, due to its more leveraged profile. Chart 4 shows how its aggregate leverage and interest coverage compare against its industrial & logistics peers. We primarily recommend ESR-REIT’s fixed-rate bonds maturing in 2030 (EREIT 4.050% 27Feb2030 Corp (SGD)) (Table 3).
These bonds are yielding about 3.5% currently, markedly higher than those from Mapletree Industrial Trust and Frasers Logistics & Commercial Trust (low-mid 2%), which were referenced in Chart 4 below. We also included bonds from other types of property issuers, illustrating that ESR-REIT’s bonds do offer a decent yield pickup against most of the SGD bond universe.
Chart 4: Comparison of MAS ratios across industrial & logistics peers
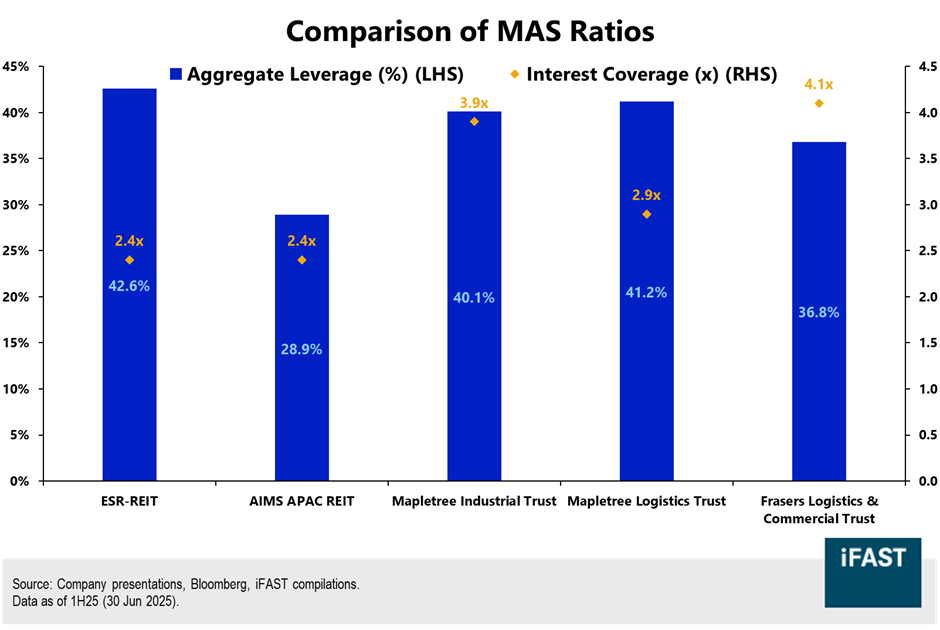
Table 3: Bond comparison (recommendation bolded)
| Bond Name | Reset / Maturity Date (Years to Reset / Maturity) |
Ask Price | Yield to Worst** | Credit Rating (S&P / Moody's / Fitch) |
| EREIT 2.600% 04Aug2026 Corp (SGD) | - / 04 Aug 2026 (- / 0.9) |
100.175 | 2.42% | - / - / - |
| EREIT 4.050% 27Feb2030 Corp (SGD) | - / 27 Feb
2030 (- / 4.5) |
102.350 | 3.48% | - / - / - |
| MINTSP 3.580% 26Mar2029 Corp (SGD) | - / 26 Mar 2029 (- / 3.6) |
105.125 | 2.08% | - / - / BBB+ |
| FLTSP 3.830% 26Mar2029 Corp (SGD) | - / 26 Mar
2029 (- / 3.6) |
105.817 | 2.13% | NR / - / BBB+ |
| GUOLSP 3.290% 26Oct2026 Corp (SGD) | - / 26 Oct 2026 (- / 1.2) |
100.850 | 2.56% | - / - / - |
| ARTSP 3.690% 15Mar2029 Corp (SGD) | - / 15 Mar
2029 (- / 3.6) |
104.800 | 2.27% | - / - / BBB |
| HPLSP 4.200% 30Mar2027 Corp (SGD) | - / 30 Mar 2027 (- / 1.6) |
101.950 | 2.93% | - / - / - |
| HPLSP 4.400% 10Jun2030 Corp (SGD) | - / 10 Jun
2030 (- / 4.8) |
104.825 | 3.30% | - / - / - |
| Source: Bloomberg, Bondsupermart, iFAST compilations. Data as of 26 Aug 2025. | ||||
ESR-REIT’s perpetuals: for investors with higher risk tolerances
ESR-REIT also has some perpetuals outstanding, which are better-suited for aggressive investors willing to take on more equity-like risks.
Features to take note of
First, these perpetual bonds come with regular call dates that are fully at the issuer’s (ESR-REIT’s) discretion. On one hand, issuers who regularly tap capital markets may want to develop a ‘reputation’ for calling. However, issuers can and will not call if the economics do not line up for such a call, notwithstanding such ‘reputational risks’.
Second, these perpetuals allow for the non-cumulative deferral of coupons. In other words, an issuer (e.g. ESR-REIT) can opt not to pay (defer) these coupon payments at any time, once again fully at their own discretion. Even if they restart coupon payments after, they are not obliged to ‘refund’ investors for previous periods where they did not pay coupons (non-cumulative). Once again, there is a balance between reputational risks and economic reasons which warrant issuer-by-issuer analyses.
(Note: These perpetuals also come with dividend stopper clauses, which prevent ESR-REIT from making stock dividends if they miss payments on their perpetual coupons.)
These features are equity-like in nature – coupon deferral means that regular income is not ‘guaranteed’ (just like equity dividends), while non-call risks mean that in a non-call event, investors who wish to ‘cash out’ may have to sell their bonds on the market. We strongly emphasise again that notwithstanding reputational risks of non-calls or coupon deferrals, issuers can and will choose these options if the economics of such choices make sense.
Comparison of perpetuals
ESR-REIT’s perpetuals generally also come with higher yields compared to most of its peers (Table 4). There is a clear yield pickup compared to its industrial and logistics peers, such as if we compare EREIT 6.000% Perpetual Corp (SGD) (about 4.8% yield-to-reset) with MLTSP 4.300% Perpetual Corp (SGD) (about 3.5% yield-to-reset). This is also observable if we compare ESR-REIT’s perpetuals to those from most other property issuers.
Between ESR-REIT’s three outstanding perpetuals, we prefer EREIT 6.000% Perpetual Corp (SGD). We like that it has the highest initial margin of the three, which lowers the non-call risks embedded in its perpetuals. The longer time to reset also gives management time to execute its strategic pivot toward ‘New Economy’ segments, bearing in mind nearer-term macro risks in various geographical segments too. Investors should note that if ESR-REIT decides not to call these perpetuals, it will reset at 5y SORA + 3.548%, which based on the latest 5y SORA of 1.99%, would stand at an indicative reset of 5.05%.
Table 4: SGD Perpetual comparison
| Bond Name | Reset / Maturity Date (Years to Reset / Maturity) |
Ask Price | Yield to Next Reset | Reset Rate | Credit Rating (S&P / Moody's / Fitch) |
| EREIT 5.500% Perpetual Corp (SGD) | 09 Jun 2027 / - (1.8 / -) |
101.467 | 4.62% | 5y SORA + 2.958% | - / - / - |
| EREIT 6.000% Perpetual Corp (SGD) | 20 Aug
2029 / - (4.0 / -) |
104.250 | 4.81% | 5y SORA + 3.548% | - / - / - |
| EREIT 5.750% Perpetual Corp (SGD) | 20 Mar 2030 / - (4.6 / -) |
103.900 | 4.78% | 5y SORA + 3.512% | - / - / - |
| AAREIT 5.375% Perpetual Corp (SGD) | 01 Sep
2026 / - (1.0 / -) |
101.717 | 3.64% | 5y SORA + 4.654% | - / - / - |
| AAREIT 4.700% Perpetual Corp (SGD) | 18 Mar 2030 / - (4.6 / -) |
103.175 | 3.93% | 5y SORA + 2.437% | - / - / - |
| MLTSP 3.725% Perpetual Corp (SGD) | 02 Nov
2026 / - (1.2 / -) |
101.000 | 2.86% | 5y SORA + 2.485% | - / - / BBB- |
| MLTSP 4.300% Perpetual Corp (SGD) | 22 Aug 2029 / - (4.0 / -) |
102.917 | 3.50% | 5y SORA + 1.871% | - / - / BBB- |
| LREIT 4.200% Perpetual Corp (SGD) | 04 Jun
2026 / - (0.8 / -) |
100.954 | 2.94% | 5y SOR + 3.240% | - / - / - |
| LREIT 4.750% Perpetual Corp (SGD) | 28 Feb 2028 / - (2.5 / -) |
102.500 | 3.69% | 3y SORA + 2.185% | - / - / - |
| GUOLSP 4.350% Perpetual Corp (SGD) | 25 Feb
2030 / - (4.5 / -) |
100.800 | 4.15% | 5y SORA + 1.803% + 1.000% (step-up) | - / - / - |
| ARTSP 4.600% Perpetual Corp (SGD) | 07 Feb 2030 / - (4.5 / -) |
103.750 | 3.67% | 5y SORA + 1.957% | - / - / - |
| ARTSP 4.200% Perpetual Corp (SGD) | 28 Mar
2031 / - (5.6 / -) |
102.625 | 3.68% | 5y SORA + 2.133% | - / - / - |
| HPLSP 5.500% Perpetual Corp (SGD) | 30 Oct 2029 / - (4.2 / -) |
102.683 | 4.78% | 5y SOR + 2.863% + 1.000% (step-up) | - / - / - |
| Source: Bloomberg, Bondsupermart, iFAST compilations. Data as of 26 Aug 2025. | |||||
Declaration: For specific disclosure, at the time of publication of this report, IFPL (via its connected and associated entities) holds a position in GUOLSP 3.290% 26Oct2026 Corp (SGD), AAREIT 5.375% Perpetual Corp (SGD), MLTSP 3.725% Perpetual Corp (SGD), and LREIT 4.750% Perpetual Corp (SGD). The analyst who produced this report holds an NIL position in the abovementioned securities.
Our podcast series, Yield Hunters, is available on Spotify, iTunes Podcasts and Google Podcasts. We share our thoughts on new bond issues and hold discussions on the fixed income space. Listen to our latest episode below and follow us!