


Highlights:
- Rakuten Group achieved a preliminary "self-funding mode", with steady improvement in overall operational performance. Its E-commerce & internet business remains stable, while the financial services segment, driven by Rakuten Bank, has shown strong profit growth. Both segments are expected to continue providing robust cash inflows at the Group level. The mobile business is highly likely to turn profitable in 2025, with its investment peak behind it.
- Rakuten Group is currently in a deleveraging phase, with a manageable leverage level. As its businesses develop, the group’s credit risk is expected to become increasingly controllable.
- We believe Rakuten Group’s credit risk is well-manageable over the short- to medium-term. Investors could consider its 2027 or 2029 USD bonds, with yield to maturity of 6.3% and 7.6% respectively, which are worth investors’ attention.
Rakuten Group’s core operations span three key segments: e-commerce & internet, financial services and mobile. In e-commerce, Rakuten is Japan’s largest domestic platform by gross merchandise value (GMV) in 2024. Its financial services segment includes subsidiaries such as Rakuten Bank, Rakuten Card and Rakuten Securities. Additionally, the Group entered the mobile telecom market in 2018 with the establishment of Rakuten Mobile.
Rakuten Group Achieved Preliminary "Self-funding Mode"
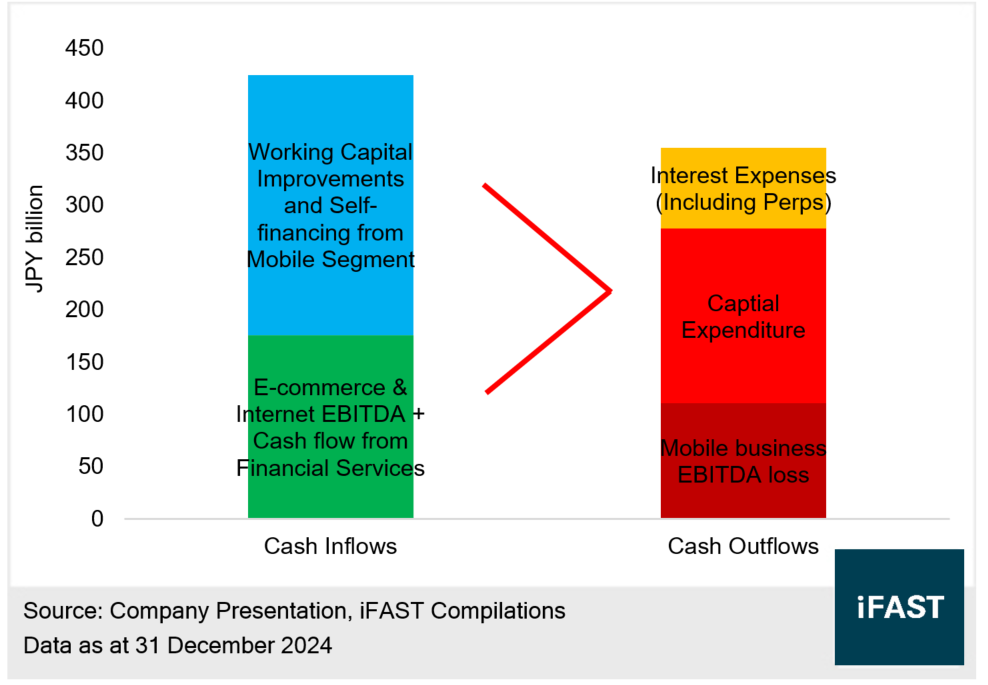
In our previous analyses, Rakuten was expected to cover its interest expenses and capital expenditures through cash flows from its e-commerce & internet and financial services segments by 2024.
As shown in Chart 1, the Group has successfully met this target. Through profits and cash flows from e-commerce & internet businesses, financial services, improved working capital and self-financing in the mobile segment, Rakuten has covered its interest expenses, capital expenditures and losses from the mobile business, achieving a preliminary "self-funding mode".
Chart 1: Rakuten Group’s Cash Inflows and Outflows in 2024
Steady Operational Performance with Progress
As shown in Table 1, Rakuten Group’s three main segments (e-commerce & internet, financial services, and mobile) recorded varying degrees of revenue growth and profit improvement (or reduced losses). The e-commerce & internet and financial services segments demonstrated strong profitability, while the mobile segment significantly reduced its EBITDA losses, easing liquidity pressures and reflecting steady operational progress.
Table 1: Rakuten Group Operational Performance
|
(JPY billion) |
2024 Revenue (YoY Growth) |
2025 Q1 Revenue |
2024 EBITDA |
2025 Q1 EBITDA (YoY Growth) |
|
E-commerce & Internet |
1,282.1 |
305.5 |
131.6 |
23.5 |
|
Financial Services |
820.4 |
223.6 |
223.7 |
60.1 |
|
Mobile |
440,7 |
110.1 |
-49.4 |
-6.5 |
|
Total* |
2,279.2 |
562.7 |
326.0 |
79.9 |
|
*Considering the adjustment part, the total amount is not equal to the sum of three segments Sources: Company’s Announcements, iFAST compilations Data as of 31 March 2025 |
||||
E-commerce & Internet Business Remains Stable, Providing Steady Cash Flow
The e-commerce & internet segment has shown stable performance. As shown in Chart 2, Rakuten’s e-commerce platform maintained flat GMV in 2024, with the take rate rising from 14.6% to 15.3%, further increasing to 16.6% in Q1 2025, reflecting improved profitability.
Chart 2: E-commerce Business Operational Metrics
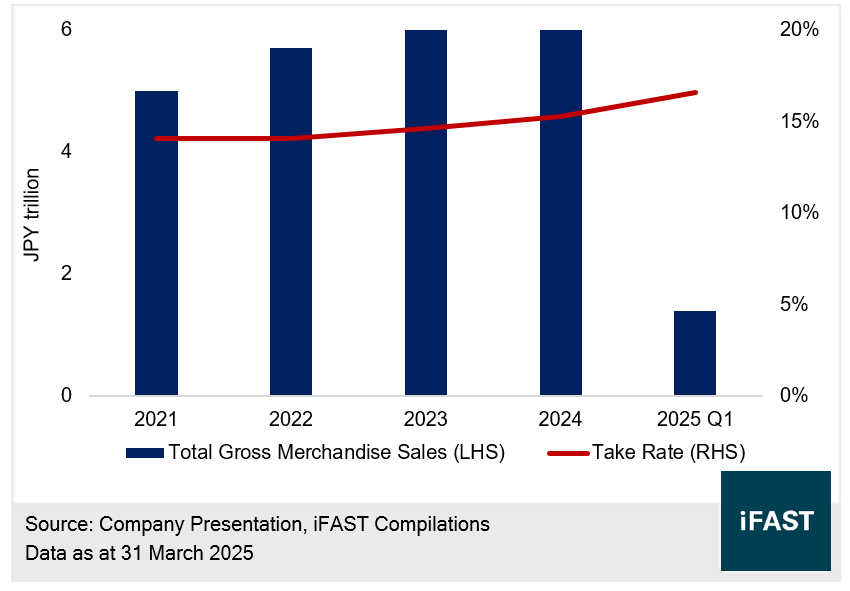
The management has set a target for 2025 of mid-to-high single-digit GMV growth for the e-commerce segment. With organic growth, the stable take rate and the Group’s focus on leveraging AI for cost savings, we expect this segment’s EBITDA to achieve single-digit growth in 2025, continuing to provide stable cash inflows for the Group.
Financial Services Growth Driven by Rakuten Bank
As shown in Table 2, the financial services segment comprises three main businesses: Rakuten Bank, Rakuten Card and Rakuten Securities, contributing approximately 42%, 40% and 20% of operating profit respectively.
Table 2: Financial Services Segment - Operating Profit, Growth and Profit Breakdown
|
(JPY billion) |
2024 Operating Profit (YoY Growth) |
2025 Q1 Operating Profit (YoY Growth) |
Operating Profit Contribution in 2024 |
|
Rakuten Bank |
62.6 (+38%) |
22.0 (+68%) |
42% |
|
Rakuten Card |
62.1 (+20%) |
14.5 (-5%) |
40% |
|
Rakuten Securities |
31.2 (+9%) |
8.2 (+17%) |
20% |
|
Other Businesses & Eliminations |
-2.5 |
-4.7 |
-2% |
|
Total Financial Services |
153.4 (+38%) |
43.9 (+23%) |
100% |
|
Sources: Company’s Announcements, iFAST compilations Data as of 31 March 2025 |
|||
As of March 31, 2025, Rakuten Bank’s user account grew 10% YoY to 16.8 million. Benefiting from the Bank of Japan’s interest rate hikes and significant deposit growth, the bank’s net interest margin widened, driving a strong net interest income growth (see Table 3).
Table 3: Rakuten Bank’s Main Operational Metrics
|
(JPY billion) |
2024 |
YoY Growth |
2025 Q1 |
YoY Growth |
|
Total Revenue |
147.2 |
+20% |
43.7 |
+30% |
|
- Net Interest Revenue |
91.2 |
+30% |
29.5 |
+51% |
|
- Non-interest Revenue |
56.0 |
+6% |
14.2 |
+2% |
|
Net Interest Margin (%) |
1.0% |
+10 bps |
1.2% |
+22 bps |
|
Operating Profit Margin (%) |
42.5% |
+550 bps |
50.0% |
+1,120 bps |
|
Sources: Company’s Announcements, iFAST compilations Data as of 31 March 2025 |
||||
Additionally, although Rakuten Bank's credit cost ratio is under slight upward pressure due to an increase in non-guaranteed personal loans, it remains low at 0.07% (from April 2024 to March 2025), up by 2 basis points YoY, still indicating a low operational risk. As Japan remains in an interest rate hike cycle, with potential further increases in the second half of 2025 or early 2026, Rakuten Bank’s performance is expected to strengthen further.
Rakuten Card benefited from higher penetration, increased user numbers and rising average user spending, with transaction volume growing 14% YoY to JPY 24 trillion in 2024 (see Table 4). Although the take rate (revenue/transaction volume) slightly declined, operating profit margins improved due to enhanced operational efficiency and optimized marketing strategies. The performance was solid.
Table 4: Rakuten Card’s Main Operational Metrics
|
2023 |
2024 |
YoY Growth |
2025 Q1 |
|
|
Card Transaction Volume (JPY trillion) |
21.1 |
24.0 |
+14% |
6.3 |
|
Revenue (JPY billion) |
316.6 |
339.3 |
+7% |
87.3 |
|
Revenue / Transaction Volume (Take Rate) (%) |
1.50% |
1.41% |
-9 bps |
1.39% |
|
Operating Profit Margin (%) |
16.3% |
18.3% |
+200 bps |
16.6% |
|
Sources: Company’s Announcements, iFAST compilations Data as of 31 March 2025 |
||||
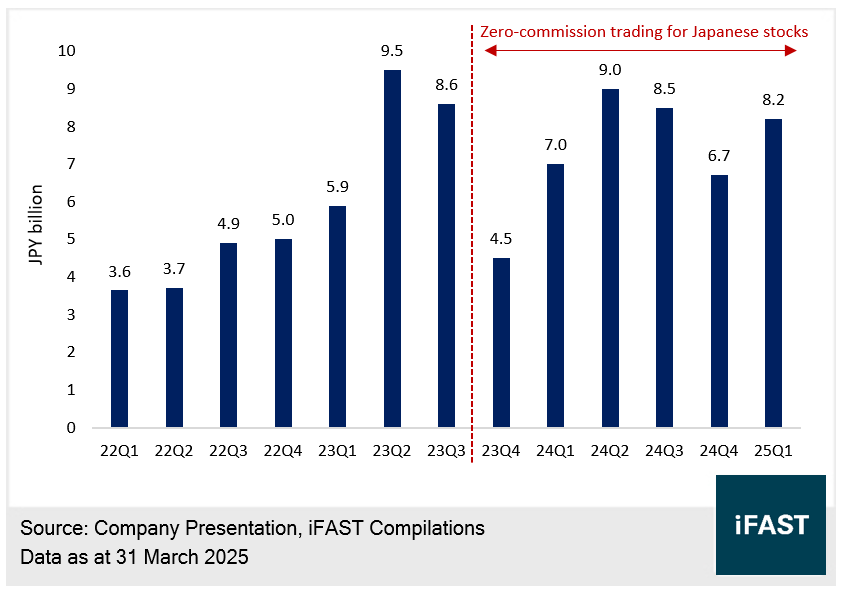
Rakuten Securities benefited from its diversified business model. Since introducing zero-commission trading for Japanese stocks in October 2023 and the Government’s promotion of the Nippon Individual Savings Account (NISA) tax incentive program, the client numbers grew 17% YoY and total trading volume surged. This created additional revenue streams, including net interest income from client deposits and margin trading, as well as fees from other services (international securities, bonds, funds, CFDs and forex) and investment management.
In Q1 2025, Rakuten Securities’s operating profit rose 17% YoY to JPY 8.2 billion, with quarterly operating profits returning to the peak levels of Q2 and Q3 2023 (see Chart 3), confirming new growth drivers that offset the impact of zero-commission trading.
Chart 3: Rakuten Securities’s Quarterly Operating Profits
Overall, the financial services segment’s profit growth, driven by Rakuten Bank, demonstrates strong performance and is expected to continue providing significant cash inflows to the Group. Additionally, Rakuten might pursue IPOs for Rakuten Card and Rakuten Securities, enhancing its equity financing capabilities and better reflecting the value of its subsidiaries.
The Mobile Segment Likely To Turn Profitable in 2025, with Investment Peak Passed
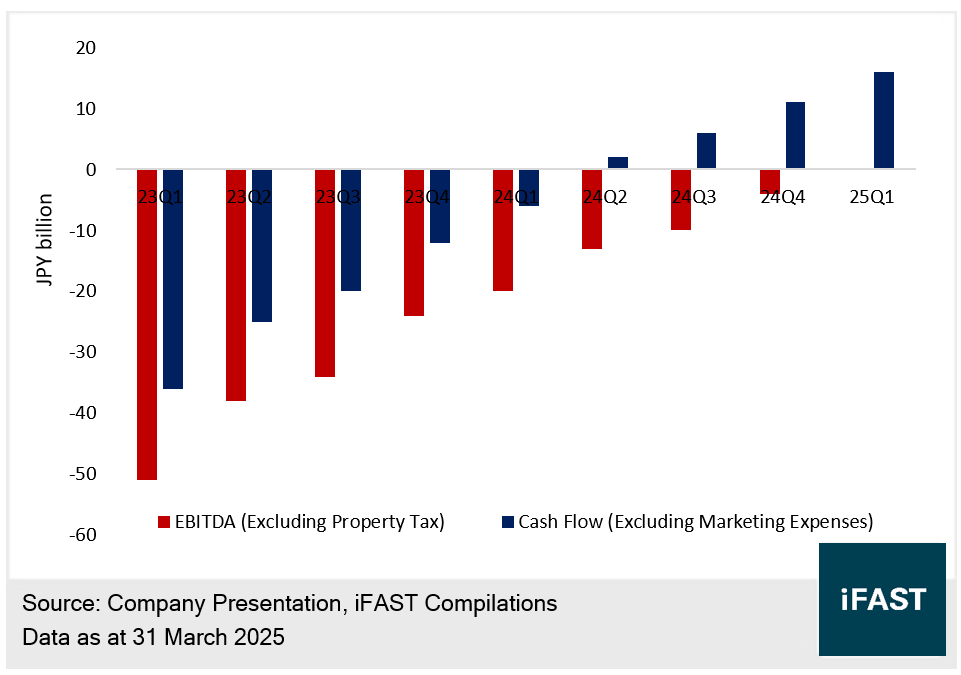
As shown in Chart 4, Rakuten Mobile’s EBITDA (excluding property taxes) achieved breakeven in Q1 2025, with cash flow (excluding marketing expenses) already turning positive in 2024 Q2. The Group noted that the segment achieved positive monthly EBITDA from December 2024. With continued growth in telecom service revenue, Rakuten Mobile is highly likely to achieve full-year profitability in 2025, entering a harvest phase.
Chart 4: Rakuten Mobile’s Quarterly EBITDA and Cash Flow
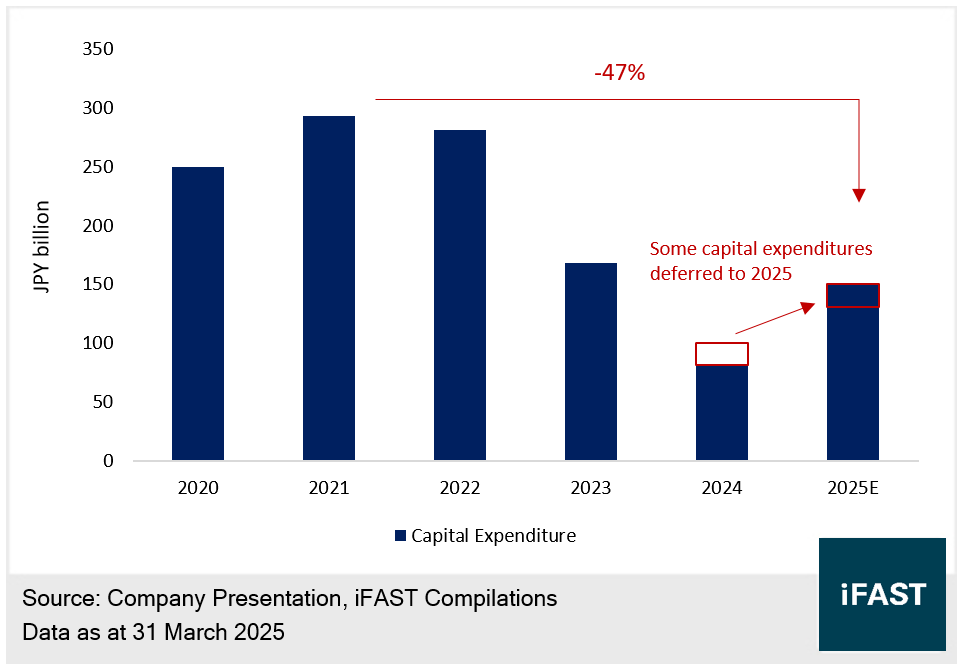
Historically, the high capital expenditure of Rakuten Mobile has drawn market criticism. However, as shown in Chart 5, annual capital expenditure has halved from a peak of nearly JPY 300 billion to below JPY 150 billion, indicating that the investment peak has passed and liquidity pressures are now manageable.
Chart 5: Rakuten Mobile’s Capital Expenditure
As a conglomerate, Rakuten Group can cover the mobile segment’s funding gap (estimated at negative JPY 150 billion in free cash flow for 2025) with profits or cash flows from other segments (totaling nearly JPY 200 billion). The Group could get support from other segments to one segment, in contrasts with the past reliance on new debt issuance. As mentioned, the Group’s preliminary self-funding mode suggests that its operational and credit outlook could continue to improve.
Notably, Rakuten Group confirmed that recent tariff wars have no direct impact on its businesses, reinforcing our view that Rakuten Group is a one of the defensively positioned companies with low exposure to trade-related risks (related article).
The Group is Now in Deleveraging Phase, with Credit Risk Being Increasingly Manageable
Regarding credit metrics, Rakuten Group has entered a phase of consistent profitability and stated it will not require new financing in the foreseeable future (only refinancing existing debt). The total debt was peaked in mid-2024 (see Table 5), and the Group is now in a deleveraging phase.
Table 5: Rakuten Group’s Credit Metrics (at the Group level, non-consolidated)
|
Dec 23 |
Jun 24 |
Dec 24 |
Mar 25 |
|
|
Total Cash (JPY billion) |
206.9 |
306.2 |
750.0 |
330.6 |
|
Other Assets (JPY billion) |
4106.2 |
4492.5 |
4667.9 |
4529.0 |
|
Total Debt (JPY billion) |
1420.0 |
1871.5 |
1570.6 |
1277.7 |
|
Total Equity (JPY billion) |
1690.1 |
1749.3 |
2054.2 |
2045.3 |
|
Net Gearing Ratio (%) |
72% |
89% |
40% |
46% |
|
Total Debt / Other Assets |
35% |
42% |
34% |
28% |
|
Net Debt / Market Capitalisation (%) |
90% |
88% |
46% |
54%* |
|
*Market Capitalisation as of 19 May 2025 Sources: Company’s Announcements, iFAST compilations Data as of 31 March 2025 |
||||
As shown in Table 5, as of 31 March 2025, the total debt at the group level fell 9% YoY to JPY 1277.7 billion. The net gearing ratio and total debt to other assets ratio declined to 46% and 28% respectively, a significant improvement from December 2023. Using market capitalization (reflecting the Group’s equity financing capacity) instead of total equity, the net debt to market capitalisation ratio was 54%. All of them indicated the leverage level was manageable.
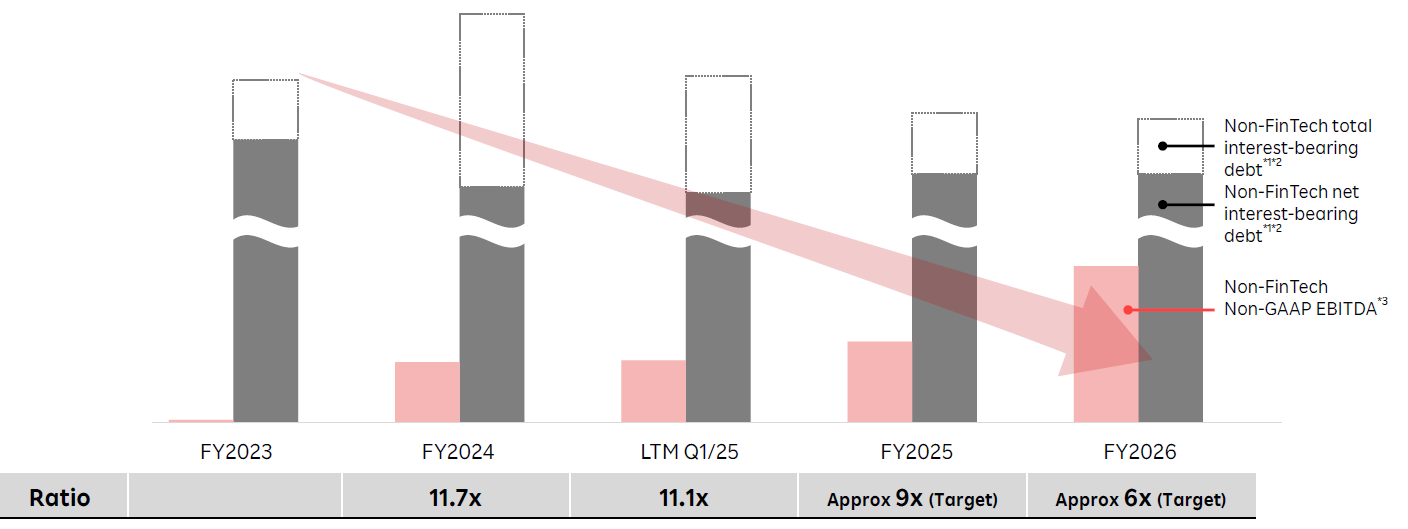
Rakuten Group has set a medium- to long-term leverage target of net debt (excluding financial services debt) to EBITDA (excluding financial services) below 5x. As shown in Chart 6, the Group expects to approach 6x by fiscal year 2026, reflecting confidence in doubling EBITDA while controlling debt levels. As the business grows, we believe Rakuten’s overall credit risk will become increasingly manageable.
Chart 6: Net Debt (excluding financial services debt) to EBITDA (excluding financial services) Ratio and Target
Source: Company’s Presentation
Data as of 31 March 2025
Rakuten Group’s Credit Risk is Well-manageable over Short- to Medium-Term, with 2029 Bond Yielding at 7.1%
Rakuten’s current credit rating is BB (S&P), with potential for an upgrade as profitability improves. Given the Group’s high-quality assets, including Rakuten Bank, Rakuten Securities and Rakuten Card, which can provide liquidity through equity financing or sales, combined with its ability to refinance via USD or JPY bonds, strong profitability in e-commerce & internet and financial services, and the mobile segment’s transition to profitability, we assess Rakuten Group’s credit risk is well-manageable over short- to medium-term.
Investors could consider its 2027 USD bond, “RAKUTN 11.250% 15Feb2027 Corp (USD)”, or 2029 USD bond, “RAKUTN 9.750% 15Apr2029 Corp (USD),” with yield to maturity of 6.3% and 7.6%, respectively. Both of them offer attractive opportunities, which are worth investors’ attention.
Related Risks
Rakuten Group still has to deploy a certain capital expenditure in its mobile segment. If the capital expenditure unexpectedly increases, it could result in a deteriorating liquidity and affect the debt repayment ability.
Rakuten Group’s operating performances could be related to the equity financing abilities of the Group and its subsidiaries, or even the value of the subsidiaries. If any of the three main segments (E-commerce & Internet, Financial Services and Mobile) has a deterioration in the operating conditions, it could increase the Group’s credit risk.
Conclusion
Rakuten Group achieved a preliminary "self-funding mode", with steady improvement in overall operational performance. Its E-commerce & internet business remains stable, while the financial services segment, driven by Rakuten Bank, has shown strong profit growth. Both segments are expected to continue providing robust cash inflows at the Group level. The mobile business is highly likely to turn profitable in 2025, with its investment peak behind it.
Rakuten Group is currently in a deleveraging phase, with a manageable leverage level. As its businesses develop, the group’s credit risk is expected to become increasingly controllable.
We believe Rakuten Group’s credit risk is well-manageable over the short- to medium-term. Investors could consider its 2027 or 2029 USD bonds, with yield to maturity of 6.3% and 7.6% respectively, which are worth investors’ attention.
Declaration: For specific disclosure, at the time of publication of this report, IFPL (via its connected and associated entities) holds position in RAKUTN 11.250% 15Feb2027 Corp (USD) and the analyst who produced this report hold a NIL position in the abovementioned securities.


