Highlights:
- Shriram
Finance is primarily engaged in the provision of financial services,
including asset securitization, commercial lending and financing services, with
an AUM of Rs. 2.1 trillion.
- The company’s business model is to provide loans and earn interest margins. The overall operating performance was solid, with moderate growth momentum. The net interest margin is widening. The overall risk management is at a satisfactory level, and it does not aggressively increase its leverage and debt.
- The yield to maturity of the company's 2025 and 2027 bonds is about 6.3%, which has a certain investment value.
Shriram Finance is primarily engaged in the provision of financial services, including asset securitization, commercial lending and financing services to local SMEs. The company is currently listed on National Stock Exchange of India (Stock Code: SRTRANSFIN.IN), with a current market capitalisation of approximately Rs. 871.3 billion (equivalent to approximately USD 10.46 billion).
Shriram Finance, which was formed through the merger of Shriram Transport Finance and Shriram City Union Finance in 2022, is currently India's largest local non-banking financial company (NBFC), with an AUM of Rs. 2.1 trillion.
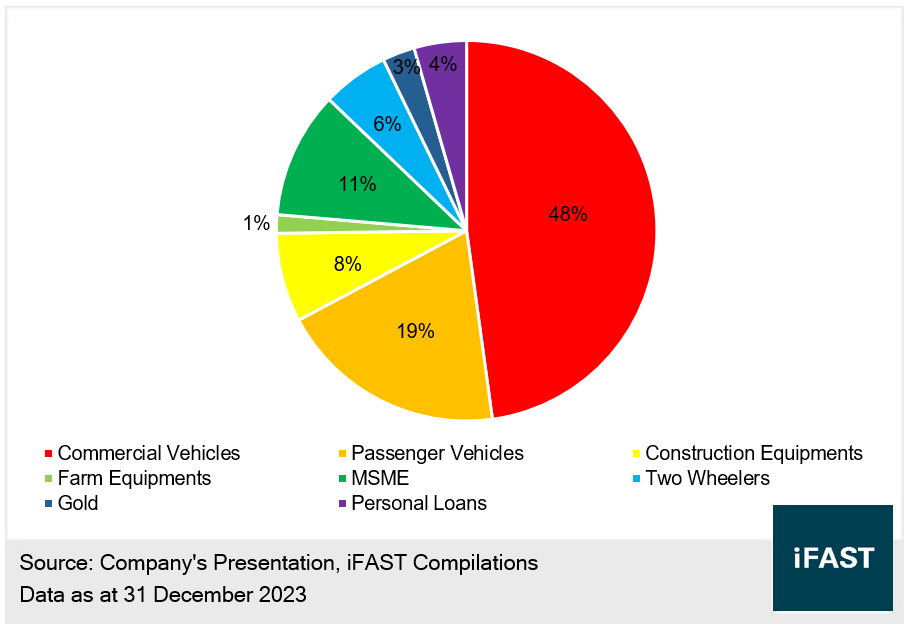
Shriram Finance offers its customers a wide range of financing solutions including Commercial Vehicle Loans, Passenger Vehicle Loans, Construction Equipment Loans, Farm Equipment Loans, Micro, Small and Medium Enterprises (MSMEs) Loans, Two-Wheeler Loans, Gold Loans and Personal Loans. Among these loans, commercial vehicle loans and passenger vehicle loans are the most important to the company, together accounting for about 68% of its total AUM (see Chart 1).
Chart 1: AUM Breakdown
Solid Operating Performance and Widening Net Interest Margin
Shriram Finance's business model is to provide loans and earn interest margins. The company has up to 95% of revenues coming from interest income. Its business model is simpler than traditional banks. We only need to focus on analyzing its lending business to understand the fundamentals and operations.
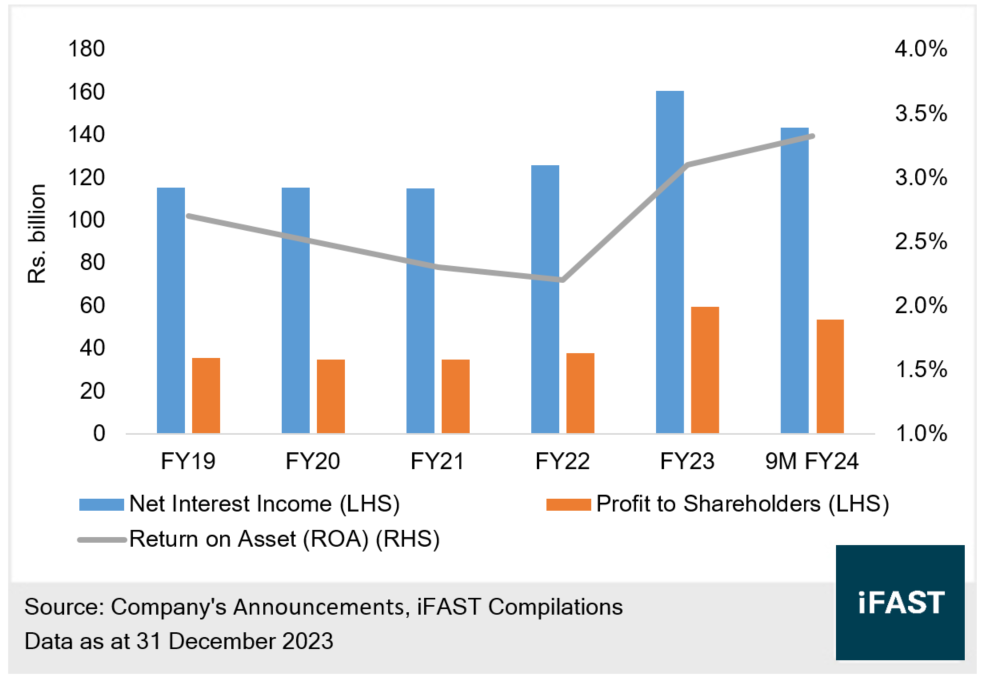
From April 2024 to December 2024 (the first nine months of FY2024), Shriram Finance’s net interest income was Rs. 143.5 billion, increased by 14.6% YoY. The net profit attributable to shareholders for the same period increased by 13.6% YoY to Rs. 53.8 billion. The return on assets (ROA) was maintained at a level of around 3.3%. The overall operating performance was solid, with moderate growth momentum.
Chart 2: Shriram Finance’s Net Interest Income, Net Profit to Shareholders and Return on Asset (ROA)
To evaluate Shriram Finance's profitability, we can take references from its net interest margin and net interest spread. The net interest margin is used to estimate capital efficiency. The net interest spread is used to measure the difference between the company’s cost of borrowing and investment yield.
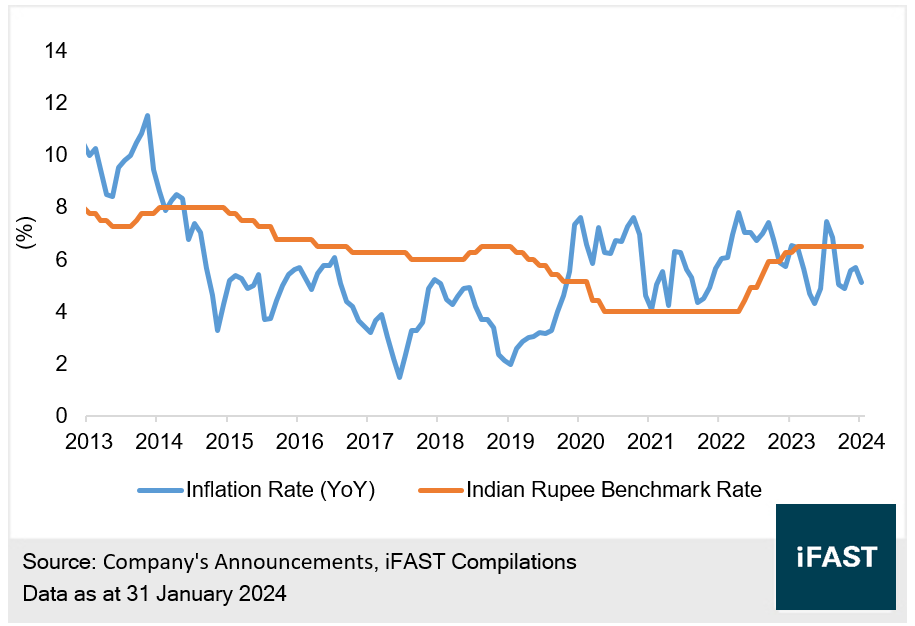
As a result of India's significant rate cut during 2020 due to COVID-19 (see Chart 4), the Indian central bank lowered the interest rate from 5.2% to 4.0%, which indirectly led to record lows in both the company's FY21 (April 2020 to March 2021) net interest margin and net interest spread (see Chart 3).
However, as shown in Chart 4, the company's net interest margin and net interest spread are showing signs of widening, given the rate hike by the Indian central bank to the current level of 6.5% in response to inflation control and the demand for commercial lending driven by the decent growth in the local economy. We expect these trends to continue. It is unlikely that the central bank will significantly cut rates to near the 4.0% level seen during the COVID-19. This should keep the ROA, net interest margin and net interest spread at a favourable level.
Chart 3: Shriram’s Net Interest Margin and Net Interest Spread
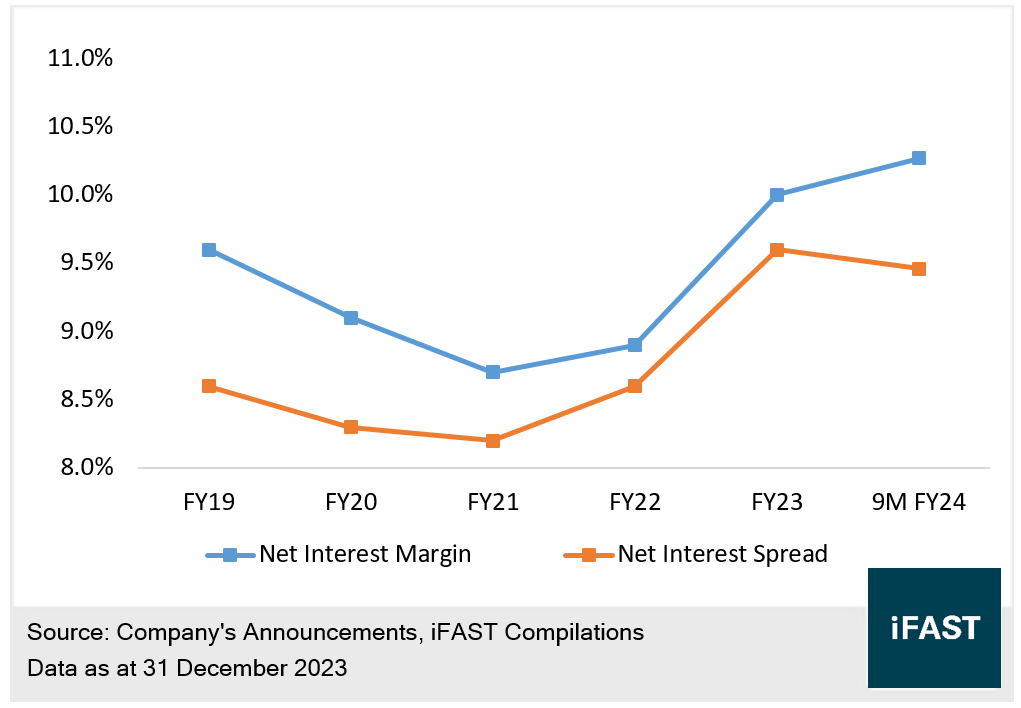
Chart 4: India Benchmark and Inflation Rate
Overall Risk Management is at a Satisfactory Level; Did not Aggressively Increase the Leverage
About the credit profile, as shown in Table 1, Shriram Finance's total assets are around Rs. 2.27 trillion. The asset size continues to grow. The Tier 1 capital ratio and total capital adequacy ratio were 21.4% and 23.0% respectively. The total capital adequacy ratio is well above the regulatory requirement of 15%.
In addition, Shriram Finance's net stage 3 ratio declined to 2.7%, reflecting a decline in the non-performing ratio. Meanwhile, the provision for non-performing loans was adequate. The overall risk management is at a satisfactory level.
Shriram Finance's interest coverage ratio is above 2 times for a long period, which is a decent level for a non-banking financial company. In addition, its leverage ratio is under control at 4.8 times, reflecting that the company did not aggressively increase its leverage and debt.
Table 1: Shriram Finance’s Credit Indicators
|
Mar 22 |
Mar 23 |
Dec 23 |
|
|
Total Asset (Rs. Billion) |
1,421.1 |
2,036.6 |
2,272.5 |
|
Tier 1 Capital Ratio (%) |
24.3% |
21.2% |
21.4% |
|
Total Capital Adequacy Ratio (%) |
25.9% |
22.6% |
23.0% |
|
Net Stage 3 Ratio (%) (= Net Stage 3 Non-Performing Loan To Loan Value) |
3.7% |
3.2% |
2.7% |
|
Stage 3 Coverage Ratio (%) |
54.7% |
50.1% |
53.4% |
|
Interest Coverage Ratio (times) |
2.0x |
2.4x |
2.3x |
|
Leverage Ratio (times) = (Total Asset / Total Equity) |
5.5x |
4.7x |
4.8x |
|
Sources: Company’s Announcements, iFAST Compilations Data as at 31 December 2023 |
|||
At the same time, most of the loans offered by Shriram Finance are secured loans. Even if the loan default rate subsequently rises significantly due to an economic downturn or any other reason, the company is in a position to repossess the loan collaterals and sell them to mitigate the losses. Hence, we believe that the operational and credit risks are manageable.
The Bond has a Yield to Maturity of around 6.3%, which has a Certain Investment Value
Currently, Shriram Finance’s issuer credit rating is BB / BB (S&P / Fitch), belonging to the non-investment grade level.
With Shriram Finance’s strong operating performance and credit profile and most of the loans being collateralized, the bond default risk is low. As shown in Table 1, the yield to maturity of the company's 2025 and 2027 bonds is about 6.3%, which has a certain investment value.
Table 2: Shriram Finance’s USD Bonds
|
Bond Name |
Years To Maturity |
Ask Price (Investors Buy) |
YTM (%) |
|
1.4 |
97.1 |
6.3% |
|
| SHFLIN 6.625% 22Apr2027 Corp (USD) | 3.1 |
100.8 |
6.5% |
|
Source: Bondsupermart Data as of 8 March 2024 |
|||
Since Shriram Finance is not a bank or an insurance company, its bonds do not have a loss absorption feature. The bonds are the same as bonds issued by normal corporations. Therefore, Shriram Finance bonds could have certain advantages in terms of features over bonds issued by other financial institutions.
Related Risks
Shriram Finance's loan collaterals mainly consist of commercial vehicles and passenger vehicles. Their values could change and decline over time. In the event of a number of loan defaults, the company would need to dispose of the collateral and recycle the funds, which could mean a large loss to be taken. This would affect its credit fundamentals.
Shriram Finance's operating performance is primarily driven by loan demand, which is dependent on the performance of the economy, and net interest margin, which is influenced by the monetary policy of India. Both are affected by the macro environment. If there is a lack of growth momentum or if the lower inflation results in a lower interest rate, these could have a negative impact on the company, in turn affecting the company’s overall solvency.
Conclusion
Shriram Finance is primarily engaged in the provision of financial services, including asset securitization, commercial lending and financing services, with an AUM of Rs. 2.1 trillion.
The company’s business model is to provide loans and earn interest margins. The overall operating performance was solid, with moderate growth momentum. The net interest margin is widening. The overall risk management is at a satisfactory level, and it does not aggressively increase its leverage and debt.
The yield to maturity of the company's 2025 and 2027 bonds is about 6.3%, which has a certain investment value.
For specific disclosure, at the time of publication of this report, IFPL (via its connected and associated entities) and the analyst who produced this report hold a NIL position in the abovementioned securities.
Our podcast series, Yield Hunters, is available on Spotify, iTunes Podcasts and Google Podcasts. We share our thoughts on new bond issues and hold discussions on
the fixed income space. Listen to our latest episode below and follow us!