UK bank instruments are some of the best choices for GBP denominated investments. Lenders are set to report better net interest margins that coincide with higher bond yields. Central banks including the Bank of England (“BoE”) are determined to keep interest rates low in spite of falling government bond prices.
The UK Prime Minister’s plan to fully reopen the economy coupled with an accommodative monetary policy have helped to lift the economic outlook for the United Kingdom. The BoE now expects a slightly stronger rise in consumer spending and this would lead to an improvement in loan quality for banks.
Britain’s largest domestic lender, The Lloyds Banking Group is riding on the country’s economic recovery and will be expanding its wealth and insurance business to improve profitability. The lender recently announced earnings and will be making changes to its work arrangements as more employees work from home.
About the Lloyds Banking Group
Started in 1865, Lloyds Bank Plc expanded its footprint across the UK through a series of acquisitions. 130 years later in 1995, the Trustee Savings Banks Group merged with Lloyds Bank Plc to form Lloyds TSB Group plc. In 2000, the Lloyds TSB Group plc acquired Scottish Widows Limited and positioned itself to be one of the leading suppliers of long term savings products in the UK.
Fast forward to the Financial Crisis in 2008, the board of Lloyds TSB Group plc agreed to acquire HBOS with the support of the UK government. HBOS is a company that was formed from the merger of Halifax plc and the Bank of Scotland plc. The Bank of Scotland is Scotland’s first and oldest bank while Halifax plc has an operating history dating back to 1852. The resulting enlarged entity was then renamed The Lloyds Banking Group plc.
Credit quality deteriorated quickly in 2009 and the UK government had to acquire a 43.4% stake in the group to bail out the bank. In the followings years thereafter, the UK government gradually sold its shares between September 2013 and May 2017, returning The Lloyds Banking Group to 100% private ownership. As of its 2020 annual report, the two largest shareholders are BlackRock, Inc. (5.14%) and Harris Associates L.P. (5.00%).
With effect from 1 Jan 19, the UK government imposed ring-fencing rules on banks to separate their current and savings accounts from higher risk activities in other parts of the business like investment banking. In 2018, the Lloyds Banking Group established Lloyds Bank Corporate Markets plc as a non-ringfenced company. Meanwhile, Lloyds Bank plc (the current principal operating subsidiary), HBOS plc and Bank of Scotland plc form the new ring-fenced banks within the group. The other companies - Scottish Widows Group and LBG Equity Investments Limited constitute the insurance and equity arms of the group.
2020 financial performance
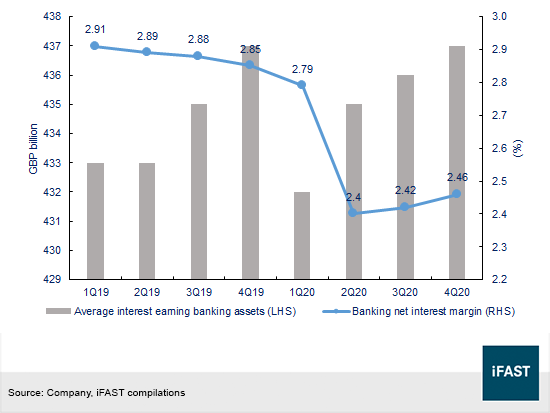
The Lloyds Banking Group recorded a drop in total income during 2020. Net interest income remained at nearly the same level at GBP 10.18 billion but interest income dropped from GBP 16.86 billion in 2019 to GBP 14.31 billion in 2020. Net interest margin (“NIM”) dropped to 2.40% in 2Q20 but staged a modest pickup in the second half of 2020, reaching 2.46% at 4Q20 (Figure 1). Management guided that NIM will be in excess of 240 basis points (“bps”) in 2021 underpinned by a strong first quarter performance but the bank may witness a bit of margin pressure in the second half of the year.
Figure 1: Net interest margin and average interest banking assets
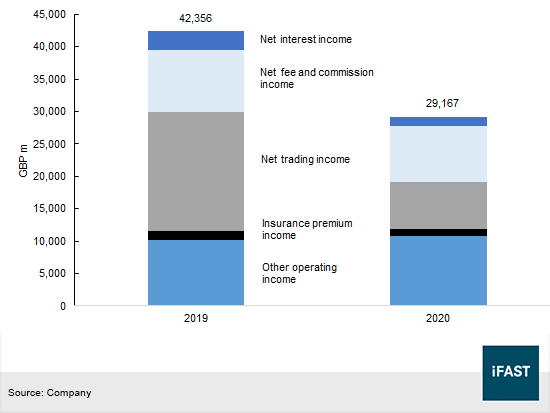
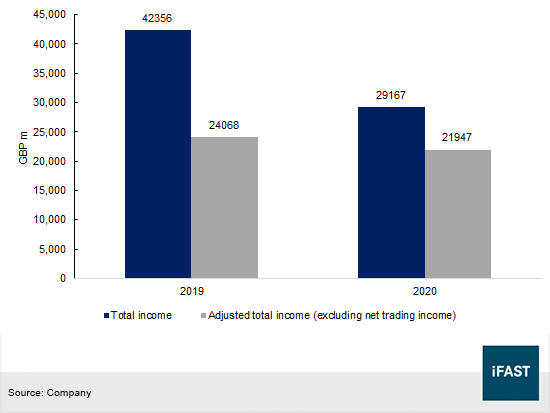
Total income fell 31.1% from GBP 42.36 billion in 2019 to GBP 29.17 billion and this was largely driven by lower net trading income (Figure 2).
Figure 2: Total income breakdown in 2019 and 2020
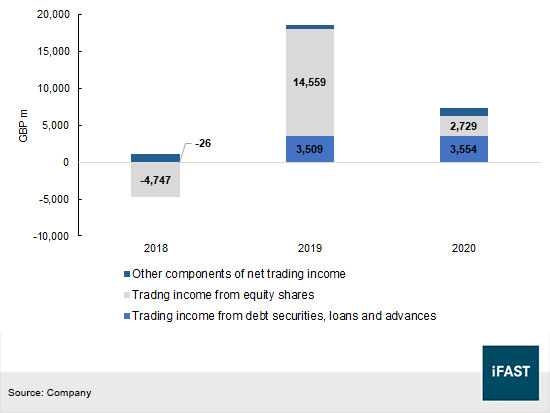
Trading income is generally unpredictable as the bank recorded a net trading loss of GBP 3,720m in 2018 but swung to a net trading profit of GBP 18,502m in 2019. Most of this income is made from trading in equity and debt securities (see Figure 3). Income from debt trading is more consistent and less volatile compared to equity trading as the bank made GBP 3,509m of income in 2019 and nearly the same amount of GBP 3,554m in 2020.
Figure 3: Net trading income breakdown from 2018 to 2019
Excluding net trading income, adjusted total income would have fallen by 8.8% year-on-year (Figure 4).
Figure 4: Adjusted total income
Insurance claims is a meaningful driver of total expenses within the bank’s consolidated income statement. When expressed as a percentage of total income, insurance claims accounted for 56.7% and 48.1% of total income in 2019 and 2020 respectively. Most of these claims are related to the payments of surrenders and claims of insurance contracts, as well as for the change in insurance and participating investment contracts (Table 1).
Table 1: Breakdown of expenses from insurance claims
|
|
2018 |
2019 |
2020 |
|
Total Insurance claims |
3,465 |
23,997 |
14,041 |
|
Claims and surrenders |
8,735 |
8,684 |
7,670 |
|
Change in insurance and participating investment contracts |
-4,565 |
12,633 |
4,590 |
|
Change in non-participating investment contracts |
-628 |
2,664 |
1,938 |
| Source: Company. Note: Figures in GBP m. Positive values denote income statement expenses | |||
As displayed in the table, changes in insurance and participating investment contracts are quite large and vary significantly every year. These are changes connected to liabilities for insurance contracts and participating investment contracts, which are calculated according to a prospective actuarial discounted cash flow methodology. Actuarial assumptions are dependent on a number of factors including interest rates, mortality rates and allowances for future policy costs.
Changes to actuarial assumptions affect the value of liabilities for insurance contracts and participating investment contracts. Table 2 illustrates the effects of the possible changes in key assumptions on 2020 profit before tax and equity.
Table 2: Life insurance sensitivity analysis
|
|
|
2020 |
|
|
Change in variable |
Increase / decrease in profit before tax (GBP m) |
Increase / decrease in equity (GBP m) |
|
|
Annuitant mortality |
5% reduction |
-333 |
-270 |
|
Change in lapse and policy surrender rates |
10% reduction |
70 |
57 |
|
Change in future policy maintenance and investment expense |
10% reduction |
332 |
269 |
|
Widening of credit default spreads |
0.25% addition |
-467 |
-378 |
|
Increase in illiquidity premia* |
0.10% addition |
219 |
178 |
| Source: Company. Note: *A higher illiquidity premium increases the annuity risk-free rate and results in improved earnings and equity | |||
Total operating expense dropped from GBP 12.7 billion in 2019 to GBP 9.8 billion and this was primarily because of a drop in payment protection insurance costs. The bank took a GBP 85m charge related to provisions for payment protection insurance in 2020, down from GBP 2,450m in 2019. Due to operational delays from the coronavirus outbreak, the administrative process had been extended and there was a limited number of complaints that were handled during the year.
Impairments, or provisions for loans and financial guarantees soared from GBP 1,296m to GBP 4,155m due to a weak economic outlook. Within its commercial banking segment, expected credit loss allowances increased to GBP 2,395m in 2020 from GBP 1,082m in 2019. Even though portfolio credit quality was supported by temporary measures from the UK government, the virus outbreak still hindered the recovery prospects for some of the customer loans.
Taking into account the abovementioned expenses, group profit before impairments and taxes dropped from GBP 4,393m in 2019 to GBP 1,226m in 2020. After deducting charges for impairments and taxes, the bank made GBP 1,387m of profit in 2020, and a profit of GBP 3,006 in 2019.
As a matter of fact, 2020 return on tangible equity dropped to 3.7% (2019: 7.8%), although there was a marked improvement in the fourth quarter as the return on tangible equity climbed to 7.2%. Management guided that return on tangible equity will be between 5% and 7% for 2021.
Table 3: Income statement variables between 2018 and 2020
|
|
2018 |
2019 |
2020 |
|
Total income |
22,091 |
42,356 |
29,167 |
|
Insurance claims |
-3,465 |
-23,997 |
-14,041 |
|
Regulatory provisions |
-1,350 |
-2,895 |
-464 |
|
Other operating expenses |
-10,379 |
-9,775 |
-9,281 |
|
Impairment |
-937 |
-1,296 |
-4,155 |
|
Taxes |
-1,454 |
-1,387 |
161 |
|
Profit for the year |
4,506 |
3,006 |
1,387 |
| Source: Company. Figures in GBP m. | |||
Credit quality of loans
Following the bank’s regulatory Pillar 3 report, credit portfolio exposures are mostly focused on the United Kingdom (2020: 88.7%), Europe (6.1%) and the US (2.6%). At the industry level shown in Table 4, credit exposures are broadly in personal mortgages (47.0%), followed by financial services (24.3%) and other personal loans (13.5%). The industry with the second largest percentage of defaulted exposures is the hotel, transport and distribution industry. Due to the ongoing pandemic, the passenger transport sector and hotel sectors have been considered the most vulnerable by management. Other sectors that were marked for further possible credit deterioration include automotives and commercial real estate.
Table 4: Credit exposure by industry type
|
|
Total exposure (GBP m) |
As a % of total exposure |
% of defaulted exposures |
|
Agriculture, forestry and fishing |
7,365 |
1.1% |
3.1% |
|
Energy and water supply |
4,708 |
0.7% |
0.0% |
|
Manufacturing |
14,804 |
2.1% |
3.4% |
|
Construction |
6,769 |
1.0% |
5.2% |
|
Transport, distribution and hotels |
23,931 |
3.4% |
7.8% |
|
Postal and communications |
1,718 |
0.2% |
0.2% |
|
Property companies |
25,685 |
3.7% |
2.1% |
|
Financial, business and other services |
169,251 |
24.3% |
0.3% |
|
Personal mortgages |
326,748 |
47.0% |
1.1% |
|
Other personal loans |
93,713 |
13.5% |
0.8% |
|
Lease financing |
4,651 |
0.7% |
0.2% |
|
Hire purchase |
16,168 |
2.3% |
1.6% |
| Source: Company, iFAST estimates, 31 Dec 20. | |||
With a significant portion of the portfolio in personal mortgages and in the UK, the credit quality of the bank is invariably linked to the UK housing market as well as the credit outlook for the sovereign issuer. On these two points, Knight Frank said that UK housing prices gained 8.5% in 2020 and prices appear to remain at an elevated level. However, Moody’s downgraded the UK’s credit rating to “Aa3” last year citing virus outbreak concerns and the country’s exit from the European Union.
Funding and liquidity
In spite of the structural headwinds brought about by the pandemic, Lloyds Banking Group registered GBP 73,257m of cash and balances at central banks in 2020, up from GBP 55,130m in 2019. Nearly 90% (GBP 66,248m) of the cash position is available for general corporate purposes and are not subject to any usage restrictions. During the year, the bank drew down GBP 13.7 billion from the Term Funding Scheme, which was established to allow lenders to access four-year funding rates at a level that is very close to the Bank Rate (March 2021: 0.1%).
According to the lender, the group maintained a sound funding and liquidity position underpinned by GBP 460.1 billion of customer deposits and GBP 31.5 billion of deposits from banks. Funded assets remained around GBP 458.4 billion at the end of 2020, most of which were made up of GBP 440.2 billion of loans and advances to customers. Meanwhile, liquid assets on the balance sheet amounted to GBP 147.0 billion, which are partly represented by GBP 61.3 billion of reverse repurchase agreements, GBP 66.8 billion of cash and GBP 26.9 billion of financial assets at fair value through other comprehensive income (Table 5)
Table 5: On balance sheet liquid assets
|
|
2020 (GBP billion) |
|
Reverse repurchase agreements |
61.3 |
|
Cash and balances at central banks |
66.8 |
|
Debt securities at amortized cost |
2.1 |
|
Financial assets at fair value through other comprehensive income |
26.9 |
|
Trading and fair value through profit and loss |
4.4 |
|
Repurchase agreements |
-14.5 |
|
Total on balance sheet LCR eligible liquid assets |
147.0 |
| Source: Company | |
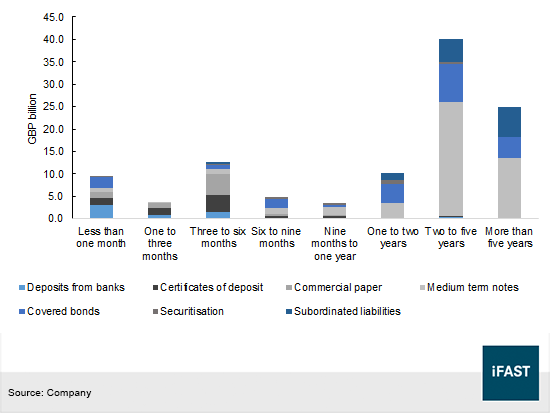
In respect to the bank’s wholesale funding, we observed that GBP 34.3 billion of instruments, ranging from commercial paper to medium term notes, are due in 2021 (Figure 5). Among these instruments, GBP 0.5 billion of subordinated liabilities are due in 2Q21, while GBP 1.4 billion of subordinated liabilities are maturing in 2022. There are GBP 5.2 billion medium term notes with maturities in 2021m, and collectively, GBP 10.1 billion of financial liabilities are due in 2022.
Figure 5: 2020 wholesale funding by residual maturity
Lloyds Banking Group continued to rely on capital markets for its funding requirements. The lender raised GBP 9.9 billion of long-term funding through its related entities, that included the issuance of EUR 309m subordinated notes due 2030 at a 4.5% coupon rate and GBP 1,309 billion of subordinated reset notes at a 2.707% fixed rate. However, the GBP 9.9 billion of raised capital was short of the bank’s guidance of GBP 10 – 15 billion as it was able to access a more cost effective channel through the Bank of England’s Term Funding Scheme.
As for its issuance plans for 2021, the group disclosed that it has no plans to launch any Additional Tier 1 (“AT1”) or Tier 2 instruments, but may issue ~GBP 5 billion through its holding company (Lloyds Banking Group) and ~GBP 2 billion through its operating company (Lloyds Bank Corporate Markets).
Capital position
The lender has a high Common Equity Tier 1 (“CET 1”) ratio of 16.2%, and is ranked second to Natwest Group, which is a major retail and commercial bank in the UK (Table 6). Of the four other competing banks listed in the table, three of them – HSBC Holdings Plc (“HSBC”), Barclays Plc (“Barclays”) and Standard Chartered Plc (“Standard Chartered”) together with Lloyds Banking Group are recognized as other systemically important institutions.
The bank has decent capital strength. Its UK leverage ratio of 5.8%, which is different from the Capital Requirements Regulation 2 (“CRR”) ratio due to the exclusion of certain regulatory capital (i.e. central bank claims and Bounce Back Loans), is close to the sector average of 5.7%.
Group Liquidity Coverage Ratio was 136%, the lowest among peers but still remained higher than the required minimum. Nonetheless, the Liquidity Coverage Ratio fell from 137% in 2019 to 136% due to higher volume of customer deposits and heightened derivative margin volatility.
Table 6: Key metrics across competitors as at 31 Dec 20
|
|
Barclays |
Lloyds |
Standard Chartered* |
Natwest Group |
HSBC* |
|
Total High Quality Liquid Assets |
258,198 |
141,747 |
162,019 |
119,655 |
677,900 |
|
Common Equity Tier 1 |
46,296 |
32,822 |
38,779 |
23,743 |
136,050 |
|
Tier 1 |
58,034 |
38,666 |
44,391 |
27,419 |
160,173 |
|
Total capital |
67,660 |
47,168 |
57,048 |
32,425 |
184,423 |
|
Risk-weighted assets |
306,203 |
202,747 |
268,834 |
135,331 |
857,520 |
|
Total assets |
1,349,514 |
871,269 |
789,050 |
799,491 |
2,984,164 |
|
CET 1 / total assets |
3.4% |
3.8% |
4.9% |
3.0% |
4.6% |
|
CET 1 ratio |
15.1% |
16.2% |
14.4% |
17.5% |
15.9% |
|
UK leverage ratio |
5.0% |
5.8% |
5.2% |
6.5% |
6.2% |
|
Liquidity Coverage Ratio |
162% |
136% |
146% |
147% |
139% |
| Source: Company filings, iFAST estimates. Note: Figures in GBP m. *Reporting currencies for Standard Chartered Bank and HSBC are in USD m. | |||||
CET 1 ratio increased to 16.2% from 13.8% in 2019. But this capital build of 242bps includes the revised capital treatment for intangible software assets of 51bps and the reversal of the full year 2019 ordinary dividend accrual of 83bps. Excluding the capital treatment for intangible software assets, the CET1 capital ratio would have been 15.7%.
Following the implementation of CRR, globally systemically important banks have become subject to the framework for minimum requirements for own funds and eligible liabilities (“MREL”). MREL is a minimum requirement for banks to maintain equity and eligible debt so that they can be ‘bailed in’ should a bank fail. The purpose of this requirement is to help ensure that when banks fail the resolution authority can use these financial resources to absorb losses and recapitalise the continuing business.
The Bank of England has implemented MREL through the Banking Act and a statement of policy, which requires UK banks to maintain a minimum amount of qualifying MREL instruments. The MREL transitional requirements after ordinary dividends for the Lloyds Banking Group, expressed as a percentage of risk-weighted assets was 36.4% (“MREL ratio”) at 31 Dec 20, exceeding the expected 2022 regulatory final requirements of 27.8%.
Relative valuation
Looking at the different USD and GBP bonds within the lender’s capital structure, we think that stable income seekers may consider certain Tier 2 and Additional Tier 1 (“AT1”) securities within the bank.
Lloyds Banking Group Plc is rated A3 (negative) / BBB+ (negative) / A+ (negative) by Moody’s / S&P / Fitch Ratings respectively. Lloyds Bank plc is rated A1 (stable) / A+ (negative) / A+ (negative) while Bank of Scotland is rated A1 (stable) / A (negative) / A+ (negative). In general, the negative outlooks from the rating agencies are related to the weakening credit profile of the United Kingdom as the lender has a predominant exposure to the UK economy.
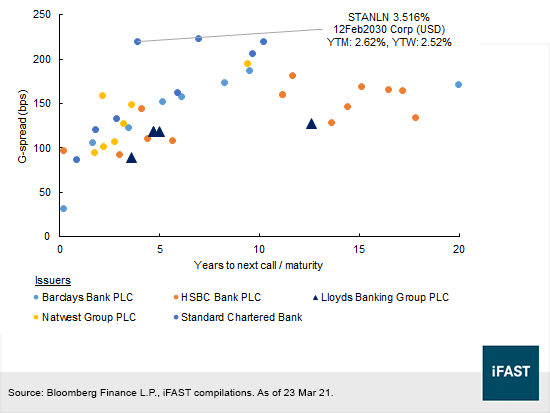
Within the universe of Basel III designated Tier 2 issues, we think that the bonds issued by entities within the Lloyds Banking Group plc are comparatively less attractive. Bonds issued by Lloyds Banking Group plc have tighter credit spreads (“G-spread”) over US Treasuries as seen in Figure 6 compared to other issuers.
Nonetheless, the STANLN 3.516% 12Feb2030 Corp (USD) would be the most attractive USD Tier 2 note with a G-spread of 219bps. The bond is rated Baa2 / BBB- / BBB+ by Moody’s / S&P / Fitch. On 12 Feb 25, the issuer Standard Chartered Plc has the option to redeem the bond at 100. If not redeemed on 12 Feb 25, the coupon resets to the sum of the prevailing 5-year Treasury rate and 185bps.
Figure 6: Relative valuation among USD Tier 2 issues
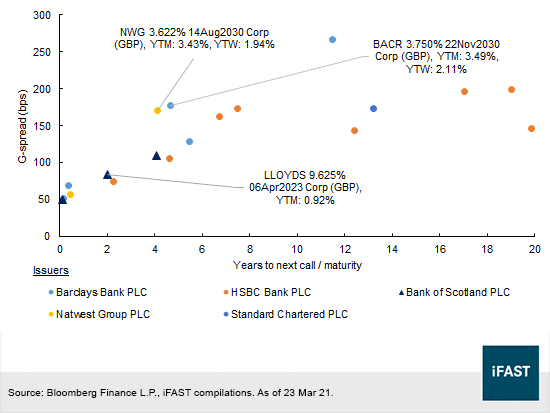
Using the same reasoning, we feel that the BACR 3.750% 22Nov2030 Corp (GBP), NWG 3.622% 14Aug2030 Corp (GBP) and LLOYDS 9.625% 06Apr2023 Corp (GBP) are the most appealing among GBP denominated Tier 2 bonds because of their high credit spreads. BACR 3.750% 22Nov2030 Corp (GBP) and NWG 3.622% 14Aug2030 Corp (GBP) are rated Baa3 / BB+ / BBB+ by Moody’s / S&P / Fitch, which is arguably two notches lower than LLOYDS 9.625% 06Apr2023 Corp (GBP), which is rated Baa1 / BBB / BBB+.
The yields to maturity (“YTM”) for the three bonds are 3.49%, 3.43% and 0.92% respectively. Corresponding yields to worst (“YTW”) are 2.11%, 1.94% and 0.92%. If not called on their first call dates, the coupons for the BACR 3.750% 22Nov2030 Corp (GBP) and NWG 3.622% 14Aug2030 Corp (GBP) are adjusted to the sum of their initial spreads and prevailing 5-year UK Gilts rate. The LLOYDS 9.625% 06Apr2023 Corp (GBP) is not callable but will mature in around two years on 6 Apr 23.
Figure 7: Relative valuation among GBP Tier 2 issues
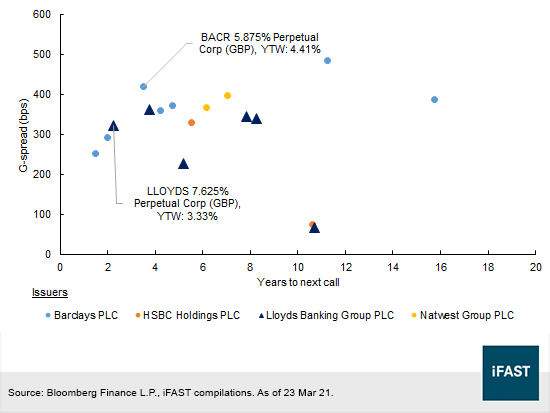
The BACR 5.875% Perpetual Corp (GBP) and the LLOYDS 7.625% Perpetual Corp (GBP) are the most attractively priced in the context of GBP denominated AT1 securities (Figure 8). The perps traded at YTWs of 4.41% (G-spread: 421bps) and 3.33% (G-spread: 322bps) respectively on 23 Mar 21.
BACR 5.875% Perpetual Corp (GBP) is callable on 15 Sep 24. If the issuer does not redeem the note, the coupon rate resets to the prevailing 5-year GBP Swap Offer Rate (“SOR”) + 491bps. BACR 5.875% Perpetual Corp (GBP) is rated Ba2 (hyb) / B+ / BBB- by Moody’s / S&P / Fitch.
LLOYDS 7.625% Perpetual Corp (GBP) is rated Baa3 (hyb) / BB- / BBB- by the same rating agencies. The 7.625% coupon resets to 5-year GBP SOR + 501bps if the note is not redeemed on the first call date on 27 Jun 23.
Figure 8: Relative Valuation among GBP AT1s
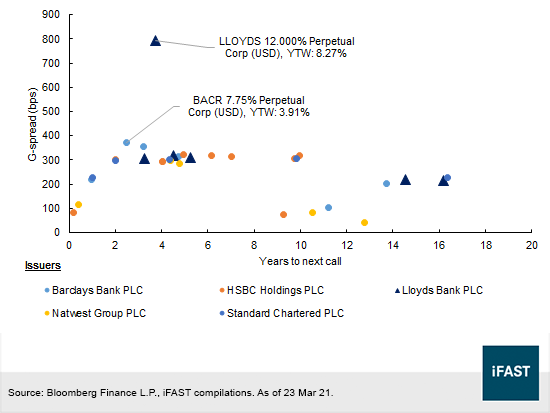
Comparing USD AT1s among UK banks, the BACR 7.75% Perpetual Corp (USD) traded at the highest G-spread of 421bps above US Treasuries and offers a decent yield to worst of 3.91%. The note is callable on 15 Sep 23 with a reset benchmark of the 5-year USD swap rate + 4.842%.
Referring to Figure 9, LLOYDS 12.000% Perpetual Corp (USD) traded at a yield to worst of 8.27%. If not called on 16 Dec 24, the distribution rate will reset to the 3m Libor rate (19 Mar 21: 0.20%) + 11.756%. The 3M SOFR will replace Libor soon and also traded around 0.16% on 23 Mar 21.
Noteholders were invited to tender their notes in March 2020 but only received offers of approximately USD 137m, thus reducing the outstanding principal to USD 1,863m. The perp is rated Baa3 (hyb) / BB+ / BBB- by Moody’s / S&P / Fitch.
LLOYDS 12.000% Perpetual Corp (USD) was issued at a time when the bank was restructuring its business and just received staid aid from the government. The high coupon rate may have seemed fair given the uncertain and developing situation at that time. As a reference, the LLOYDS 9.625% 06Apr2023 Corp (GBP) was trading at a yield to maturity of around 8% on 16 Dec 2009, which is the issue date for the LLOYDS 12% perp.
Even though the 12% perpetual note has a high yield to worst of 8.27%, investors should note that there is a chance of a perp redemption if a Regulatory Event occurs under Condition 7(d). The perp is currently designated as Additional Tier 1 capital under Capital Requirements Regulations but may not qualify as Tier 1 capital once CRR grandfathering ends this year. We are therefore underweight on the note considering that it is trading at a premium of 111.
Figure 9: Relative valuation among USD AT1s
All things considered, we think The Lloyds Banking Group has a stable funding and liquidity profile. The bank guided that earnings should improve this year compared to 2020 on the back of growing net interest margins and lower operating costs. On the healthcare front, the pace of vaccinations should keep the virus infection rate at bay, and would aid in the gradual easing of restrictions leading to an improvement to economic growth. The group has ample liquidity to meet financial liabilities and sufficient capital above regulatory limits. Among its outstanding fixed income notes, we think that investors may consider the LLOYDS 7.625% Perpetual Corp (GBP) and LLOYDS 9.625% 06Apr2023 Corp (GBP).
Declaration:
For specific disclosure, at the time of publication of this report, IFPL (via its connected and associated entities) and the analyst who produced this report hold a NIL position in the abovementioned securities.
Our podcast series, Yield Hunters, is available on Spotify and iTunes Podcasts and Google Podcasts. We share our thoughts on new bond issues and hold discussions on the fixed income space. Listen to our episode on banks below and follow us!