Summary
- Production line utilisation fell to 30% in 2025 (2024: 80%) due to the deferment in NEOM Project. Utilisation is expected to gradually recover and return to full capacity by mid-2026, supported by new projects arising from diversification efforts.
- As of October 2025, contracts secured/in finalisation stood at approximately RM1.2 billion, with projects across Sweden, UK, Australia and Greenland. There's also approximately RM1.8 billion in tender.
- 1H25 revenue declined sharply to RM242.6 million (1H24: RM1.5billion) due to NEOM deferment. Nevertheless, operating margin held well at 18.5%. Interest coverage ratio dipped to 2.4 times in 1H25 but still at a level that is capable of covering the finance cost.
- In our view, 2026 will be the year where SIBS ‘cleanses’ its orderbook from NEOM impact and recalibrate its orderbook and financial health, gradually realising the benefits of a more diversified clientele.
- We recommend SIBS 4Y to investors who are comfortable with SIBS nature as a growing company, which likely to have higher gearing in this stage of time to expand its addressable market.
Introduction
SIBS Sdn Bhd intends to issue a 4Y bond at initial price guidance (IPG) of 5.60%, with potential selldown to 5.50%.
The group is a modular housing manufacturer utilising the Industrial Building System (IBS). It is likened to building a “LEGO” house in a factory, whereby fully constructed modules are shipped to housing sites for on-site assembly.
Impact from the deferment of NEOM project
New projects undertaken by SIBS continue to command double-digit margins, in line with management’s targets. FY2024 was largely driven by the sizeable NEOM project in Saudi Arabia.
FY25 was a transition year as the group actively diversified its geographical project exposure, partly being afflicted by the leadership change within the NEOM project in May 2025, which led to indefinite deferment of future phases.
Effective 2026, any resumption in NEOM projects is regarded by management as upside contract rather than core driver of future revenue, where the team would assess and prioritise existing clients admitted first.
Looking ahead, FY2026 is expected to reflect the benefits of SIBS’ diversification strategy, with earnings contributions from new markets gradually materialising.
Utilisation rate impacted, while contracts secured/in finalisation, as well as tender remain positive
Correspondingly, production line utilisation fell to 30% in 2025 (2024: 80%) due to the deferment in NEOM Project. Utilisation is expected to gradually recover and return to full capacity by mid- 2026, supported by new projects arising from diversification efforts.
As of October 2025, contracts secured/in finalisation stood at approximately RM1.2 billion, with projects across Sweden, UK, Australia and Greenland. SIBS business model emphasises strategic partnerships with local know-how construction companies, enabling the group to mitigate on-site risks while focusing on its edge to deliver cost-effective modules.
A glimpse into the current contracts secured/in finalisation shows a modest concentration in Australia’s business, but the group is looking to seek more orders from the likes of Singapore, Malaysia and the Middle East into the picture.
Table 1: Contracts secured/in finalisation dated end October 2025
| Country |
Contract sum (RM mil) |
Order value |
| Sweden |
235 |
19% |
| UK |
151 |
12% |
| Australia |
775 |
64% |
| Greenland |
51 |
4% |
| Total |
1,212 |
|
| Source: SIBS,
MARC, iFAST compilations. Data as of 31 October 2025. |
In addition, SIBS has approximately RM1.8 billion in tendering pipeline. Notably, the pipeline includes new markets such as Singapore and Malaysia.
The group has also recently partnered with LINQ Modular, which holds a modular construction licence issued by the Dubai Municipality. This collaboration enables SIBS to scale its Middle East presence independently of its previous NEOM association.
Table 2: Tendering pipeline as at 26 January 2026
|
Country
|
Estimated contract sum (RM mil)
|
|
Sweden
|
879
|
|
United Kingdom
|
193
|
|
Australia
|
78
|
|
Singapore
|
97
|
|
Malaysia
|
586
|
|
|
1,833
|
|
Source:
SIBS, MARC, iFAST compilations. Data as of 26 January 2026.
|
Deferment in NEOM project dragged revenue and interest coverage ratio
1H25 revenue declined sharply to RM242.6 million (1H24: RM1.5billion) due to NEOM deferment, which significant production capacity had been allocated previously. Nevertheless, operating margin held well at 18.5%.
On the other hand, interest coverage ratio dipped to 2.4 times in 1H25 as a result of lower operating profit, but still at a level that is capable of covering the finance cost.
We view this as a temporary hiccup, where earnings recovery is expected as SIBS transitions away from NEOM project, alongside improved plant utilisation.
Table 3: SIBS revenue trend
|
RM
(mil)
|
FY22
|
FY23
|
FY24
|
1H24
|
1H25
|
|
Revenue
|
305
|
797
|
2,440
|
1,539
|
243
|
|
Gross
profit margin
|
13%
|
21%
|
12%
|
27%
|
29%
|
|
Operating
profit
|
25
|
137
|
227
|
399
|
45
|
|
Operating
profit margin
|
8%
|
17%
|
9%
|
26%
|
19%
|
|
Net
profit margin
|
5%
|
17%
|
8%
|
25%
|
11%
|
|
Interest
coverage ratio
|
13.6
|
15.4
|
10.0
|
40.8
|
2.4
|
|
Source:
SIBS Sdn Bhd, iFAST compilations. Data as of 31 October 2025.
|
Elevated gearing ratio mitigated by lower capex going forward
The group saw a higher gearing ratio in 1H25, as SIBS invested in few fronts.
Firstly, resources are invested into adapting and certifying building system for multiple new markets, including compliance with local building codes, fire and safety regulations, technical standards and more, which are prerequisites for winning contracts in new jurisdictions.
Secondly, funds are also used to build group’s international business capabilities, including the hiring of a head of business. This alongside adapted building system is paying off in the form of potential new venture markets like Singapore and Malaysia.
Thirdly, there is a notable increase in current borrowings (from RM122mil in 1H24 to RM419mil in 1H25), due to the increase in working capital requirements ahead of cash collection, which we opine is a timing-related effect rather than a change in group’s risk profile.
We view collection risk to be low as the increase in receivables are due to intercompany receivables and pending receivables from NEOM, where NEOM is backed by Saudi Arabia’s Public Investment Fund, one of the world's largest sovereign wealth funds.
With these developments, debt to equity ratio has increased from 114% in FY24 to 127% in 1H25. Nonetheless, management has indicated that they are targeting a DE ratio of 80% by end of 2028, following the front-loading of investments to capture opportunities in different market jurisdiction.
Table 4: SIBS leverage ratio
|
|
FY22
|
FY23
|
FY24
|
1H24
|
1H25
|
|
DE
ratio
|
210%
|
63%
|
114%
|
35%
|
127%
|
|
Net DE
ratio
|
198%
|
42%
|
101%
|
15%
|
114%
|
|
Debt
to EBIT (times)
|
8.10
|
1.24
|
2.53
|
0.58
|
17.86
|
|
Source:
SIBS Sdn Bhd, iFAST compilations. Data as of 31 October 2025.
|
Given all these, we believe SIBS gearing level will improve overtime, where early investments translate into projects and ultimately cash flow, while acknowledging the higher gearing ratio SIBS currently has.
Importantly, capital expenditure is expected to decline to below RM20 million annually for 2026–2028, as Plant 3 expansion is on hold until demand visibility improves. This should support gradual deleveraging.
Bond maturity profile well spread
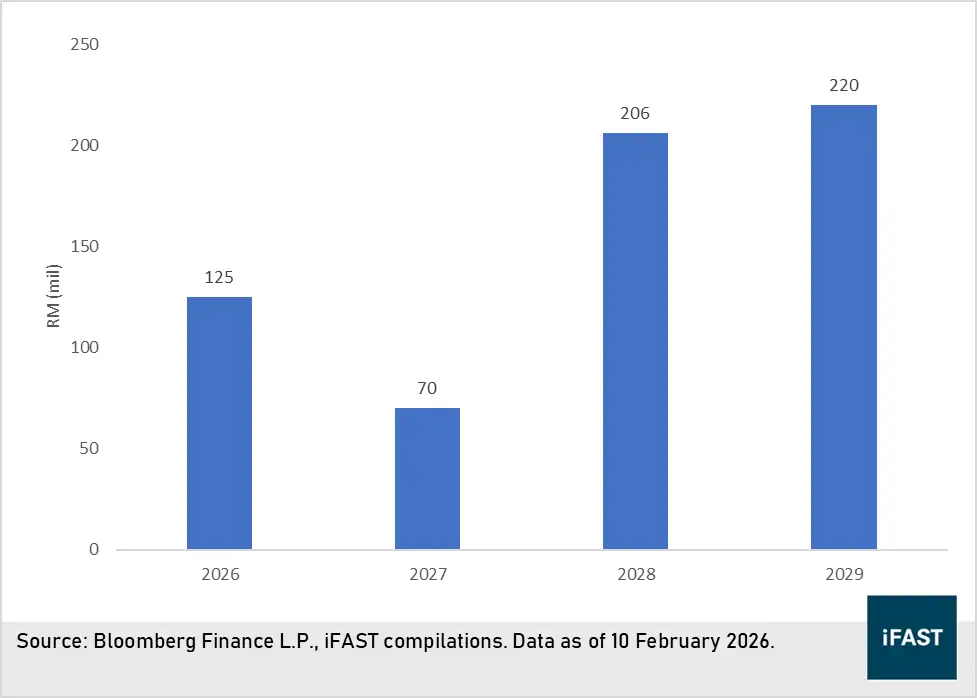
In terms of bond distribution/maturity wall, it is well dispersed between 2026 to 2029, mitigating repayment concentration risk in any certain year.
The upcoming 4-year issuance is primarily to refinance the RM125 million bond maturing in March 2026.
As particularly for the larger 2028 and 2029 bond maturities, there is the avenue of potential capital injection from new shareholder and future internally generated funds to repay it, not forgetting the room for refinancing.
Chart 1: Bond redemption schedule
Risk
From business perspective, any disruptions in international sea transportation routes could hinder the delivery of its modules to clients’ sites. Also, a slowdown in international property market might affect SIBS’ odds of replenishing its orderbook.
In addition, while SIBS creates job opportunities for Malaysian workers, it subsequently reduces job opportunities in its clients' home countries. This dynamic might prompt foreign governments to impose special levy on SIBS in the future to protect their domestic workforce.
Recommendation
2025 was a challenging year for SIBS as it was afflicted by the deferment of NEOM project, which pressured its revenue and interest coverage adversely.
In our view, 2026 will be the year where SIBS ‘cleanses’ its orderbook from NEOM impact and recalibrate its orderbook and financial health, gradually realising the benefits of a more diversified clientele.
Coupled with SIBS’s competitive edge in global reach capacity, we believe that SIBS will continue to sustain double-digit margin by producing modules locally in Malaysia and supplying it abroad.
The bond is rated as AA- by MARC and offers a higher yield relative to similarly rated peers, reflecting the yield premium for its current higher leverage, temporary earnings volatility and its growth stage risk profile.
Table 5: Comparison against similarly rated bonds
|
Bond
|
Issuer
|
MARC/RAM
|
Years to maturity
|
Yield to maturity
|
|
SIBSAB 5.600% Feb2030 Corp (MYR)*
|
SIBS Sdn Bhd
|
AA- / -
|
4Y*
|
5.50%*
(likely issue above par)
|
|
MLKMK 6.150% 17Dec2030 Corp (MYR)
|
Malakoff Power Bhd
|
AA- / -
|
4Y10M
|
3.71%
|
|
UEMSMK 5.090% 27Sep2030 Corp (MYR)
|
UEM Sunrise Bhd
|
AA- / -
|
4Y7M
|
3.69%
|
|
GAMMK 4.310% 20Jun2030 Corp (MYR)
|
Gamuda Berhad
|
- / AA3
|
4Y4M
|
3.57%
|
|
*Yet to be
issued. Potential selldown to 5.50%.
AA- & AA3 are in the same ranking standard, from different rating
agencies.
Source: Bondsupermart, iFAST compilations. Data as of 10 February 2026.
|
With that said, we recommend SIBS 4Y to investors who are comfortable with SIBS nature as a growing company, which likely to have higher gearing in this stage of time to expand its addressable market.
Previous articles:
Declaration: For specific disclosure, at the time of publication of this report, IFPL (via its connected and associated entities) holds a position in SIBSAB 5.450% 26Feb2027 Corp (MYR) and the analyst who produced this report hold a NIL position in the abovementioned securities.