Vale S.A. (Vale) is a Brazilian mining giant with a diversified commodities portfolio, dominated by iron ore and complemented by other metals like copper and nickel. In this article, we review Vale’s recent 9M25 (ended 30 Sep 2025) results and share our views on some of its bonds.
About Vale S.A. and its bonds
(Unless otherwise stated, all figures are in USD [$] or Brazilian [R$], and percentage changes are year-on-year [YoY]).
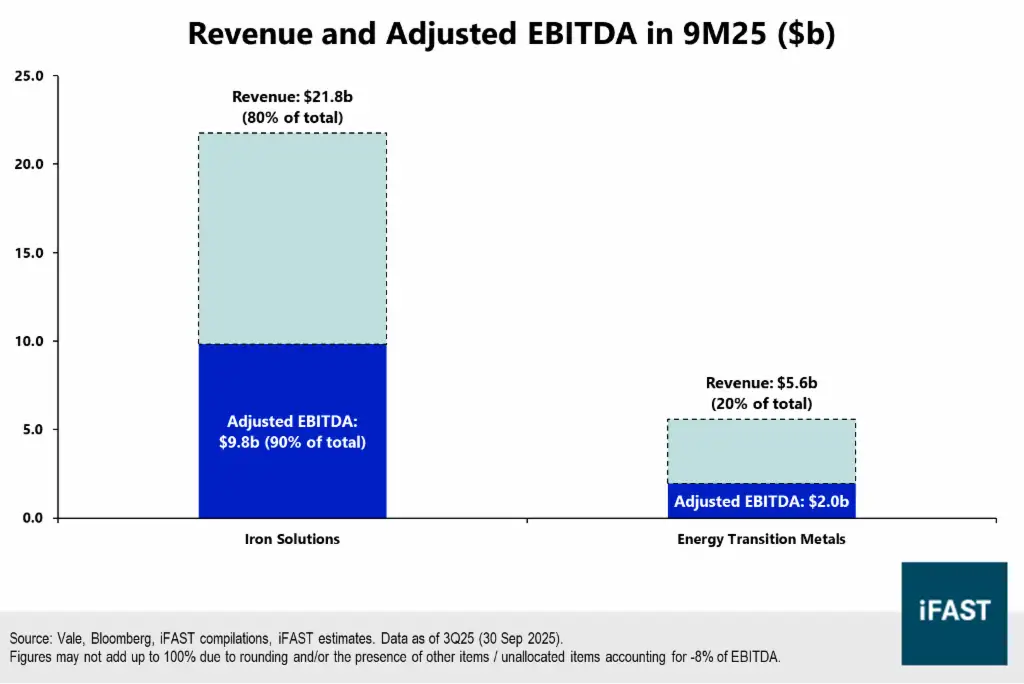
Vale has two principal business segments: ‘Iron Solutions’ (including iron ore and iron ore pellets) and ‘Energy Transition Metals’ (notably copper and nickel) (Chart 1). Iron Solutions has historically been Vale’s core revenue and earnings driver and remains the segment for which the company is best known. Meanwhile, Energy Transition Metals reflects the company’s strategic efforts to diversify its revenue base, especially given the inherently cyclical nature of commodity prices.
Vale has debt issued at the parent level and through key subsidiaries, including Vale Overseas Ltd (its primary USD-bond financing vehicle) and Vale Canada Ltd (operating subsidiary for Canadian assets, largely focused on non-iron ore production).
Chart 1: Breakdown of Vale’s business segments
Stable performance despite lower iron ore prices
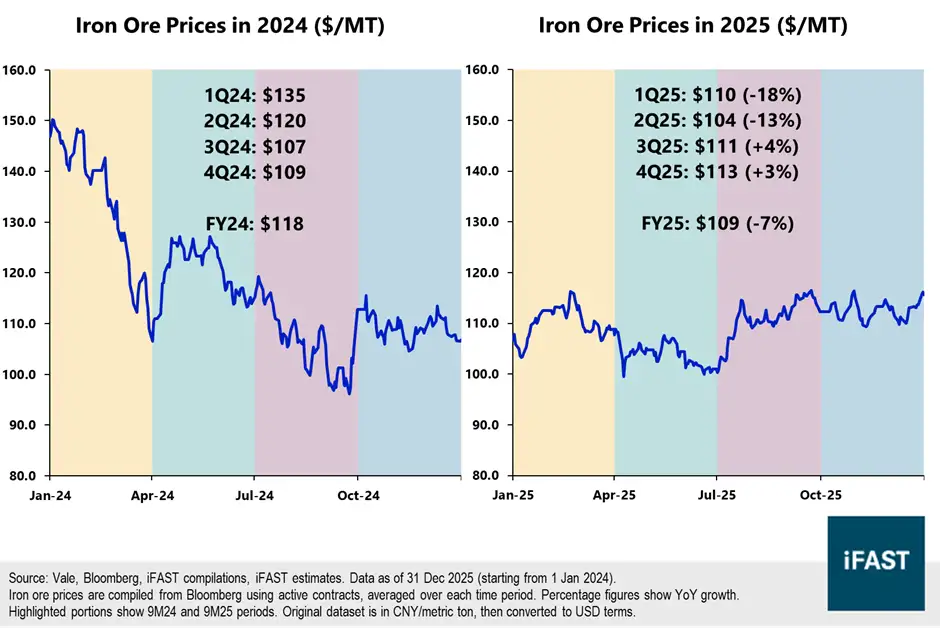
Vale’s 9M25 revenues came in at a decent $27.3b, marginally lower (-2% YoY) than the $27.9b recorded in 9M24. As is typical for commodity producers, Vale’s revenues are highly sensitive to movements in underlying commodity prices. The softer revenue outcome in 9M25 reflected the decline in iron ore prices over the period, underscoring the strong link between commodity prices and top-line performance (Table 1).
Despite this, Vale held firm on its cost discipline. Cost of sales increased by just +1% as management continued to focus on operational efficiencies. This helped to cushion the impact of lower iron ore prices on profitability, with adjusted EBITDA remaining decent at $10.8b (-2%).
We note that reported operating profits declined sharply by -34% to $6.6b. However, this was largely due to the absence of asset disposal gains that had boosted operating profits in the previous year (2024) (Chart 2). Excluding these one-off items, we think Vale’s core operating performance remained stable despite a challenging pricing environment, as observed through adjusted EBITDA previously.
Looking ahead, we like that Vale’s underlying earnings profile remains fundamentally robust. Coupled with iron ore prices having stabilised more recently in 4Q25 (Chart 3), we think this could bode well for Vale’s upcoming results.
Table 1: Changes in Vale’s revenues & profits mirrored iron ore pricing
| Metrics | 9M24 | 9M25 | Yearly Comp |
| Net Operating Revenue | 27,932 | 27,343 | -2% |
| Gross Profit | 9,935 | 9,175 | -8% |
| Operating Income | 9,998 | 6,594 | -34% |
| Net Income / Loss (from continuing operations) | 6,847 | 6,226 | -9% |
| Adjusted EBITDA | 11,046 | 10,870 | -2% |
| Iron Ore Prices ($/MT) | 120.4 | 108.3 | -10% |
| Source:
Vale, Bloomberg, iFAST compilations, iFAST estimates. Data as of 3Q25 (30 Sep
2025). Iron ore prices are compiled from Bloomberg using active contracts, averaged over each time period. Original dataset is in CNY/metric ton, then converted to USD terms. |
|||
Chart 2: Vale’s operating profits were adversely affected by one-off items, but core performance remained strong
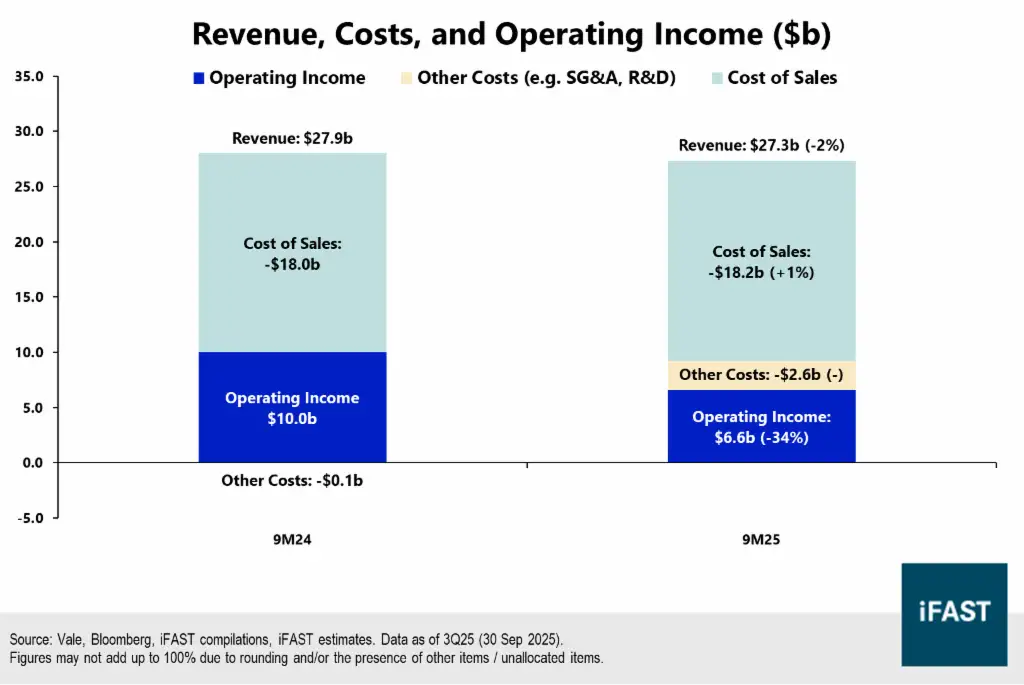
Chart 3: Iron ore prices have recently stabilised, lending further support to upcoming results
Optimistic outlook amidst market headwinds
Management recently trimmed its iron ore volume guidance slightly to 335 – 345 metric tonnes (Mt) in FY26, implying flattish growth from FY25’s 336 Mt. This cautious volume guidance reflects two factors: (i) uncertainty over global iron ore and steel demand, with potential weakness in China having to be offset by growth elsewhere (e.g. Middle East & Asia); and (ii) rising supply from new projects like Simandou (owned by Vale’s rivals). Given these headwinds, we do not rule out continued pricing pressures.
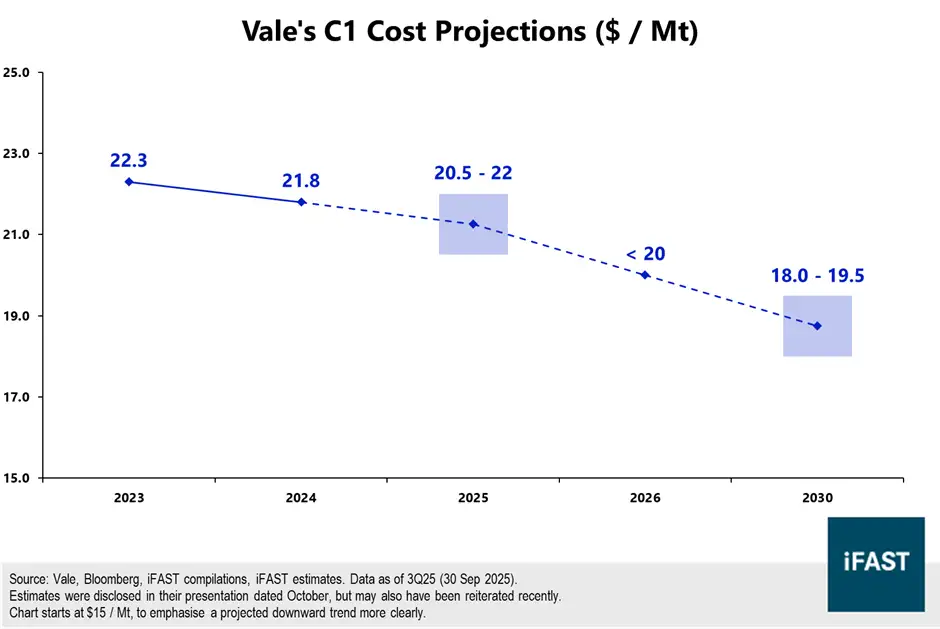
In response, management has intensified its focus on cost controls to defend margins. C1 costs (per metric tonne) fell to $20.7 in 3Q25 (2Q25: $22.2) and management expects further improvements: guiding to $20 - $21.50 in FY26, and $18 - $19.50 by FY30 (Chart 4). These cost reductions are driven primarily by (i) operational efficiency programmes to improve margins and inventory turnover; and (ii) capex discipline by being more selective about new projects, prioritising those with clearer return outlooks.
(Note: C1 costs primarily refer to the direct costs of producing iron ore (e.g. mining costs) and can be used to estimate operational efficiency. They do not include freight and overseas distribution costs (among others), which are instead reflected in all-in costs.)
In addition, management also believes that Vale's scale allows it to offer a wider range of iron-related products and blends, providing flexibility to prioritise higher-margin products depending on prevailing market demand. These initiatives could help protect Vale’s margins and profitability even in an environment of softer iron ore prices.
Apart from iron ore, copper is emerging as an increasingly attractive growth opportunity for Vale. Copper prices have risen sharply amid growing structural demand, originally driven by electrification trends (e.g. EV adoption), and more recently by its critical role in the global AI infrastructure buildout. Vale management has expressed plans to double its copper production from now (382 kt a year) to 2035 (~700 kt a year), helped by the ramp-up of multiple mining projects. We think copper could become a more meaningful contributor to Vale’s earnings over time, enhancing diversification and providing another source of upside to group profitability.
Chart 4: C1 costs have trended down slowly and are expected to fall further in the coming years
Solid cashflows to help debt levels remain steady
Vale management has focused on capex discipline over recent quarters as part of its management strategy; 9M25 capex was reported at $3.5b, with management guiding for $5.5b for the full FY25, lower than its previous guidance of $6.5b. This helped free cash flow remain decent at $3.1b across 9M25, and we expect this to remain positive in the coming quarters based on Vale’s operational resilience.
Vale’s reported net debt came in at about $12.6b as of September 2025. Net debt to 9M25 adjusted EBITDA was around 1.2x, though we expect it to normalise to around 0.9x – 1.0x using 12 months of FY25 data once it is released. We think this net-debt-to-EBITDA ratio appears fairly low, especially for Vale’s capital-intensive mining business.
Vale’s expanded net debt also improved slightly, from $17.5b in June 2025 to $16.6b in September 2025. This was unsurprising given management’s stated intention to gradually deleverage its balance sheet, supported by positive free cash flow generation discussed above. Looking ahead, with expanded net debt already within management’s medium-term target range of $10b - $20b, we expect further deleveraging to continue, albeit at a measured pace.
(Note: Vale’s expanded net debt includes other liabilities which management deems to be ‘debt-like’ in nature, most notably environmental obligations (e.g. Brumadinho dam) which require payments over the coming years.)
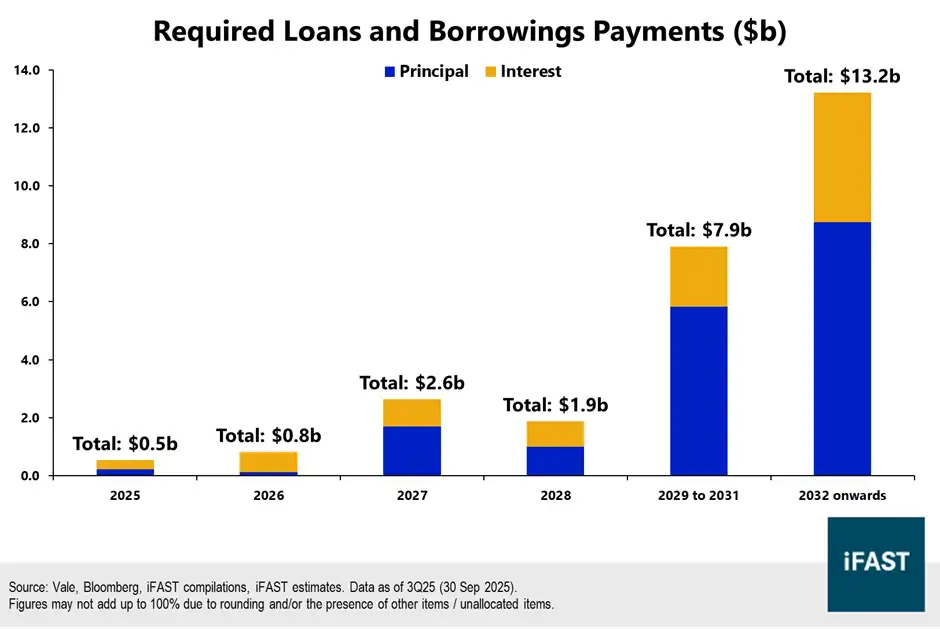
Finally, we like that Vale’s debt profile appears long-term in nature, with the majority of debt repayments falling in 2029 or after (Chart 6). Its cash position of $5.5b comfortably covers its current borrowings and leases of $0.6b as well as near-term borrowings. We think this gives Vale a long runway to execute its strategic plans, and assuming successful delivery, should allow the company to refinance its upcoming maturities without difficulty.
Chart 5: Free cash flows are strongly positive so far YTD, guided to remain positive
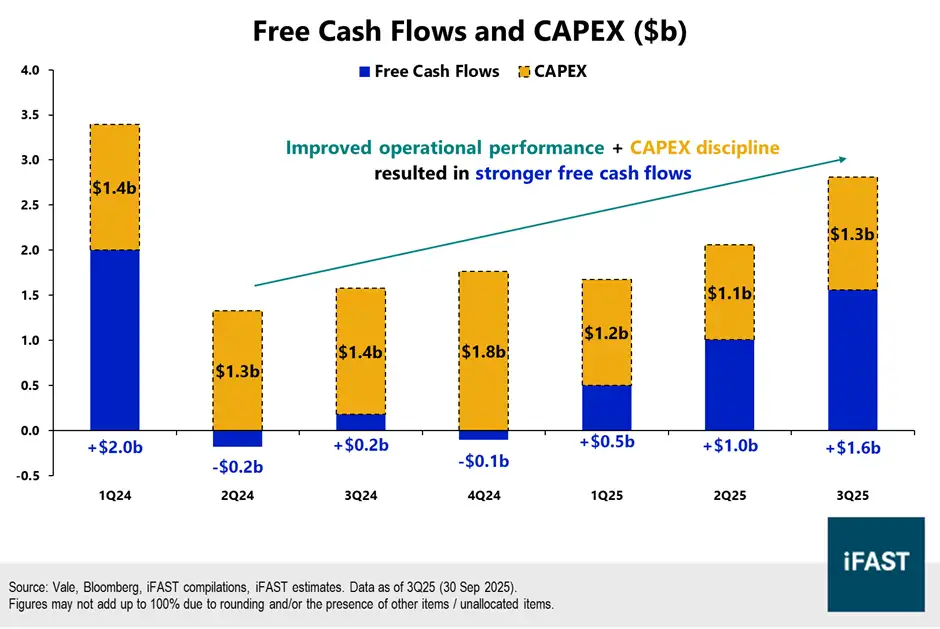
Chart 6: Vale’s debts (including interest) are mostly due in 2029 or after
Bond recommendations
To summarise, we expect Vale’s credit profile to remain stable. We think its solid underlying earnings and cashflow generation should continue to support its balance sheet strength, leaving Vale well-positioned to remain resilient even amidst market headwinds.
Vale has several bonds outstanding, issued by different Vale entities. Vale Overseas Ltd is the group’s primary financing vehicle for USD-denominated bonds, while Vale Canada Ltd comprises only its Canadian operations and hence has no iron ore exposure. Hence, Vale Canada Ltd’s bonds are rated slightly lower, reflecting its narrower operating base and the absence of a direct guarantee from its parent.
Vale’s bonds trade around the 5% level depending on tenor. Relative to higher-rated bond peers like Rio Tinto and BHP Billiton, Vale’s bonds offer a yield pickup of up to 50bps, which looks attractive considering Vale’s own resilience. Notably, Vale’s bonds also provide some yield pickup over its lower-rated peer Fortescue.
We think Vale remains a decent proposition for bond investors. Vale is a stable investment-grade issuer with a leading position in the global iron ore market and a demonstrated track record of capital discipline. Investors seeking attractive yields while staying invested in an investment-grade issuer can consider these Vale bonds highlighted in Table 2.
Table 2: Bond comparison (recommendations bolded)
| Bond Name | Issuer | Reset / Maturity Date (Years to Reset / Maturity) |
Ask Price | Yield to Worst (%) | Credit Rating (S&P / Moody's / Fitch) |
| VALEBZ 3.750% 08Jul2030 Corp (USD) | Vale Overseas Ltd | 08 Apr 2030 / 08 Jul 2030 (4.2 / 4.4) |
96.814 | 4.55% | BBB / Baa2 / BBB+ |
| Vale Canada Ltd | - / 15 Sep
2032 (- / 6.6) |
111.584 | 5.11% | BBB- / Baa3 / BBB+ | |
| VALEBZ 6.125% 12Jun2033 Corp (USD) | Vale Overseas Ltd | 12 Mar 2033 / 12 Jun 2033 (7.1 / 7.4) |
107.756 | 4.82% | BBB- / Baa2 / BBB+ |
| VALEBZ 8.250% 17Jan2034 Corp (USD) | Vale Overseas Ltd | - / 17 Jan
2034 (- / 8.0) |
120.885 | 5.03% | BBB / Baa2 / BBB+ |
| VALEBZ 5.625% 11Sep2042 Corp (USD) | Vale SA | - / 11 Sep 2042 (- / 16.6) |
101.975 | 5.44% | BBB / Baa2 / BBB+ |
| RIOLN 4.875% 14Mar2030 Corp (USD) | Rio Tinto Finance USA PLC | 14 Feb
2030 / 14 Mar 2030 (4.0 / 4.1) |
102.484 | 4.20% | A / A1 / A |
| RIOLN 5.000% 14Mar2032 Corp (USD) | Rio Tinto Finance USA PLC | 14 Jan 2032 / 14 Mar 2032 (6.0 / 6.1) |
102.858 | 4.45% | A / A1 / A |
| RIOLN 5.000% 09Mar2033 Corp (USD) | Rio Tinto Finance USA PLC | 09 Dec
2032 / 09 Mar 2033 (6.9 / 7.1) |
102.429 | 4.58% | A / A1 / A |
| RIOLN 6.125% 15Dec2033 Corp (USD) | Rio Tinto Alcan Inc | - / 15 Dec 2033 (- / 7.9) |
109.202 | 4.71% | A / WR / A |
| BHP 5.000% 21Feb2030 Corp (USD) | BHP Billiton Finance USA Ltd | 21 Jan
2030 / 21 Feb 2030 (4.0 / 4.1) |
102.984 | 4.18% | - / A1 / A |
| BHP 4.900% 21Feb2033 Corp (USD) | BHP Billiton Finance USA Ltd | 28 Nov 2032 / 21 Feb 2033 (6.8 / 7.1) |
102.181 | 4.53% | NR / A1 / A |
| BHP 5.250% 08Sep2033 Corp (USD) | BHP Billiton Finance USA Ltd | 08 Jun
2033 / 08 Sep 2033 (7.4 / 7.6) |
103.488 | 4.68% | NR / A1 / A |
| FMGAU 5.875% 15Apr2030 Corp (USD) | Fortescue Treasury Pty Ltd | 15 Jan 2030 / 15 Apr 2030 (4.0 / 4.2) |
103.049 | 5.01% | BB+ / Ba1 / - |
| FMGAU 6.125% 15Apr2032 Corp (USD) | Fortescue Treasury Pty Ltd | 15 Jan
2032 / 15 Apr 2032 (6.0 / 6.2) |
104.301 | 5.27% | BB+ / Ba1 / - |
| Source: Bloomberg, Bondsupermart, iFAST compilations. Data as of 29 Jan 2026. | |||||
Declaration: For specific disclosure, at the time of publication of this report, IFPL (via its connected and associated entities) and the analyst who produced this report hold NIL positions in the abovementioned securities.