


Highlights:
- The Chinese real estate sector has experienced a sharp downturn in the recent two months, after a fast-growing first half in 2021. Recent woes from several developers have dented market sentiments further.
- About half of developers have reached the “green light” level under the three red lines guidelines. These developer’s median net gearing ratio and non-restricted cash to short-term debt are 67% and 1.29 times respectively. Investors can also take the developers’ land bank to sales ratio and debt to sales ratio into consideration.
- There are still many attractive opportunities in the Chinese real estate sector, with a possible recovery in both supply and demand for housing. Strategy-wise investors can consider BB grade issuers of which the yields have increased.
Real Estate Sector Trend
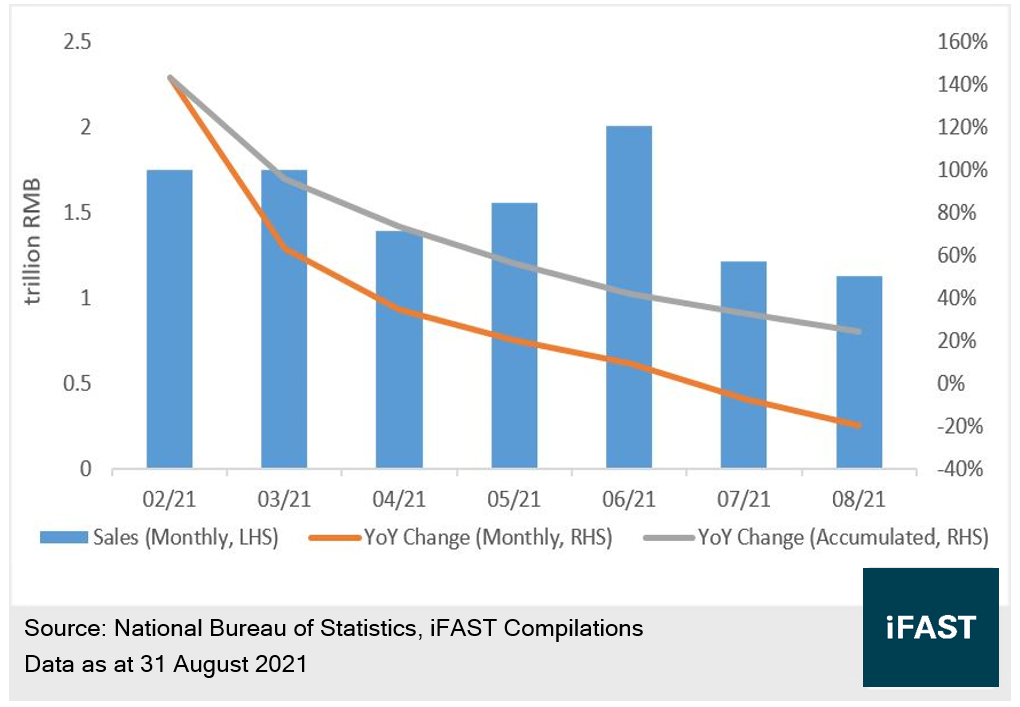
According to National Bureau of Statistics, the Chinese real estate sector experienced rapid growth in the first half of 2021, but faced a sharp downturn in the recent two months. As the low base effect dwindled, the accumulated growth of residential sales in Jan-Aug declined to 25%. Moreover, the monthly sales started to decline YoY in July, and plunged by 20% YoY in August (see Chart 1).
Chart 1: National Residential Sales
Transaction volume in different major cities have plummeted alongside
the tightening of regulations across the country in the past two months. KE
Research Institute pointed out that the transaction units and areas in 66
cities in August decreased by 10% and 14% YoY respectively. The situation in
Shenzhen, which is geographically nearest to Hong Kong, is even worse. Under
the implementation of second-hand home price guidance and school district
housing policies, apart from a continued decline in price, the transaction
volume of second-hand housing in Shenzhen has plummeted by nearly 80% in
August, setting a record low in nearly 10 years.
The government’s direct control on housing prices in some regions is not the sole deterrence; qualified buyers are finding it tough to make purchases with the two red lines imposed for bank loans last year. Many banks are tightening their mortgage quotas and applying stricter due diligence on the sources of funds, significantly increasing the time required and difficulty of the entire process. Meanwhile, the year-to-date national mortgage rates continue to rise, which has also affected market demand.
Recent woes of several developers have dragged down market sentiment as well. Not only do homebuyers lack the willingness to buy, developers are also becoming conservative when it comes to land investments. We saw the unsold rate increasing and premium rate dropping, reflecting the weakened sector fundamentals.
Chinese real estate bonds have suffered a severe setback in recent months. Part of the reason is the selloff led by Evergrande, but we believe that the market is also pricing in a nationwide financial systematic risk. Given the increasing difficulty of financing, these developers will face tightened cash flows and there may be more shockwaves to come.
Nonetheless, risks and opportunities often coexist. With the skyrocketing bond yields, we believe more investment opportunities have emerged. At this moment, selecting suitable issuers become more important than ever.
Recently, many developers have announced their 2021 interim results. We have once again consolidated their latest key credit indicators for investors’ easy reference.
(This article only includes major USD bond issuers listed on HKEX. All indicators are calculated based on the company results, which may differ from the figures released by the developers.)
Three Red Line Indicators
Amongst 48 developers (see Table 1), only two of them fall into the “red light” zone (4%), and only three within the “orange light” zone (4%). The rest are all in the “yellow light” (46%) and “green light” (46%) zones.
Table 1: Three Red Lines Distribution of Mainstream Developers
|
Tier |
Debt Growth Limit |
Developers |
|
Crossed All Three Red Lines (Red Light) |
0% |
Guangzhou R&F, Guorui |
|
Crossed Two Red Lines (Orange Light) |
≤5% |
Evergrande, Yincheng International |
|
Crossed One Red Line (Yellow Light) |
≤10% |
Country Garden, Sunac, CIFI, Greentown, Zhongliang, Zhenro, Aoyuan, Sinic, Yuzhou, KWG, Times China, Central China, Dexin, Shinsun, Fantasia, Modern Land, Redco, Landsea, Jingrui, Golden Wheel Tiandi, LVGEM, China South City* |
|
Satisfied All Three Red Lines (Green Light) |
≤15% |
China Overseas, Shimao, China Resources, Vanke, Longfor, Jinmao, Ronshine, Agile, Logan, Kaisa, Sino-Ocean, China SCE, Yuexiu, Redsun, Radiance, Powerlong, Road King, Ganglong, Jiayuan, Dafa, Hopson, Shui On |
|
Source: Company Announcements, iFAST Compilations Data as of 30 June 2021, except for China South City *Data as of 31 March 2021 |
||
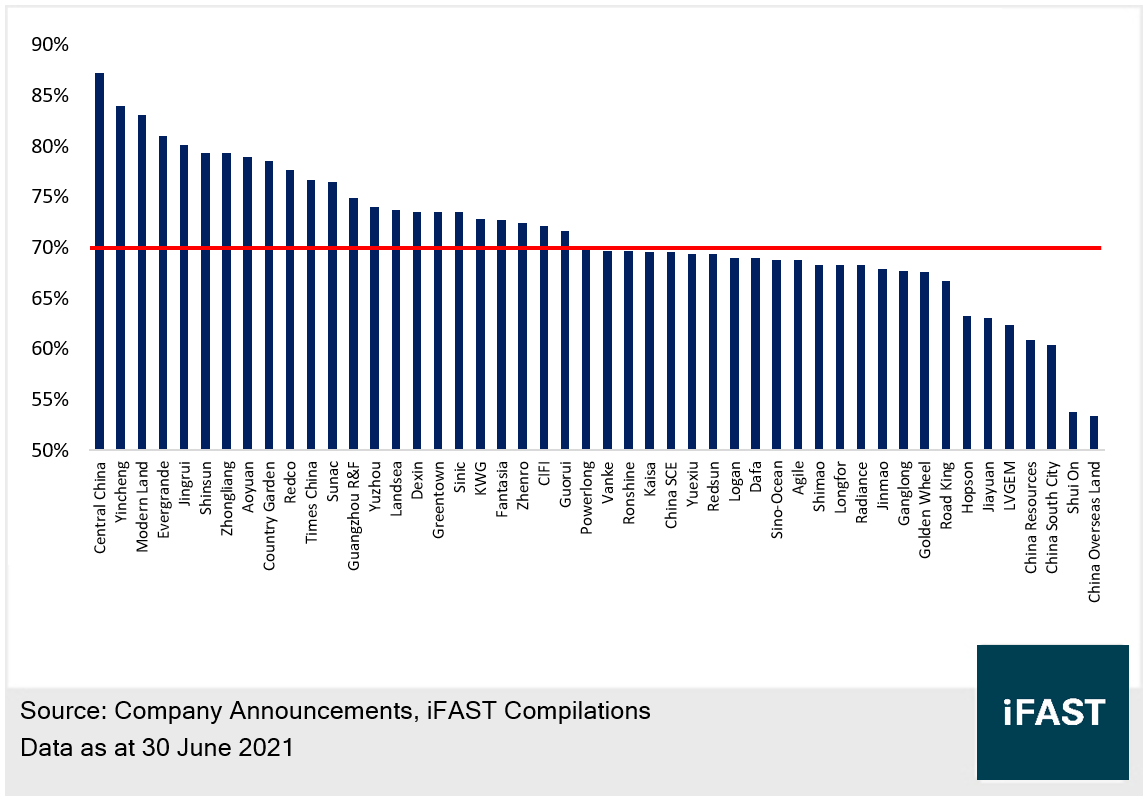
In terms of individual indicators (see Chart
2 to Chart 4), the passing rates of net gearing ratio
and cash to short-term debt ratio reached around 90% (94% and 88% respectively).
The passing rate of adjusted liability to asset ratio increased to over a half
(52%).
Besides, the median net gearing ratio, cash to short-term debt and adjusted liabilities to assets ratio are 67%, 1.59 times and 70% respectively. The median of non-restricted cash to short-term debt is 1.29 times.
Chart 2: Net Gearing Ratio of Mainstream Developers
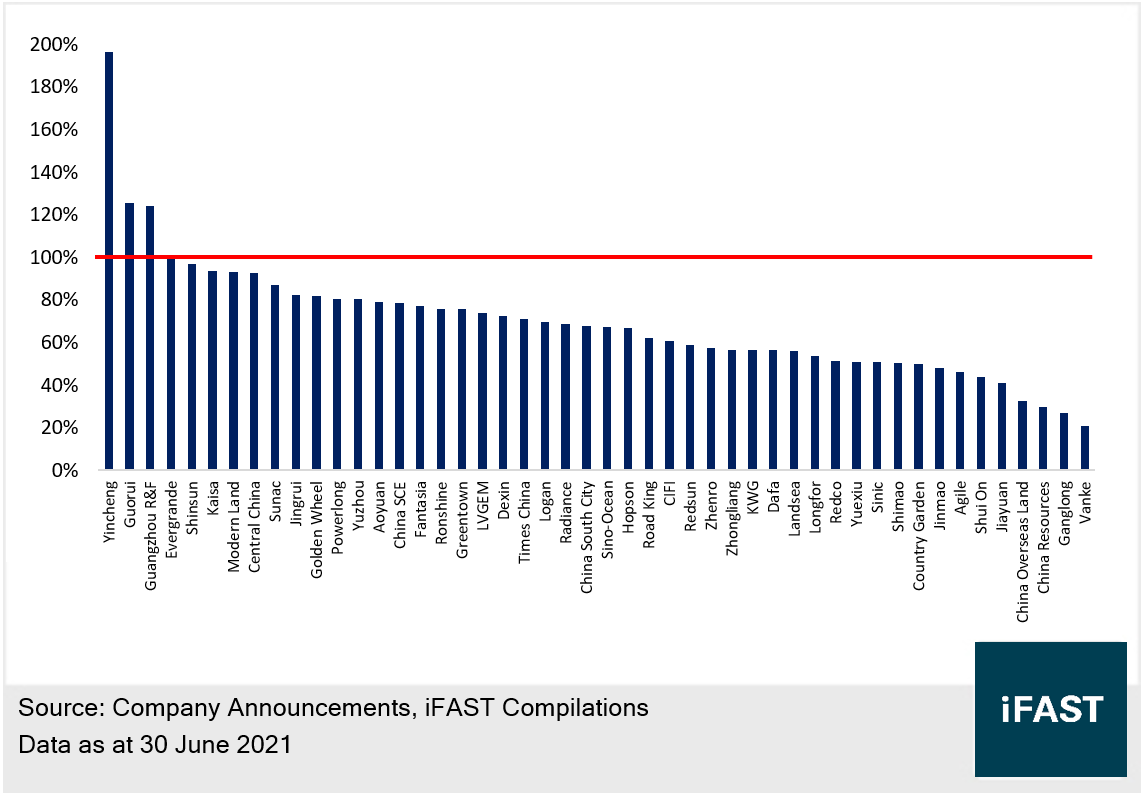
Chart 3: Cash to Short-Term Debt Ratio of
Mainstream Developers
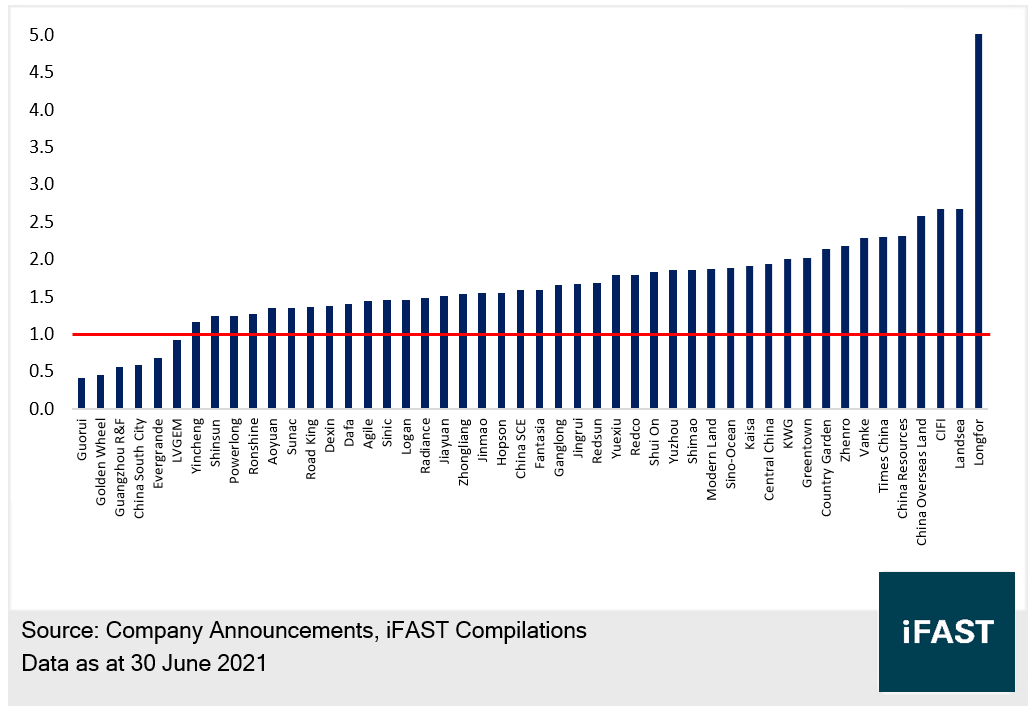
Chart 4: Adjusted Liabilities to Assets Ratio of
Mainstream Developers
Land
Bank To Sales Ratio and Debts To Sales Ratio
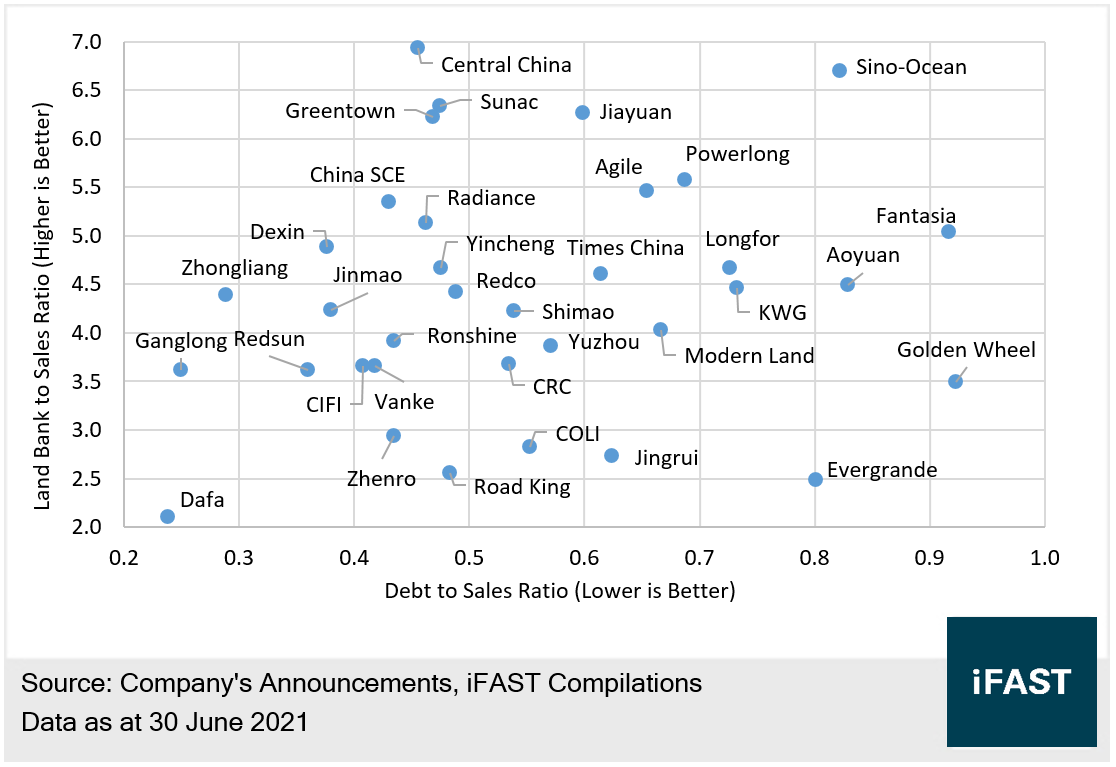
Taking advantage of land bank to sales ratio and debt to sales ratio could help investors evaluate a company’s growth prospect and cash flows. The lower the debt to sales ratio (by value), the better the debt-servicing ability through repayments using sales cash inflows. Meanwhile, the higher the land bank to sales ratio (by area), the better the prospect of future sales growth. With a larger land bank size, the company can also have larger room to lower their land buying expenses.
However, we have to bear in mind that a decrease in sales growth would lead to an increase in the land bank to sales ratio and debts to sales ratio simultaneously.
(Some developers are excluded from this chart. For example, Country Garden, Logan, Guangzhou R&F, Shinsun, Sunic and Kaisa are not included because they only announced attributable contracted sales. LVGEM, Hopson, Shui On, Guorui, China South City and Golden Wheel Tiandi are excluded because of their significantly higher ratios. Landsea has not been added because of its significantly lower ratio.)
Chart 5: Land Bank to Sales Ratio and Debt to Sales
Ratio of Mainstream Developers
Sector still Offers Investment Value; Can Consider BB-rated Bonds
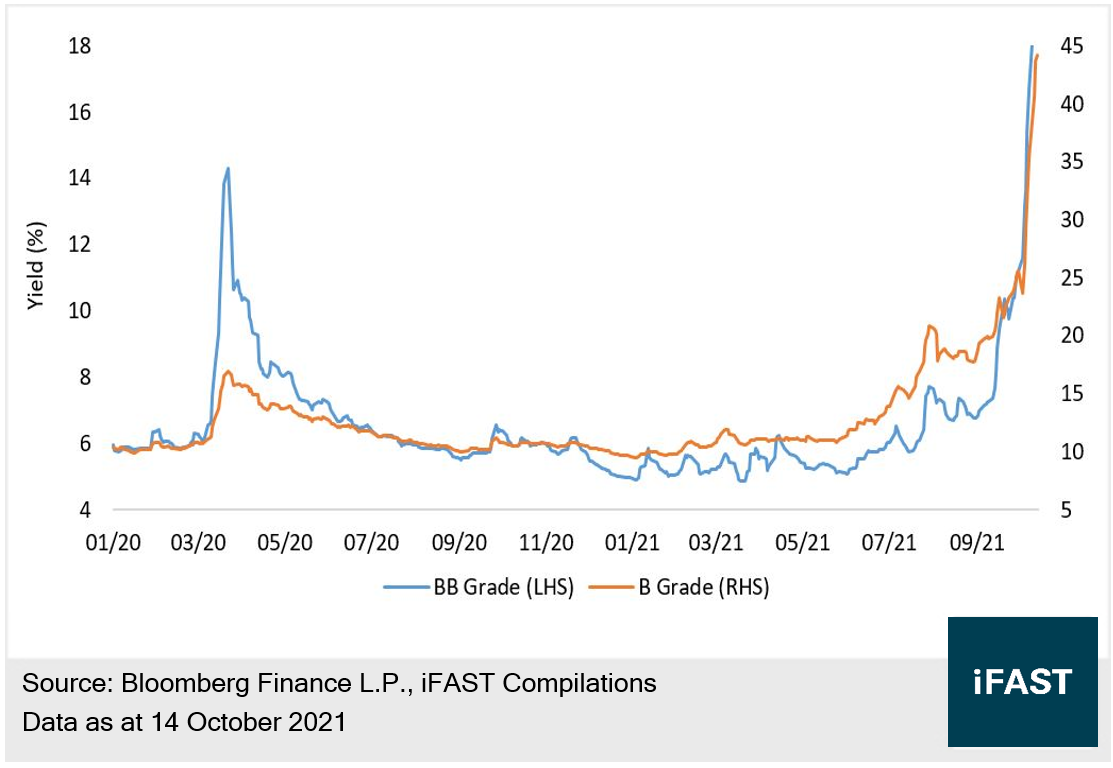
The average yield of bonds has risen to an unprecedented level after the unexpected default of Fantasia (see Chart 6). We believe some of them are dragged by the selloff in the entire sector instead of having any deterioration in their own credit.
Chart 6: BSM Chinese Real Estate
Bond Yield Index
Considering that strong demands for housing in China over the years will
not suddenly disappear, it is unlikely that the government wants to witness the
sector collapsing and many developers declaring bankrupt. With ‘stabilizing’ as
top priority, it is likely that the government may loosen the regulations in
future, paving a way for both supply and demand to recover. Thus, there are
still many attractive opportunities in the market.
Apart from looking at the three red lines, land bank to sales ratio and debt to sales ratio, investors can consider BB grade issuers whose yields have increased, and their short-term repayment pressure is more manageable than that of B grade issuers.
Conclusion
The Chinese real estate sector has experienced a sharp downturn in the recent two months, after a fast-growing first half in 2021. Recent woes from several developers have dented market sentiments further.
About half of developers have reached the “green light” level under the three red lines guidelines. These developer’s median net gearing ratio and non-restricted cash to short-term debt are 67% and 1.29 times respectively. Investors can also take the developers’ land bank to sales ratio and debt to sales ratio into consideration.
There are still many attractive opportunities in the Chinese real estate
sector, with a possible recovery in both supply and demand. Strategy-wise
investors can consider BB grade issuers of which the yields have increased.
Our podcast series, Yield Hunters, is available on Spotify, iTunes Podcasts and Google Podcasts. We share our thoughts on new bond issues and hold discussions on
the fixed income space. Listen to our latest episode below and follow us!
Declaration: For specific disclosure, at the time of publication of this report, IFPL (via its connected and associated entities) has a principal position in EVERRE 8.250% 23Mar2022 Corp (USD), RONXIN 10.500% 01Mar2022 Corp (USD), SUNAC 5.950% 26Apr2024 Corp (USD), FTHDGR 7.950% 05Jul2022 Corp (USD), FTHDGR 6.950% 17Dec2021 Corp (USD), HPDLF 6.800% 28Dec2023 Corp (USD), LVGEM 12.000% 10Mar2023 Corp (USD).









