- June headline CPI eased to 3.8% y-o-y (from 4.0% in May), driven by lower fuel and goods disinflation. However, trimmed mean inflation remained sticky at 3.6% y-o-y, keeping RBA cautious.
- A profit warning from department store retailer Myer Group citing weak consumer sentiment across June and July signals that restrictive policy rates continue to weigh on discretionary spending.
- National property values posted their sharpest monthly decline since late 2022 (-0.4% MoM in June), driven by elevated borrowing costs, low auction clearance rates, and proposed federal tax adjustments on residential investments.
- With tight policy weighing on household balance sheets and property values, we believe RBA is likely near the end of its tightening cycle. We expect an extended pause, with at most one more rate hike if sticky core inflation persists.
- We reiterate our preference for High-Quality Bonds and Barbell Strategy: We continue to favour barbell strategy, preferring both short (around 1-year) and longer tenors (7 to 10-years) of the yield curve.
Easing Headline Inflation, but Stickiness in Core Inflation Remains
Australia’s latest June 2026 CPI data show sign of inflation cooling further, with headline inflation slowed to 3.8% y-o-y in June (down from 4.0% in May), driven lower by falling fuel costs and a moderation in alcohol and tobacco prices. In monthly terms, the headline CPI fell -0.1%, marking its second consecutive monthly drop.
However, trimmed mean CPI, RBA’s preferred measure remained flat at 3.6% y-o-y. Services inflation picked up to 4.0% (from 3.7% in May), while housing cost growth accelerated to 6.8% y-o-y due to high construction costs and persistent rental pressures.
While moderation in headline inflation prevents the immediate need for rate hikes, we believe sticky core inflation renders RBA equally in no rush to deliver immediate rate cuts.
Table 1: Recent Australian Inflation
Trajectory (2026)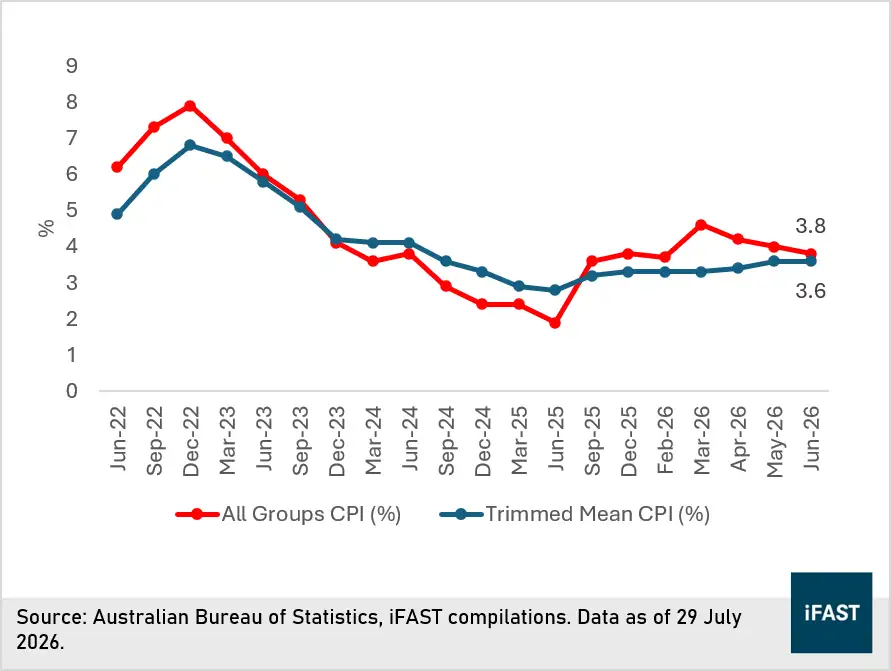
Sign of Pullback in Discretionary Spending
In its FY26 trading update, Myer Group, a major retail business operating department stores and apparel brands across Australia and New Zealand, highlighted a material drop in consumer sentiment. MoM sales in June and July were down, as cost of living pressures has resulted in weaker discretionary spending.
Chart 1: Myer Group 2H26 total sales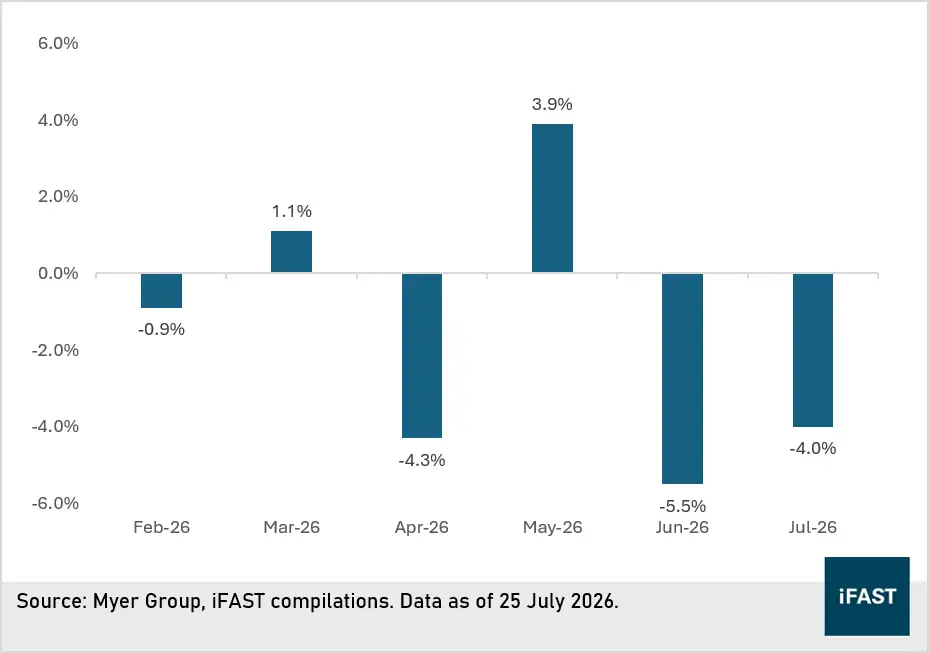
Other notable past examples also include Target, the department store chain owned by Australian retail conglomerate Wesfarmers. Although the management did not provide specific numbers, they have conveyed in half year ended 31 December 2025, that sales at Target fell due to tough trading conditions in discretionary apparel.
This growing sign of pullback in private consumption reinforces our view that household budgets are under strain, which also help constrain demand-side inflationary pressures.
Also, as private consumption typically accounts for over half of Australian GDP, this contraction in discretionary retail provides evidence that the higher interest rate is somewhat cooling aggregate demand. As household spending continues to soften, it reinforces broader signs that Australia's economic growth momentum is slowing.
Moderation in Property Markets
Adding to the drag on household wealth effect, Australia’s housing market has seen a softening across major capital cities. The Cotality Home Value Index recorded a 0.4% MoM decline in June 2026, the sharpest monthly drop in over three years.
Chart 2: Australia Cotality Dwelling Prices MoM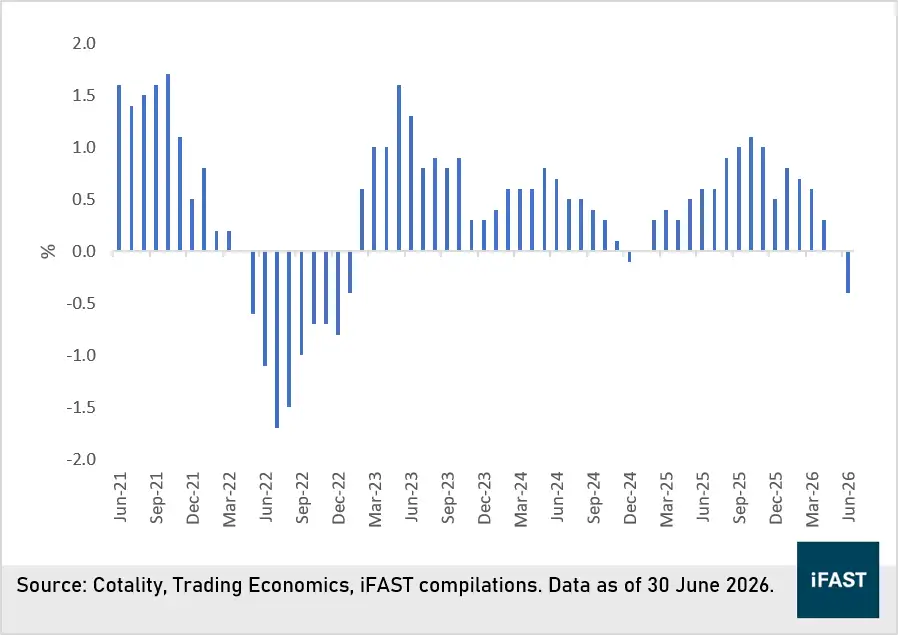
Although auction clearance rates recovered slightly in late July relative to June, overall activity remains subdued compared to pre-Budget 2026 levels. High mortgage servicing costs and proposed tax reform around negative gearing and capital gains tax continue to sideline property buyers.
Table 2: Capital city auction clearance rates
|
|
12-Feb-26 |
7-Jul-26 |
29-Jul-26 |
|
Sydney |
48% |
50% |
55% |
|
Melbourne |
76% |
49% |
53% |
|
Brisbane |
63% |
18% |
18% |
|
Canberra |
63% |
48% |
55% |
|
Adelaide |
70% |
40% |
41% |
|
Source: Domain, iFAST compilations. Data as of 29 July 2026. |
|||
While chronic structural supply shortages and immigration will prevent an outright price correction, the cooling housing market should also play a part in tempering inflationary pressures, in the sense of negative wealth effect would soften consumer spending.
Beyond its impact on consumer sentiment, a softening housing market may dampen credit expansion and contribute to housing-related turnover, further decelerate Australia’s economic momentum.
Yield Shifted Higher Since Last Update; Reaffirm Our View that It’s Close to Terminal Rate
Looking at Australia sovereign curve, it has shifted parallelly higher relative to 1 month ago, as markets priced in sticky core inflation alongside higher energy prices.
Chart
3: Australia sovereign curve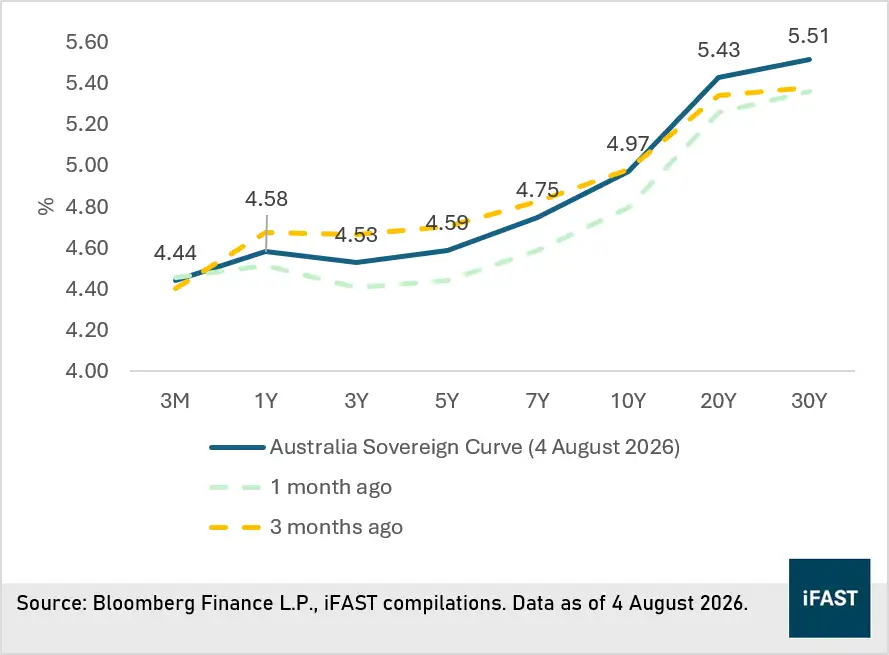
Currently, the RBA faces opposing dynamics that present a policy dilemma: persistent core inflation pressures on one side, and slowing economic momentum driven by a cooling housing market and weaker consumption on the other.
Nonetheless, these opposing forces validate that monetary policy is operating in somewhat restrictive territory, which reaffirm our view that the current rates are either already at, or close to terminal rates.
This aligns with our belief that the RBA is likely to maintain an extended pause, with at most one additional hike if inflation remains stickier. The next RBA decision will be announced on 11 August 2026 (Tuesday).
Recommendation
As such, we continue to favour a barbell approach, preferring both short (around 1-year) and longer tenors (7 to 10-years) of the yield curve.
Short-dated bonds (around 1-year) offer decent carry with minimal duration risk, serving as one of the safe harbour for investors seeking to park their cash and generate stable short-term income.
Conversely, longer-dated bonds stand to benefit should economic growth weaken further and bond yields decline. Investors who hold over a medium-term horizon stand to benefit from additional price appreciation as bonds “roll-down” to shorter maturities along the curve.
Within the corporate bond space, we remain positive on high-quality investment-grade issuers, particularly more defensive sectors such as major banks, supermarket operators and regulated utilities, which are better positioned to withstand a softer economic environment.
Table 3: Recommended bonds
(within the short ends)
|
Bond |
Issuer |
Bond credit rating (S&P/Fitch) |
Years to next call/maturity |
Bond price |
Yield to worst |
Min/Sub investment amount |
|
Australia Government |
- / AAA |
-/1Y4M |
97.85 |
4.47% |
1k/1k |
|
|
Australia Government |
- / AAA |
-/1Y10M |
96.16 |
4.50% |
1k/1k |
|
|
Source: Bondsupermart, iFAST compilations. Data as of 4 August 2026. |
||||||
(within the long ends)
|
Bond |
Issuer |
Bond credit rating (S&P/Fitch) |
Years to next call/maturity |
Bond price |
Yield to worst |
Min/Sub investment amount |
|
Banks |
|
|
|
|
|
|
|
National Australia Bank (NAB) |
- / A- |
9Y10M/ 14Y10M |
101.75 |
6.28% |
1k/1k |
|
|
Westpac Banking Corporation (WBC) |
- / A- |
8Y11M/ 13Y11M |
97.02 |
6.24% |
10k/10k |
|
|
Australia and New Zealand Banking Group (ANZ) |
- / A- |
8Y/ 13Y |
99.80 |
6.15% |
1k/1k |
|
|
Commonwealth Bank of Australia (CBA) |
- / A |
8Y4M/13Y4M |
99.80 |
6.17% |
200k/10k |
|
|
Emirates NBD Bank PJSC |
- / A+ |
-/8Y11M |
98.91 |
6.07% |
10k/10k |
|
|
BPCE SA |
- / BBB+ |
8Y11M/13Y11M |
99.15 |
6.67% |
1k/1k |
|
|
Supermarket chains |
|
|
|
|
|
|
|
Coles Group Treasury Pty Ltd |
- / - |
6Y/6Y3M |
98.77 |
5.78% |
10k/10k |
|
|
Woolworths Group Limited |
- / - |
8Y1M/8Y4M |
99.45 |
5.99% |
1k/1k |
|
|
Regulated business |
|
|
|
|
|
|
|
AusNet Services Holdings Pty Ltd |
- / - |
6Y8M/ 6Y10M |
101.55 |
5.84% |
10k/10k |
|
|
Ausgrid Finance Pty Ltd |
- / - |
9Y2M/9Y5M |
98.34 |
6.18% |
10k/10k |
|
|
EnBW International Finance B.V. |
-/- |
-/9Y7M |
96.76 |
6.24% |
200k/10k |
|
|
NBN Co Limited |
-/AA+ |
8Y5M/8Y8M |
97.81 |
5.66% |
10k/10k |
|
|
Source: Bondsupermart, iFAST compilations. Data as of 4 August 2026. *Available for trading on RMO. |
||||||
(Some additional AUD selections available for self-directed trading on RMO)
|
Bond |
Issuer |
Bond credit rating (S&P/Fitch) |
Years to next call/maturity |
Bond price |
Yield to worst |
Min/Sub investment amount |
|
Nomura Holdings |
-/A- |
-/4Y9M |
101.65 |
5.76% |
1k/1k |
|
|
AusNet Services Holdings |
-/- |
9Y4M/29Y7M |
98.75 |
6.48% |
1k/1k |
|
|
Barclays PLC |
-/BBB- |
5Y11M/- |
102.80 |
7.40% |
1k/1k |
|
|
Treasury Corporation of Victoria |
-/AA+ |
-/12Y2M |
95.37 |
5.78% |
1k/1k |
|
|
Source: Bondsupermart, iFAST compilations. Data as of 4 August 2026. |
||||||
Declaration
For specific disclosure, at the time of publication of this report, IFPL (via its connected and associated entities) holds a position in ACGB 2.250% 21May2028 Govt (AUD), NAB 6.558% 12May2041 Corp (AUD), WSTP 5.815% 04Jun2040 Corp (AUD), ANZ 6.124% 25Jul2039 Corp (AUD), BPCEGP 6.5618% 12Jun2040 Corp (AUD), WOWAU 5.910% 29Nov2034 Corp (AUD), ANVAU 6.134% 31May2033 Corp (AUD), NOMURA 6.170% 16Apr2031 Corp (AUD), BACR 8.000% Perpetual Corp (AUD), TCV 5.250% 15Sep2038 Govt (AUD), and the analyst who produced this report holds a NIL position in the abovementioned securities.