Our fixed income views for 2H26
- Global interest rate cycle has turned; Fed remains data-dependent but clearly leaning toward hikes
- Investment-Grade & High-Yield Bonds: Let carry do the heavy lifting
- USD Bonds: Sticky inflation and a flattening curve favour locking in short-to-intermediate yields
- SGD Bonds: Resilient, but remain selective on duration and credit
- MYR Bonds: Favour the middle of the curve amid oil and election risks
- AUD Bonds: Barbell approach as RBA prepares for extended pause
- EM Debt: Neutral to slightly negative stance as attractive carry is mitigated by inflation risks
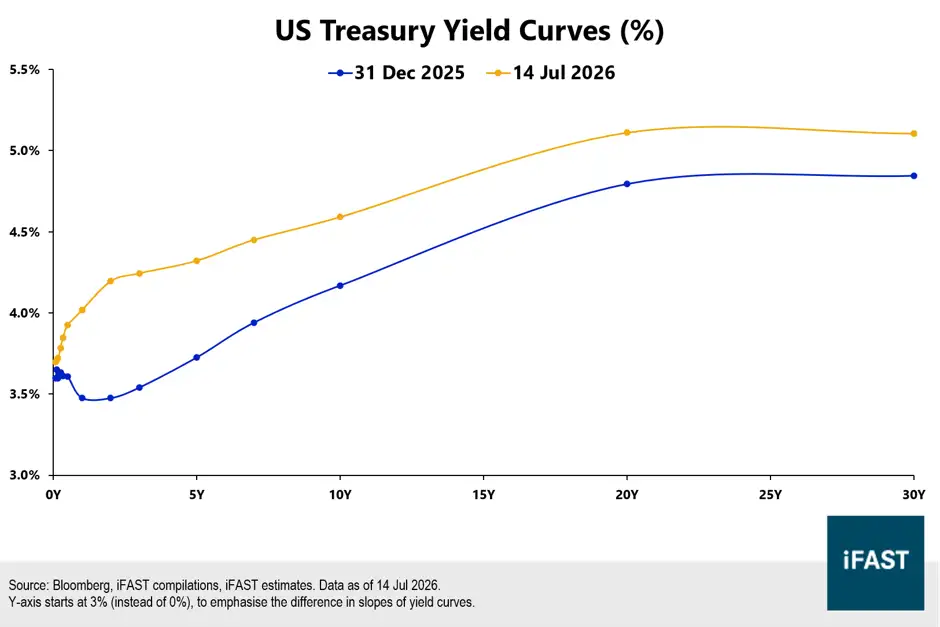
Much has changed in 6 months. Moving into the second half of 2026 (2H26), the policy rate trajectory has swung upward, as many major central banks have either already raised rates or adopted a more hawkish stance. The UST yield curve bear-flattened (Chart 1) as markets began to price in greater rate hikes sometime in 2026 or early 2027. However, the carry argument remains intact. All-in yields still look attractive across many bonds – in the USD bond space, corporate yields generally start at high-4% levels, supported by risk-free (US Treasury [UST]) yields of also 4+%.
Looking ahead, the narrative for 2H26 remains constructive for fixed income. Investors can count on carry and income being the key themes driving the attractiveness of fixed income, rather than on aggressive spread tightening and/or large declines in risk-free rates.
Chart 1: UST yield curve bear-flattened year-to-date
1. Global interest rate cycle has turned; Fed remains data-dependent but clearly leaning toward hikes
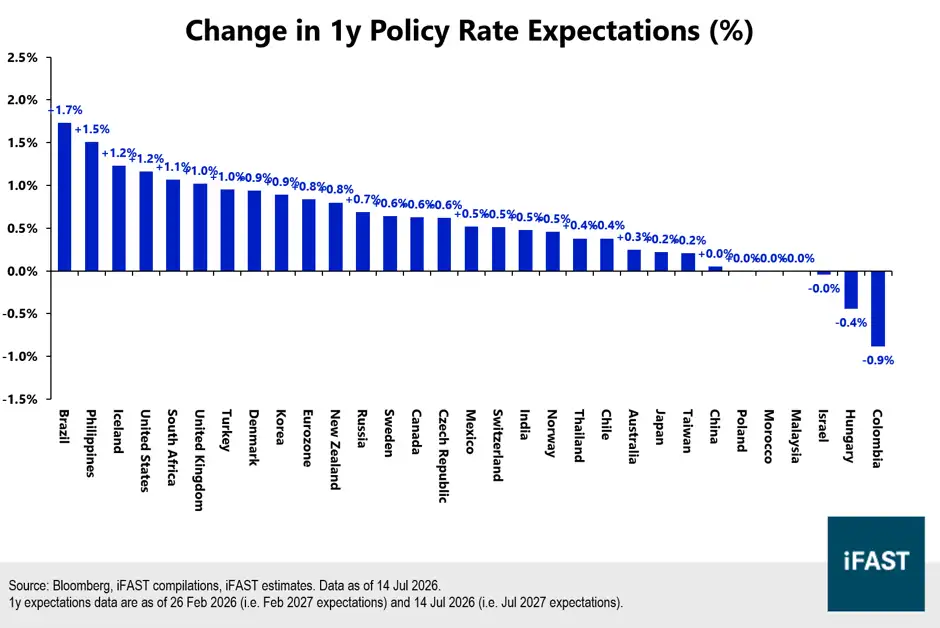
The global interest rate cycle has clearly turned toward tightening – the shift is visible across multiple developed and emerging markets (Chart 2). For instance, the Reserve Bank of Australia has raised its Cash Rate by a cumulative 75 basis points (bps) so far, while the European Central Bank (ECB) raised its policy rates by 25 bps in June.
The common driver has been inflation. Oil prices shot up after the outbreak of the Iran conflict; despite recent moderation since then, pump prices (faced by consumers) remain well above pre-conflict levels, perhaps due to still-wide refining spreads. The possibility of renewed price pressures, be it from energy or from other second-order effects, generates further uncertainty over the inflation situation. We expect interest rates and yields to generally trend upward globally while these pressures remain unresolved.
Meanwhile, the Fed has not yet joined other central banks in raising rates, but its recent projections (e.g. dot plot) turned more hawkish. The Fed remains data-dependent, but we still lean toward rate hikes in the coming meetings. Even with the Fed holding thus far, we think the global trend is clear – central banks have adjusted their stances and are prepared to hike rates if needed.
Related article: We’re witnessing a turn in the interest rate cycle. Be prepared for rate hikes.
2. Investment-Grade & High-Yield Bonds: Let carry do the heavy lifting
All-in bond yields remain attractive relative to recent history (especially the 2010s), but tight credit spreads leave limited room for further compression broadly across both investment-grade and high-yield segments. We therefore expect carry, rather than large capital gains, to drive returns in 2H26. Resilient corporate earnings and robust investor demand should continue to support credit markets, although elevated issuance and renewed volatility could create more dispersion across issuers.
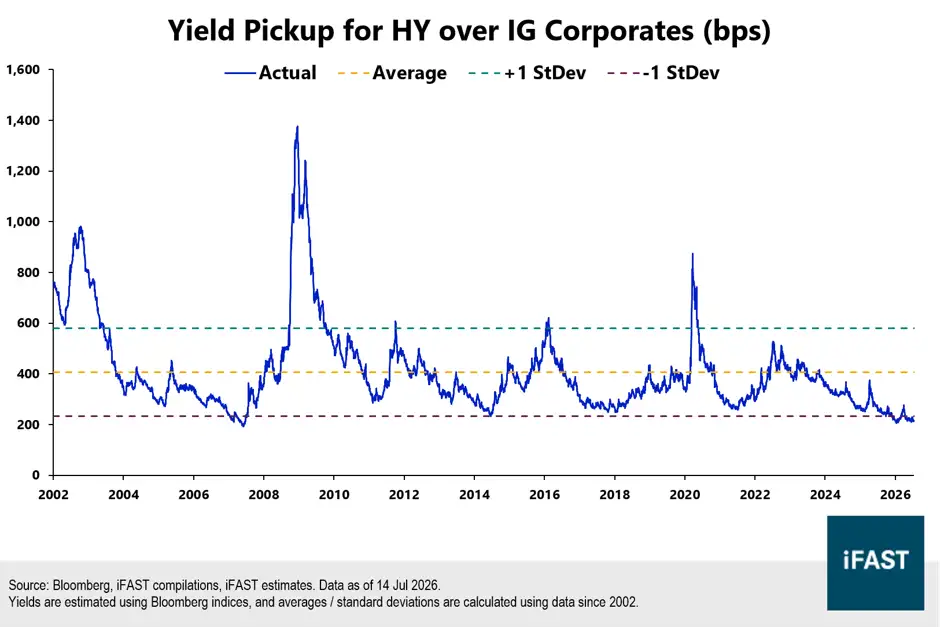
We continue to prefer investment-grade over high-yield bonds as a core allocation. Their attractive all-in yields allow investors to earn meaningful income without taking excessive credit risk, while stronger balance sheets and better market access should provide greater resilience if economic conditions weaken. Furthermore, the yield pickup for high-yield over investment-grade bonds has narrowed significantly over the past years (Chart 3). Short to intermediate maturities offer a particularly favourable balance between carry and interest-rate risk.
High-yield bonds can still enhance portfolio income, but investors should be selective. With the yield pickup over investment grade relatively modest, investors should balance these higher yields against their respective default and credit risks. We recommend careful credit selection, favouring shorter-dated and higher-quality high-yield issuers with visible liquidity and cashflow profiles.
Related article: Investment Grade Bonds 2H26 Outlook: Slow, steady, and selective
3. USD Bonds: Sticky inflation and a flattening curve favour locking in short-to-intermediate yields
Overall, we expect short-end US rates to remain higher for longer. USD bonds faced heightened rates volatility in 1H26 as sticky non-energy housing and services inflation kept core measures well above the Fed’s 2% target. The Fed’s recent projections also turned more hawkish - its median forecast for 2026 core PCE inflation was revised sharply higher from 2.7% to 3.3%, while its projected Fed Funds rate for end-2026 also increased from 3.4% to 3.8%. The Fed remains data-dependent, but we still lean toward rate hikes, with the magnitude of rate hikes depending on incoming data.
We recommend investors stay focused on short to intermediate maturities. The US Treasury curve has already flattened materially in 1H26, with the 2s10s spread compressing to just 27 bps (Chart 4) – extending duration now offers less roll-down or term premium compensation. Short-to-intermediate sovereigns (especially 1–2 years and 5–7 years) currently deliver comparable or higher yields while preserving reinvestment flexibility and limiting price downside if further hikes materialise. Longer-dated bonds should be treated purely as strategic trading positions given elevated duration risk and potential balance-sheet run-off under Warsh.
We nonetheless find many opportunities in corporate bonds, particularly in short to medium tenors. While the UST curve has flattened, the USD corporate curve still looks relatively steeper than the UST curve today (Chart 5). With proper credit selection, the steeper corporate curve allows investors to obtain additional yield while remaining within intermediate maturities.
Chart 4: Pickup for 10y UST over 2y UST (2s10s) has narrowed year-to-date
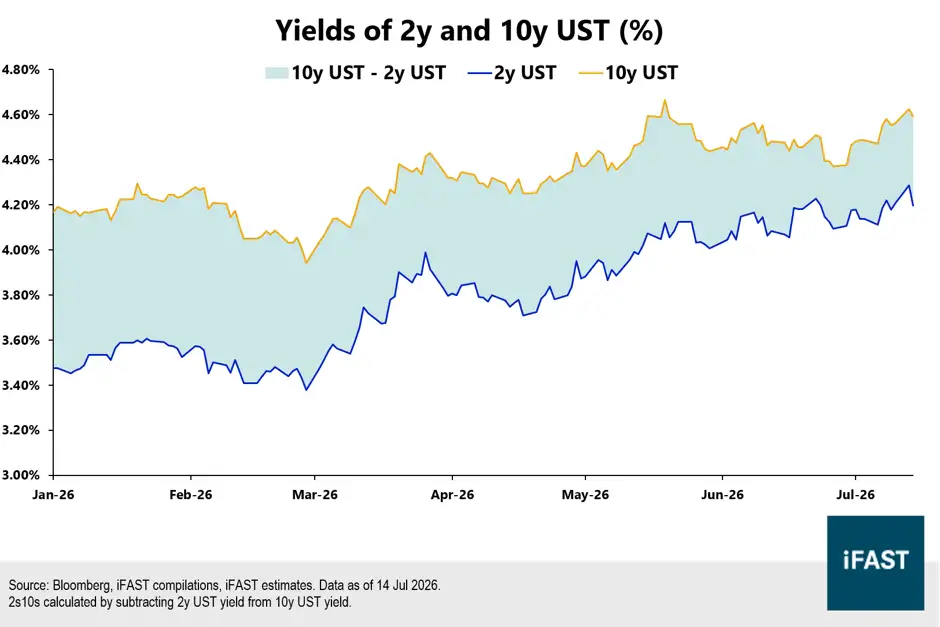
Chart 5: Corporate bond curve shows a larger pickup for taking on maturity risks
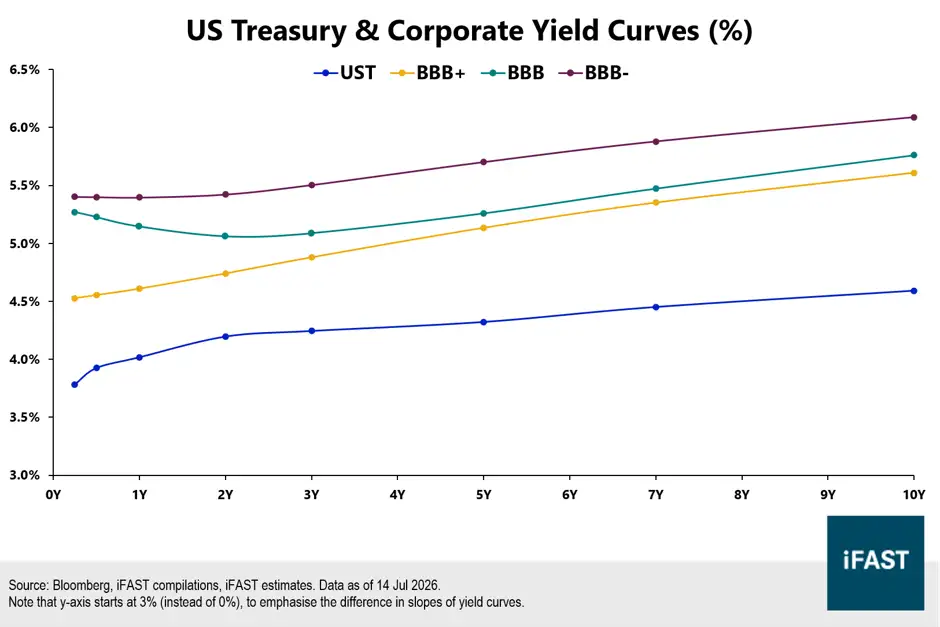
Table 1: USD bond recommendations to consider
| Bond Name | Reset / Maturity Date (Years to Reset / Maturity) |
Ask Price | Yield to Worst (%) | Credit Rating (S&P / Moody's / Fitch) |
| FWDGHD 5.252% 22Sep2030 Corp (USD) | - / 22 Sept 2030 (- / 4.2) |
99.794 | 5.31% | - / Baa2 / BBB- |
| FWDGHD 7.635% 02Jul2031 Corp (USD) | - / 02 Jul
2031 (- / 5.0) |
109.134 | 5.50% | - / Baa2 / BBB- |
| INTC 2.450% 15Nov2029 Corp (USD) | 15 Aug 2029 / 15 Nov 2029 (3.1 / 3.3) |
93.046 | 4.74% | BBB / Baa2 / BBB |
| INTC 5.200% 10Feb2033 Corp (USD) | 10 Nov
2032 / 10 Feb 2033 (6.3 / 6.6) |
100.568 | 5.09% | BBB / Baa2 / BBB |
| LGENSO 5.375% 02Jul2029 Corp (USD) | - / 02 Jul 2029 (- / 3.0) |
101.242 | 4.92% | BBB / Baa2 / - |
| LGCHM 2.375% 07Jul2031 Corp (USD) | - / 07 Jul
2031 (- / 5.0) |
87.657 | 5.23% | BBB / Baa2 / - |
| MEITUA 4.500% 02Apr2028 Corp (USD) | 02 Mar 2028 / 02 Apr 2028 (1.6 / 1.7) |
99.593 | 4.75% | BBB+ / Baa1 / BBB+ |
| MEITUA 3.050% 28Oct2030 Corp (USD) | 28 Jul
2030 / 28 Oct 2030 (4.0 / 4.3) |
92.538 | 5.01% | BBB+ / Baa1 / BBB+ |
| META 4.875% 15Nov2035 Corp (USD) | 15 Aug 2035 / 15 Nov 2035 (9.1 / 9.3) |
96.149 | 5.41% | AA- / Aa3 / - |
| ORIX 4.450% 09Sep2030 Corp (USD) | - / 09
Sept 2030 (- / 4.2) |
98.539 | 4.84% | BBB+ / A3 / A- |
| ORIX 4.000% 13Apr2032 Corp (USD) | - / 13 Apr 2032 (- / 5.7) |
95.494 | 4.91% | BBB+ / A3 / A- |
| ROTHLF 7.000% 11Sep2034 Corp (USD) | 11 Sept
2029 / 11 Sept 2034 (3.2 / 8.2) |
104.414 | 5.33% | - / Baa1 / BBB+ |
| XYZ 3.500% 01Jun2031 Corp (USD) | 01 Mar 2031 / 01 Jun 2031 (4.6 / 4.9) |
91.821 | 5.44% | BB+ / Ba1 / BBB- |
| XYZ 6.500% 15May2032 Corp (USD) | 15 May
2027: Call @ 103.25 15 May 2028: Call @ 101.625 15 May 2029: Call @ 100 |
101.842 | 5.78% | BB+ / Ba1 / BBB- |
| MUTHIN 7.125% 14Feb2028 Corp (USD) | - / 14 Feb 2028 (- / 1.6) |
101.163 | 6.33% | BB+ / - / BB+ |
| MUTHIN 6.375% 02Mar2030 Corp (USD) | - / 02 Mar
2030 (- / 3.6) |
99.956 | 6.39% | BB+ / Ba1 / - |
| PETBRA 5.125% 10Sep2030 Corp (USD) | 10 Aug 2030 / 10 Sept 2030 (4.1 / 4.2) |
98.362 | 5.57% | BB / Ba1 / BB |
| PETBRA 6.500% 03Jul2033 Corp (USD) | 03 Apr
2033 / 03 Jul 2033 (6.7 / 7.0) |
102.870 | 5.97% | BB / Ba1 / BB |
| VALEBZ 3.750% 08Jul2030 Corp (USD) | 08 Apr 2030 / 08 Jul 2030 (3.7 / 4.0) |
95.509 | 5.01% | BBB / Baa2 / BBB+ |
| XP 6.750% 02Jul2029 Corp (USD) | 02 Jun
2029 / 02 Jul 2029 (2.9 / 3.0) |
102.211 | 5.90% | - / Ba1 / BB |
| Source: Bloomberg, Bondsupermart, iFAST
compilations. Data as of 16 Jul 2026. If a bond has no reset, we take its call date instead. |
||||
4. SGD Bonds: Resilient, but remain selective on duration and credit
SGD bonds remained resilient in 1H26 with Singapore government and corporate bonds returning 2.3% and 1.4% respectively, despite heightened rates volatility. We think SGD rates may face renewed upward pressure if higher energy costs feed into higher global interest rates, especially if the Fed begins to hike in subsequent meetings. Nonetheless, we expect SGD rates to remain better-anchored than US rates, especially as liquidity remains ample domestically with continued safe-haven and wealth inflows.
We recommend investors stay short-dated on Singapore sovereign bonds. The SGS curve has already flattened in 1H26, with the short-end rising 4 - 11 bps and the long end falling 5 - 13 bps, leaving even less reward for extending sovereign duration. Short-dated sovereigns therefore offer comparable levels of yield, while allowing investors to remain flexible should the rates situation change in future.
For investors seeking higher income, the SGD corporate bonds universe broadly remains structurally stable with varied opportunities for a yield pickup. Supply-demand technicals remain somewhat supportive, with 1H26 issuances modestly softer compared to a strong 2H25. We favour high-quality Tier-2 bank bonds for their attractive yields without significant credit risks, as well as certain unrated bonds offering higher yields.
Related article: SGD Bonds 2H26 Outlook: Finding quality yield in an uncertain world
Table 2: SGD Bond recommendations to consider
| Bond Name | Reset / Maturity Date (Years to Reset / Maturity) |
Ask Price | Yield to Worst (%) | Credit Rating (S&P / Moody's / Fitch) |
| ACAFP 4.250% 14Jan2035 Corp (SGD) | 14 Jan 2030 / 14 Jan 2035 (3.5 / 8.5) |
104.091 | 3.01% | BBB+ / Baa1 / A- |
| BPCEGP 5.000% 08Mar2034 Corp (SGD) | 08 Mar
2029 / 08 Mar 2034 (2.6 / 7.6) |
105.879 | 2.67% | BBB / Baa2 / BBB+ |
| BPCEGP 4.600% 21Jan2035 Corp (SGD) | 21 Jan 2030 / 21 Jan 2035 (3.5 / 8.5) |
105.879 | 2.83% | BBB / Baa2 / BBB+ |
| BNP 3.950% 15Apr2035 Corp (SGD) | 15 Apr
2030 / 15 Apr 2035 (3.7 / 8.8) |
103.607 | 2.92% | - / Baa2 / A- |
| CMZB 6.500% 24Apr2034 Corp (SGD) | 24 Apr 2029 / 24 Apr 2034 (2.8 / 7.8) |
108.721 | 2.88% | - / Baa2 / - |
| HSBC 4.750% 12Sep2034 Corp (SGD) | 12 Sept
2029 / 12 Sept 2034 (3.2 / 8.2) |
105.872 | 2.79% | BBB+ / Baa1 / A- |
| QNMSP 3.950% 10Jul2028 Corp (SGD) | - / 10 Jul 2028 (- / 2.0) |
100.987 | 3.43% | - / - / - |
| MSFSSP 5.100% 29Oct2029 Corp (SGD) | - / 29 Oct
2029 (- / 3.3) |
101.223 | 4.69% | - / - / - |
| TMGSP 4.650% 29Oct2029 Corp (SGD) | - / 29 Jan 2029 (- / 2.5) |
103.179 | 3.61% | - / - / - |
| WHURSP 4.800% 04Nov2030 Corp (SGD) | - / 04 Nov
2030 (- / 4.3) |
103.264 | 3.96% | - / - / - |
| HOBEE 3.300% 30Jun2031 Corp (SGD) | - / 30 Jun 2031 (- / 5.0) |
100.379 | 3.22% | - / - / - |
| Source: Bloomberg, Bondsupermart, iFAST
compilations. Data as of 16 Jul 2026. If a bond has no reset, we take its call date instead. |
||||
5. MYR Bonds: Favour the middle of the curve amid oil and election risks
Malaysia's bond market enters the second half of 2026 from a position of relative resilience. While global oil prices have introduced upside risks to inflation and fiscal spending, inflationary pressures remain largely supply-driven and are expected to stay within Bank Negara Malaysia's (BNM) 1.5%-2.5% target range.
On the fiscal side, elevated oil prices cut both ways. Subsidy costs could balloon toward RM40 billion for the year, but stronger O&G trade surpluses, higher Petronas dividends and BUDI Madani savings should keep the deficit close to target at around 3.6% of GDP versus the 3.5% goal, a modest slippage that doesn't disturb the medium-term consolidation path toward 3.0% of GDP by 2028. Combined with resilient domestic demand, a healthy labour market and on top of the government's continued commitment to fiscal consolidation, the macro backdrop remains broadly supportive, and hence we expect BNM to keep the Overnight Policy Rate (OPR) unchanged at 2.75%.
For MGS, we shift our preference from the 5 – 7 year segment to the 3 – 5 year part of the curve. We believe this offers a better balance of carry and duration risk, especially as we expect MGS yields to trend slightly higher in 2H26 amid elevated UST yields and election-related risks.
Within corporate bonds, we favour higher-quality A-rated issuers, where spreads remain wide enough to offer a meaningful yield pickup over government bonds. Lower-rated credits may offer higher headline yields, but investors should ensure that the additional return adequately compensates for weaker balance sheets, refinancing risk and lower liquidity.
Related article: Malaysia Bond Market Outlook 2H26: Between a Barrel and a Ballot Box
Table 3: MYR Bond recommendations to consider
| Bond Name | Reset / Maturity Date (Years to Reset / Maturity) | Ask Price | Yield to Worst (%) | Credit Rating (S&P / Moody's / Fitch) |
| MGS 3.885% 15Aug2029 Govt (MYR) | - / 15 Aug 2029 (- / 3.1) | 101.800 | 3.26% | - / - / - |
| MGS 4.498% 15Apr2030 Govt (MYR) | - / 15 Apr 2030 (- / 3.7) | 103.990 | 3.35% | - / A3 / BBB+ |
| MGS 4.232% 30Jun2031 Govt (MYR) | - / 30 Jun 2031 (- / 5.0) | 103.849 | 3.38% | - / A3 / BBB+ |
| MGII 4.130% 09Jul2029 Govt (MYR) | - / 09 Jul 2029 (- / 3.0) | 102.370 | 3.29% | - / - / BBB+ |
| MGII 4.245% 30Sep2030 Govt (MYR) | - / 30 Sept 2030 (- / 4.2) | 103.350 | 3.38% | - / - / BBB+ |
| MGII 3.804% 08Oct2031 Govt (MYR) | - / 08 Oct 2031 (- / 5.2) | 101.780 | 3.43% | - / - / - |
| JBCOCO 5.800% 12Nov2027 Corp (MYR) | - / 12 Nov 2027 (- / 1.3) | 100.250 | 5.67% | - / - / - |
| JBCOCO 5.950% 13Nov2029 Corp (MYR) | - / 13 Nov 2029 (- / 3.3) | 102.100 | 5.25% | - / - / - |
| YNSMK 5.000% 12Dec2030 Corp (MYR) | - / 12 Dec 2030 (- / 4.4) | 101.370 | 4.65% | - / - / - |
| YNSMK 7.500% Perpetual Corp (MYR) - Series 2 | 06 Dec 2027 / - (1.4 / -) | 104.050 | 4.48% | - / - / - |
| YNSMK 7.500% Perpetual Corp (MYR) | 08 Mar 2029 / - (2.6 / -) | 105.450 | 5.25% | - / - / - |
| DJCMK 6.250% 13Nov2028 Corp (MYR) | - / 13 Nov 2028 (- / 2.3) | 102.600 | 5.04% | - / - / - |
| DJCMK 6.100% 31Mar2031 Corp (MYR) | - / 31 Mar 2031 (- / 4.7) | 102.478 | 5.49% | - / - / - |
| DJCMK 6.000% 15Jul2031 Corp (MYR) | - / 15 Jul 2031 (- / 5.0) | 101.000 | 5.77% | - / - / - |
| Source: Bloomberg, Bondsupermart, iFAST compilations. Data as of 16 Jul 2026. If a bond has no reset, we take its call date instead. | ||||
6. AUD Bonds: Barbell approach as RBA prepares for extended pause
Australia's fixed income market remains shaped by the tension between slowing economic growth and persistently sticky inflation. RBA's preferred trimmed mean inflation unexpectedly rises to 3.6% in May, still well above the 2% - 3% target. However, softness in economic growth, cautious household spending and emerging signs of cooling in the housing market suggest that the current policy rate is somewhat restrictive. Hence, with the RBA already having lifted its Cash Rate 3 times in 1H26 to 4.35%, we believe the RBA is likely nearing the end of its tightening cycle, with an extended pause as a likely scenario.
With the yield curve already having shifted lower relative to a few months ago and rate expectations converging toward a terminal cash rate, we continue to favour a barbell strategy, preferring both short tenors (~1 year) for carry with limited duration risk, paired with longer tenors (7 - 10 years) that stand to benefit from falling bond yields should economic growth weaken further. Within the corporate bond space, we remain positive on high-quality investment-grade issuers, particularly more defensive sectors such as major banks, supermarket operators and regulated utilities.
Related article: Australia 2H26 Bond Outlook: Waiting for the Wind to Shift
Table 4: AUD Bond recommendations to consider
| Bond Name | Reset / Maturity Date (Years to Reset / Maturity) |
Ask Price | Yield to Worst (%) | Credit Rating (S&P / Moody's / Fitch) |
| ACGB 2.750% 21Nov2027 Govt (AUD) | - / 21 Nov 2027 (- / 1.3) |
96.196 | 4.48% | - / Aaau / AAAu |
| ACGB 2.250% 21May2028 Govt (AUD) | - / 21 May
2028 (- / 1.8) |
96.076 | 4.50% | - / Aaau / AAAu |
| NAB 6.558% 12May2041 Corp (AUD) | 12 May 2036 / 12 May 2041 (9.8 / 14.8) |
102.238 | 6.23% | A- / A3 / A- |
| WSTP 5.815% 04Jun2040 Corp (AUD) | 04 Jun
2035 / 04 Jun 2040 (8.9 / 13.9) |
97.382 | 6.20% | A- / A3 / A- |
| ANZ 6.124% 25Jul2039 Corp (AUD) | 25 Jul 2034 / 25 Jul 2039 (8.0 / 13.0) |
100.045 | 6.12% | A- / A3 / A- |
| CBAAU 6.152% 27Nov2039 Corp (AUD) | 27 Nov
2034 / 27 Nov 2039 (8.4 / 13.4) |
100.018 | 6.15% | A- / A2 / A |
| EBIUH 5.913% 18Jun2035 Corp (AUD) | - / 18 Jun 2035 (- / 8.9) |
98.602 | 6.12% | - / A1 / A+ |
| BPCEGP 6.5618% 12Jun2040 Corp (AUD) | 12 Jun
2035 / 12 Jun 2040 (8.9 / 13.9) |
99.231 | 6.68% | BBB / Baa2 / BBB+ |
| CGJAU 5.546% 07Oct2032 Corp (AUD) | 09 Jul 2032 / 07 Oct 2032 (6.0 / 6.2) |
98.992 | 5.74% | BBB+ / Baa1 / - |
| WOWAU 5.910% 29Nov2034 Corp (AUD) | 31 Aug
2034 / 29 Nov 2034 (8.1 / 8.4) |
99.625 | 5.97% | BBB / - / - |
| ANVAU 6.134% 31May2033 Corp (AUD) | 31 Mar 2033 / 31 May 2033 (6.7 / 6.9) |
101.808 | 5.80% | BBB+ / Baa1 / - |
| AUSGF 5.946% 10Dec2035 Corp (AUD) | 11 Sept
2035 / 10 Dec 2035 (9.2 / 9.4) |
98.635 | 6.14% | BBB / Baa1 / - |
| ENBW 5.7923% 26Feb2036 Corp (AUD) | - / 26 Feb 2036 (- / 9.6) |
97.018 | 6.21% | A- / Baa1 / - |
| NBNAUS 5.350% 06Mar2035 Qsov (AUD) | 06 Dec
2034 / 06 Mar 2035 (8.4 / 8.6) |
97.735 | 5.68% | - / Aa3 / AA+ |
| Source: Bloomberg, Bondsupermart, iFAST
compilations. Data as of 16 Jul 2026. If a bond has no reset, we take its call date instead. |
||||
7. EM Debt: Neutral to slightly negative stance as attractive carry is mitigated by inflation risks
Policymakers are now facing a more complicated backdrop, particularly in food-importing countries where food carries a relatively high weight in the consumer price index. The key macro risk remains the Middle East conflict. Although the June ceasefire memorandum has eased immediate concerns and brought Brent crude prices off their highs, oil prices are expected to remain elevated, with the risk of renewed escalation or prolonged supply disruptions still present. Furthermore, a strengthening El Niño raises the risk of drier conditions across parts of Southeast Asia, potentially disrupting agricultural output and adding to food-price pressures.
Against this backdrop, most EM central banks are likely to remain patient, awaiting clearer evidence that inflation is firmly under control before resuming their easing cycles. Some countries remain relatively insulated via commodity export windfalls and front-loaded rate hike buffers, while others are likely to face greater challenges.
Also, EMD spreads are still at the tighter end of their historical range, offering limited yield carry as a buffer against spread widening. OAS levels leave meaningful room for further widening should inflation prove more persistent than expected or geopolitical tensions escalate. That said, EM debt continues to offer attractive carry relative to many developed fixed income markets. In our view, carry is likely to remain the primary driver of returns over the coming quarters, rather than further spread compression.
Overall, we believe the uncertainty surrounding inflation warrants a more cautious stance, which supports our neutral to slightly negative outlook on EM debt. Nevertheless, for investors seeking exposure to the asset class, we continue to favour investment-grade EM sovereigns with strong external balances over high-yield credits, which appear more vulnerable to renewed volatility.
Declaration: For specific disclosure, at the time of publication of this report, IFPL (via its connected and associated entities) holds positions in XYZ 6.500% 15May2032 Corp (USD), MUTHIN 7.125% 14Feb2028 Corp (USD), VALEBZ 3.750% 08Jul2030 Corp (USD), CMZB 6.500% 24Apr2034 Corp (SGD), QNMSP 3.950% 10Jul2028 Corp (SGD), TMGSP 4.650% 29Oct2029 Corp (SGD), and WHURSP 4.800% 04Nov2030 Corp (SGD), MGII 4.245% 30Sep2030 Govt (MYR), DJCMK 6.250% 13Nov2028 Corp (MYR), DJCMK 6.100% 31Mar2031 Corp (MYR), DJCMK 6.000% 15Jul2031 Corp (MYR), ACGB 2.750% 21Nov2027 Govt (AUD), NAB 6.558% 12May2041 Corp (AUD),ANZ 6.124% 25Jul2039 Corp (AUD), BPCEGP 6.5618% 12Jun2040 Corp (AUD), WOWAU 5.910% 29Nov2034 Corp (AUD), and ANVAU 6.134% 31May2033 Corp (AUD). The analyst who produced this report hold NIL positions in the abovementioned securities. This research report was prepared with the assistance of artificial intelligence (AI) tools. iFAST Financial Pte Ltd does not rely exclusively on AI for content generation; the content of this report – including all investment theses, ratings, price targets and conclusions – has been independently reviewed and verified by the research analyst(s) to ensure accuracy and professional integrity.