Highlights
- Sizeable Landbank Supports Long-Term Growth: Eco World maintains a sizeable undeveloped landbank of 4,958 acres across key regions, providing a strong foundation for future township and industrial developments.
- Healthy Development Pipeline Enhances Earnings Visibility: The Group has a robust development pipeline comprising approximately RM5.8 billion of planned launches in Malaysia and AUD153 million in Australia, supporting future sales momentum and earnings visibility.
- Resilient Financial Performance: Despite lower revenue recognition from the absence of a one-off industrial land sale contribution, Eco World maintains a resilient operating profile, supported by contributions from its township and industrial developments.
- Stable Credit Profile: Debt has declined, with net gearing improving to 39%. Liquidity remains strong, supported by an interest coverage ratio of 6.2 times and cash-to-short-term debt ratio of 7.5 times.
- Recommendation: Given Eco World’s sizeable development pipeline, resilient operating performance, and robust liquidity position, supported by sustained industrial demand, we remain positive on Eco World’s outstanding bonds and recommend bondholders to hold.
Company Overview
Eco World Development Group Bhd (Eco World) is a listed property developer specialising in integrated township and industrial developments, primarily targeting the middle- to upper-income market segments. As of 4 August 2026, Eco World had a market capitalisation of approximately RM6.8 billion, making it one of the third larger listed property developers in Malaysia (Table 1).
Table 1: Market Capitalisation Comparison of Listed Malaysian Property Developers
|
Company |
Market Capitalisation (RM bn) |
|
IOI Properties Group |
20.9 |
|
Sime Darby Property |
9.3 |
|
Eco World Development Group |
6.8 |
|
Source: KLSE, iFAST Compilation. Data as of 4 August 2026 |
|
Industrial Growth Strategy and Sizeable Landbank Support Growth Prospects
Eco World continues to benefit from Malaysia's robust investment climate. In 1Q2026, Malaysia secured RM92.8 billion in approved investments, with foreign direct investment (FDI) accounting for 60.5% of total approvals, driven primarily by strong demand for data centres and cloud computing. Capitalising on this trend, Eco World completed the sale of its final two industrial parcels at QUANTUM Edge (49.6 acres) for RM281 million to KNBDC Malaysia Five Sdn Bhd, a regional hyperscale data centre operator, in April 2026. Following the transaction, cumulative industrial land sales to regional and global hyperscale operators across QUANTUM Edge, Eco Business Park I, and Eco Business Park V exceeded RM1.9 billion.
As of 31 May 2026, Eco World maintained a sizeable undeveloped landbank of 4,958 acres, primarily located in the Central region (61%), followed by the Southern region (37%) and Northern region (2%), providing a strong foundation for future developments (Table 2).
Table 2: Sizeable landbank supportive of growth prospects
|
Regional |
Original Landbank (acres) |
Remaining Landbank (acres) |
Remaining Landbank (%) |
|
Central (Klang Valley & Negeri Sembilan) |
6,794 |
3,020 |
61% |
|
Southern (Iskandar Malaysia) |
5,023 |
1,829 |
37% |
|
Northern (Penang) |
464 |
109 |
2% |
|
Total |
12,281 |
4,958 |
100% |
|
Source: Eco World, iFAST Compilations. Data as of 31 May 2026. |
|||
Strong Development Pipeline Enhances Earnings Visibility
The Group also continues to expand its industrial development footprint. Its maiden industrial development in Negeri Sembilan, Eco Business Park VII (estimated gross development value (GDV) of RM2.95 billion), has recorded RM796 million in sales since its launch in November 2025 (Table 3). Strategically located within the Malaysia Vision Valley 2.0 initiative, the project is positioned to support high-growth industries such as aerospace and advanced manufacturing.
As of 31 May 2026, Eco World achieved RM3.28 billion in sales, representing 82% of its revised FY2026 sales target of RM4.0 billion. The strong sales achieved during the first seven months of FY2026 reflect resilient demand across its developments and position the Group to potentially exceed its full-year sales target.
Looking ahead, Eco World has a healthy development pipeline comprising approximately RM5.8 billion of planned launches in Malaysia and AUD153 million in Australia (Table 3), which is expected to support continued sales momentum, future revenue growth, and earnings visibility over the medium term.
Table 3: Property Development Pipeline and Upcoming Launches
|
Project / Venture |
Location |
Estimated GDV |
Status Update |
|
Ongoing Property Project |
|||
|
Eco Business Park VII |
Negeri Sembilan |
RM 2.95 billion |
Maiden project in MVV 2.0; launched Nov 2025 with RM796 million in sales achieved in 7 months. |
|
Future Property Projects Pipeline |
|||
|
Eco Business Park 8 |
Kulai, Johor |
RM 3.75 billion |
SPA is now unconditional; preparing for launch by end 2026. |
|
Versione WKND (Partnership with JLand Group) |
Iskandar Malaysia |
RM1.0 billion |
Residential and commercial development; target launch 4Q 2026 |
|
Industrial Development (Partnership with JLand Group) |
Sedenak, Iskandar Malaysia |
RM1.0 billion |
Future industrial project; target launch 1Q 2028 |
|
Versione LIVN (Partnership with JLand Group) |
Sydney, Australia |
AUD 153 million |
First international residential apartment venture; target launch 4Q 2026 |
|
Source: Eco World, iFAST Compilations. Data as of 31 May 2026. |
|||
Resilient Sales Despite Lower Revenue
Eco World's revenue declined by 9.2% YoY to RM797 million in 2QFY26, mainly due to the completion of the sale of 123 acres of industrial land at QUANTUM Edge, Iskandar Malaysia, in 2QFY25, which had boosted revenue in the corresponding quarter of the previous year. Nevertheless, earnings remained supported by ongoing contributions from Eco World’s township and industrial developments across the Southern and Central regions. As a result, the operating profit margin edged down slightly to 26% in 2QFY26 from 27% a year earlier (Table 4).
Table 4: Eco World Profitability Indicators
|
2Q25 |
2Q26 |
Change |
|
|
Revenue (RM Million) |
878.2 |
797.4 |
-9.2% |
|
Core Operating Profit (RM Million) |
234.1 |
210.9 |
-9.9% |
|
Operating Profit Margin (%) |
27% |
26% |
-0.8% |
|
Source: Eco World, iFAST Compilations. Data as of 30 April 2026 |
|||
Strong cash generation supported by inventory monetisation
Operating cash flow strengthened significantly, supported by strong cash generation from inventories under development, which contributed an inflow of RM723.4 million in 1H FY2026, compared with RM376.3 million in 1H FY2025. The improvement was primarily driven by cash collections from the disposal of large industrial land parcels to regional and global data centre players, including 138.532 acres at Eco Business Park I, 57.081 acres at QUANTUM Edge and 58.187 acres at Eco Business Park V.
In addition, matured township and business park developments remained highly cash-generative, supported by progressive billings and collections that reduced inventory balances and released cash. The stronger cash conversion provides Eco World with greater internal funding capacity to support its active development and launch pipeline, while reducing reliance on external borrowings. This is reflected in the significant improvement in operating cash flow/net debt, which rose from 35% to 67% in 2QFY26, indicating stronger internally generated cash flow relative to the Group’s net debt position.
Strong Liquidity Supports Manageable Refinancing Risk
Eco World’s total debt declined slightly to RM4.7 billion, mainly due to repayment of borrowings, including the RM180 million redemption of Sukuk bonds. Consequently, net gearing improved to 39%, while the net debt-to-total property assets ratio declined to 28% (Table 5).
In addition, Eco World's liquidity profile remained robust. The interest coverage ratio improved from 5.7 times to 6.2 times, reflecting a stronger ability to service interest obligations from operating earnings. Meanwhile, the cash-to-short-term debt ratio increased from 4.6 times to 7.5 times, highlighting stronger short-term liquidity (Table 5).
Table 5: Eco World Key Credit Metrics
|
FY25 |
2QFY26 |
|
|
Operating Cash Flow/Net Debt (%)* |
35% |
67% |
|
Total Debt (RM Million) |
4,840.6 |
4,678.8 |
|
Interest coverage ratio (Times) |
5.7 |
6.2 |
|
Net Gearing Ratio (%) |
47% |
39% |
|
Net Debt/total property assets ratio (%) |
32% |
28% |
|
Cash to short term debt (Times) |
4.6 |
7.5 |
|
*Operating cash flow is based on the trailing 12-month period. Source: Eco World, iFAST Compilations. Data as of 30 April 2026 |
||
For credit metrics comparison, Eco World is compared against SP Setia and UEM Sunrise, given their similar business profiles as major Malaysian property developers with sizeable development landbanks and active property development pipelines.
As shown in Table 6, SP Setia and UEM Sunrise reported lower net gearing ratios (30% and 37%, respectively) and net debt-to-total property assets ratios (26% and 35%, respectively), suggesting that Eco World maintains a relatively more leveraged capital structure. However, Eco World outperformed both peers in terms of interest coverage (6.2 times versus 3.7 times and 1.9 times) and cash-to-short-term debt (7.5 times versus 1.8 times and 1.3 times), provide additional comfort on its debt servicing capability. The stronger interest coverage was supported by Eco World’s stronger earnings generation, underpinned by robust property sales and gains from the disposal of large industrial land parcels, which helped offset its relatively higher leverage.
Table 6: Peer Comparison
|
Eco World |
SP Setia |
UEM Sunrise |
|
|
Net Gearing Ratio |
39% |
30% |
37% |
|
Net Debt/total property assets ratio (%) |
28% |
26% |
35% |
|
Interest coverage ratio (times) |
6.2 |
3.7 |
1.9 |
|
Cash to short term debt (times) |
7.5 |
1.8 |
1.3 |
|
Source: Company Report, iFAST compilations. Data as of 30 April 2026 and 31 March 2026. |
|||
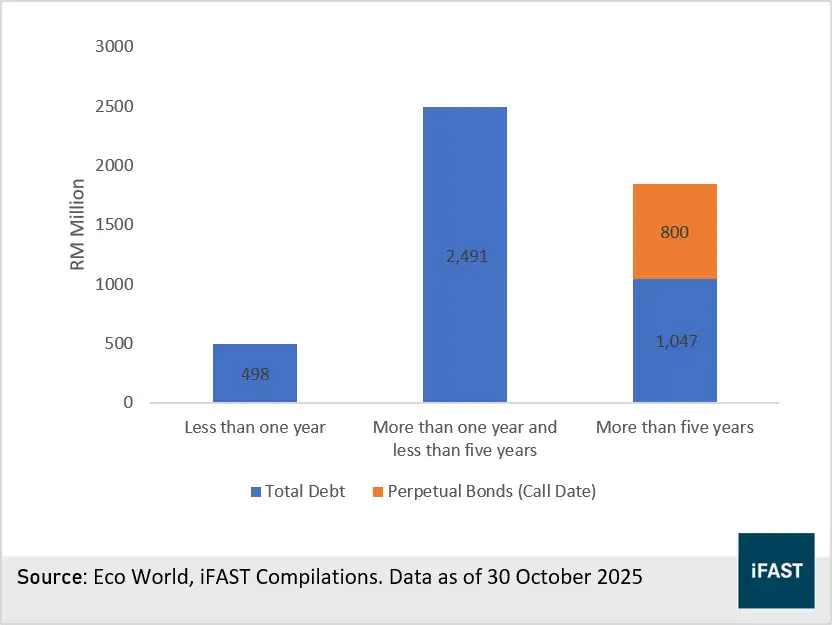
As shown in Chart 1, 52% of Eco World's total debt as of FY2025 (October 2025) is scheduled to mature in more than one year but within five years. We believe the refinancing risk remains manageable, supported by the group's strong liquidity position, with RM2.3 billion in cash as of FY25, as well as a healthy development pipeline comprising approximately RM5.8 billion of planned launches in Malaysia and AUD153 million in Australia, as highlighted above.
Chart 1: Eco World’s Debt Maturity Profile
Recommendation
Eco World maintains a healthy credit profile, supported by strong sales momentum, a sizeable landbank, and a robust development pipeline that provides earnings visibility. While leverage remains relatively higher compared with peers, strong liquidity, improving credit metrics, and manageable refinancing requirements provide comfort on its overall financial position. The Group’s strong “AA-” credit rating by MARC justifies the robust credit profile.
We recommend existing bondholders to hold and remain positive on Eco World’s outstanding bonds (Table 7).
Table 7: Eco World Bonds
|
Bond |
Year to Maturity |
Yield to Maturity |
Credit Rating (MARC) |
|
ECWMK 5.690% 29Oct2027 Corp (MYR) |
1.20 |
3.2% |
AA- |
|
ECWMK 4.900% 10Aug2028 Corp (MYR) |
1.98 |
3.4% |
AA- |
|
Source: Bondsupermart, iFAST Compilation. Data as of 14 August 2026 |
|||