


- Net revenue recorded double-digit growth in FY26. As of FY25/FY26 (Mar 2026), main net revenue increased 13% YoY to JPY1,962.6 billion, mainly driven by solid growth in Wholesale (up JPY104.3 billion YoY) and Investment Management (up 34% YoY) (Table 1).
- Strong growth in the Wholesale segment. Net revenue reached JPY1,162.2 billion, driven by record revenues in both Global Markets and Investment Banking, supported by a recovery in Japanese capital market activity (Table 1).
- Strong growth in Investment Management. Net revenue reached JPY258.5 billion, driven by growth in existing businesses and the expansion of international operations through acquisitions, with Assets under Management (AuM) reaching a record high of JPY136.9 trillion (~US$875 billion), supported by the acquisition of the public asset management business from Macquarie Group (Chart 1).
- CET1 Ratio Decline Driven by Acquisition and Basel III Finalisation Impact. The Common Equity Tier 1 (CET1) capital ratio declined from 14.5% in FY25 to 12.9% in FY26, mainly due to the acquisition of Macquarie’s U.S. and European public asset’s management business (JPY 275 billion), which increased risk-weighted assets (RWA), as well as the transition to Basel III finalisation methodologies, rather than credit deterioration.
- Capital Position Remains Strong Above Regulatory Minimum. Although the ratio declined to 12.9%, it remains well above the regulatory requirement of 7.7%. The CET1 ratio remains within Nomura’s internal target range of 11% to 14% and is expected to be supported by future earnings growth, which should help rebuild capital and support a gradual recovery in the ratio.
- Liquidity remained very strong. As of FY25/FY26, Nomura’s Liquidity Coverage Ratio (LCR) stood at 214.0%, slightly lower than 234.1% in FY24/FY25, mainly reflecting acquisition-related cash outflows from the Macquarie public asset management acquisition completed on 1 December 2025. Despite the slight decline, Nomura continues to maintain a robust liquidity position with JPY 10.7 trillion in liquidity resources, supporting financial stability during its current growth phase.
- Nomura remains a high-quality issuer. Nomura credit stable with strong earnings growth, while slightly weaker capital metrics mainly reflect acquisition-related RWA increase, with all buffers still comfortably above regulatory requirements.
- The bond currently still offers a compelling yield to maturity of 6% for investors seeking defensive AUD exposure with top-tier credit quality, while still providing a yield pickup of approximately 60 basis points over Australia’s Big 4 banks (Table 3).
- For further insight look at New on Bondsupermart Live – Nomura 5Y AUD bonds with yields of over 6%! | Bondsupermart
Table 1: Nomura’s Revenue Segment Breakdown
|
Business Segment |
FY24/FY25 (Mar 25) |
FY25/FY26 (Mar 26) |
|
|
Wealth Management |
Net Revenue (JPY Billion) |
433.6 |
487.9 |
|
Pre Tax Margin (%) |
38.3% |
41.8% |
|
|
Wholesale |
Net Revenue (JPY Billion) |
1,057.9 |
1,162.2 |
|
Pre Tax Margin (%) |
15.7% |
17.3% |
|
|
Investment Management |
Net Revenue (JPY Billion) |
192.5 |
258.5 |
|
Pre Tax Margin (%) |
46.5% |
34.2% |
|
|
Banking |
Net Revenue (JPY Billion) |
47.2 |
53.9 |
|
Pre Tax Margin (%) |
34.7% |
26.0% |
|
|
Source: Nomura, iFAST compilation, Data as of 31 March 2026 |
|||
Chart 1: Investment Management 's Assets under Management (AuM)
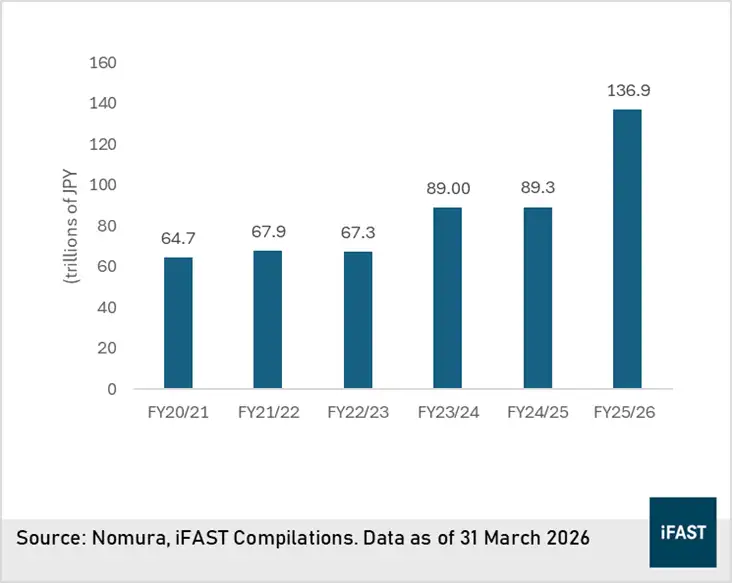
Table 2: Bond Comparison
|
Bond |
Yield to Maturity |
Year to Maturity |
Credit Rating (Fitch) |
Min / Sub investment |
|
6.0% |
4Y11M |
A- |
AUD 1,000/1,000 |
|
|
5.4% |
4Y9M |
AA- |
AUD 10,000/10,000 |
|
|
5.4% |
4Y8M |
AA |
AUD 10,000/10,000 |
|
|
Source: Bondsupermart, iFAST Compilations. Data as of 11 May 2026 |
||||


