- Nomura Holdings, Inc. (Nomura) has issued a 5-year bond with an yield to maturity of 6.1%, equivalent to Australia Government Securities + 140 basis points. The total issuance size was AUD 850 million, with proceeds on-lent to subsidiaries, including Nomura Securities Co., Ltd., for general corporate purposes.
- The bonds are senior unsecured and rated A- by Fitch with stable outlooks.
- Nomura is a Japan-based global financial services firm founded in 1925, providing services across wealth management, investment management, wholesale (global markets and investment banking), and banking. The group has a strong international presence, connecting Eastern and Western markets and serving a diverse global client base.
- It is listed on the Tokyo Stock Exchange (TSE) with a market capitalisation of approximately JPY 4.67 trillion (~US$29 billion) as of 17 April 2026. Nomura manages record Assets under Management (AUM) of JPY 134.7 trillion (~US$850 billion), further strengthened by the December 2025 acquisition of Macquarie’s U.S. and European public asset management business.
- For the nine months ended 31 December 2025 (3Q26), Nomura reported strong performance, with net revenue increasing 10% YoY to JPY 1,590.5 billion, mainly driven by structural reforms and solid growth in Wealth Management (up 19% YoY) and Wholesale (up 8% YoY) (Table 1).
- For Wealth Management segment delivered record recurring and flow revenues, supported by its expanding full-service platform, with higher assets under management (AUM) reaching JPY 28.1 trillion as of end-December 2025 (Chart 1), and net inflows of recurring revenue assets exceeding JPY 500 billion.
- The recurring revenue cost coverage ratio in Wealth Management increased from 63% in 3Q25 to 71% in 3Q26, indicating a stronger shift toward stable, fee-based income streams. This improves earnings visibility and reduces reliance on more volatile trading and transaction-related revenues.
- This milestone represents a key step toward the firm’s Management Vision 2030, which targets increasing recurring revenue assets to over JPY 37 trillion and raising the cost coverage ratio to above 80% by the 2030/31 fiscal year.
- For Wholesale segment reached record results in equities and investment banking, fueled by robust US derivatives activity and a recovery in Japanese capital market deals.
- The Common Equity Tier 1 (CET1) capital ratio declined from 16.3% in 3Q25 to 12.8% in 3Q26, but remained comfortably above regulatory requirements. The decline was mainly driven by the Macquarie acquisition, which increased risk-weighted assets (RWA) and impacted the regulatory capital base following changes in calculation methodology rather than credit deterioration.
- As of 3Q26, Nomura’s Liquidity Coverage Ratio (LCR) stood at 212.9%, slightly lower than 213.8% in 3Q25, mainly reflecting acquisition-related cash outflows from the Macquarie public asset management acquisition completed on 1 December 2025. Despite the slight decline, Nomura continues to maintain a robust liquidity position with JPY 10.8 trillion in liquidity resources, supporting financial stability during its current growth phase.
- Overall, we view that Nomura credit stable with strong earnings and wealth management growth, while slightly weaker capital metrics mainly reflect acquisition-related RWA increase, with all buffers still comfortably above regulatory requirements.
- At the yield to maturity of 6.1%, the issuance looks attractively priced against the same tenor bank issuances (table 2).
Table 1: Nomura’s Revenue Segment Breakdown
|
Business Segment |
FY24/25 3Q25 (Dec 2024) |
FY24/25 3Q26 (Dec 2025) |
|
|
Wealth Management
|
Net Revenue (JPY Billion) |
111.6 |
132.5 |
|
Pre Tax Margin (%) |
40.1% |
44.2% |
|
|
Wholesale
|
Net Revenue (JPY Billion) |
290.5 |
313.9 |
|
Pre Tax Margin (%) |
21.5% |
19.8% |
|
|
Investment Management
|
Net Revenue (JPY Billion) |
45.7 |
60.9 |
|
Pre Tax Margin (%) |
41.4% |
29.4% |
|
|
Banking
|
Net Revenue (JPY Billion) |
12.3 |
13.7 |
|
Pre Tax Margin (%) |
38.2% |
30.7% |
|
|
Source: Nomura, iFAST compilation, Data as of 31 December 2025 |
|||
Chart 1: Wealth Management of Recurring revenue assets
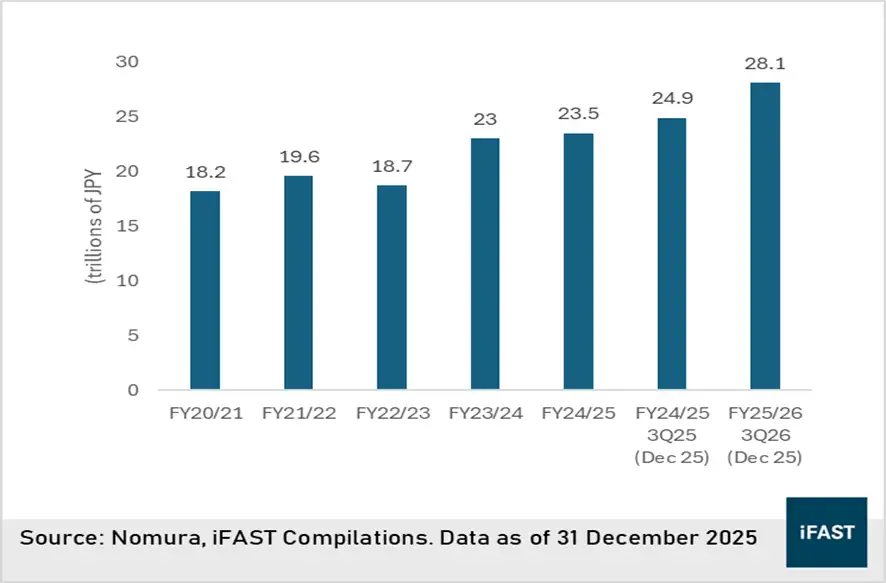
Table 2: Nomura’s Bond IPO
|
Bond |
Yield to Maturity |
Year to Maturity/Call |
Min / Sub investment |
Credit Rating (Fitch) |
|
6.1% |
5Y/- |
AUD1,000/1,000 |
A- |
|
|
5.3% |
4.8Y/- |
AUD10,000/10,000 |
AA- |
|
|
5.4% |
4.8Y/- |
AUD10,000/10,000 |
AA |
|
|
Source: Bondsupermart, iFAST Compilations. Data as of 17 April 2026. |
||||