Key Points
- The Group remains highly leveraged, with net debt-to-equity at 1.3x, mainly due to a significant decline in cash balances to RM583.3 million, driven by higher trade receivables and lower earnings.
- Despite the elevated leverage, we believe credit risk remains manageable, supported by the Group’s long-term PPAs with TNB and continued expansion of its power generation portfolio.
- Investors should remain mindful of the key risks, particularly potential plant outages and PPA renewal risk.
- Overall, we maintain a positive view on Malakoff and believe existing bondholders can continue to hold their bonds.
- In 1H26, Malakoff’s revenue declined by 19% YoY, while PBT fell by 32% YoY, primarily due to the unexpected outage at its Tanjung Bin Power (TBP) plant.
Overview
Malakoff Corporation Berhad is a sustainability-driven multinational specialising in energy generation and environmental solutions, with operations across Malaysia and international markets. As Malaysia’s largest independent power producer (IPP), the Group has a total power generation capacity of approximately 7,382 MW, including an effective equity capacity of 5,663 MW, alongside a growing renewable energy portfolio of 768 MW.
Beyond power generation, its subsidiary, Alam Flora Sdn Bhd , is one of Malaysia’s leading environmental solutions providers, managing approximately 6,200 tonnes of waste each day.
Through its three core business pillars — Malakoff Energy, Malakoff Green Solutions and Malakoff Environmental Solutions — the Group is accelerating its transformation towards a more sustainable energy future and circular economy, while supporting Malaysia’s aspirations to achieve carbon neutrality.
Malakoff’s shareholder base comprises major institutional investors, led by MMC Corp (38.45%), Employees Provident Fund (18.71%), Permodalan Nasional Berhad (11.66%), Urusharta Jamaah Sdn Bhd (6.61%) and Kumpulan Wang Persaraan (6.52%).
Business Model – Power Purchase Agreements (PPAs) with TNB
On top of that, through its subsidiary, Alam Flora Sdn Bhd, Malakoff is a major player in Malaysia’s waste management industry. The group manages approximately 4,386 tonnes of waste daily and plays a significant role in providing solid waste management and public cleaning services across areas such as Kuala Lumpur, Putrajaya, and Pahang. These services are carried out under a 22-year concession agreement with the Malaysian government, which commenced on 1 September 2011 and will run until 31 August 2033.
Overall, Malakoff’s business can be categorised into two main areas:
- Power Generation – Includes power generation business and water desalination services.
- Waste Management and Environmental Services – Includes waste management services and environmental services
Extended PPAs; Ongoing Expansion Across Malaysia
As mentioned, Malakoff’s power generation business is largely conducted under Power Purchase Agreements (PPAs) with TNB. The Group has recently secured extensions to the PPAs for several of its power plants, providing greater earnings visibility and enhancing the stability of its future cash flows.
Table 1: Existing thermal plants
|
Plant |
Location |
Type |
Gross Capacity |
Malakoff Stake |
Effective Capacity |
PPA Expiry |
|
Tanjung Bin Power (TBP) |
Johor |
Coal |
2,100 MW |
90% |
1,890 MW |
2031 |
|
Tanjung Bin Energy (TBE) |
Johor |
Coal |
1,000 MW |
100% |
1,000 MW |
2041 |
|
Segari Energy Ventures (SEV) |
Lumut, Perak |
CCGT (gas) |
1,303 MW |
93.75% |
1,221.6 MW |
31 Dec 2029 (extension signed 18 May 2026) |
|
GB3 |
Lumut, Perak |
OCGT (gas) |
429 MW |
75% |
321.75 MW |
31 Dec 2029 (extension signed 18 May 2026) |
|
Prai Power |
Pulau Pinang |
CCGT (gas) |
350 MW |
100% |
350 MW |
31 Mar 2030 (extension signed Mar 2026) |
|
Kapar Energy Ventures |
Selangor |
Coal/gas |
2,200 MW |
40% (associate) |
880 MW |
2029 |
Source: Company Reports, iFAST Compilations. Data as of 30 June 2026.
There are also several projects and power plants currently under development:
Table 2: Projects in the pipeline
|
Projects |
Capacity |
COD |
|
Small Hydro (Kemubu, Kuala Geris, Serasa) |
84 MW |
2027 |
|
LSS 5+ (Larut & Matang, Perak) |
470 MW |
2028 |
|
SAFE-T |
35 TPD |
2028 |
|
LSS Sarawak (Bintulu) |
100 MW |
2028 |
|
WTE Sg Udang |
1,056 TPD / 22 MW |
2029 |
|
PD Gen 2 (PD Complex) |
1,400 MW |
2031 |
|
SEV Gen 2 (Segari Complex) |
1,400 MW |
2032 |
Source: Company Reports, iFAST Compilations. Data as of 30 June 2026.
Financial Highlights – 1H26
Malakoff recently released its 1H26 financial results. During the period, the Group’s revenue declined by 19% YoY to RM3,283.7 million from RM4,047.6 million in 1H25. The decline was primarily attributable to lower energy and capacity payments from Tanjung Bin Power (TBP), following the steam turbine generator rotor failure at Unit 30 and a generator hydrogen cooler leakage at Unit 20.
Consequently, the Group’s profit before tax (PBT) fell by approximately 32% YoY to RM97.2 million, mainly due to the unscheduled outages at TBP.
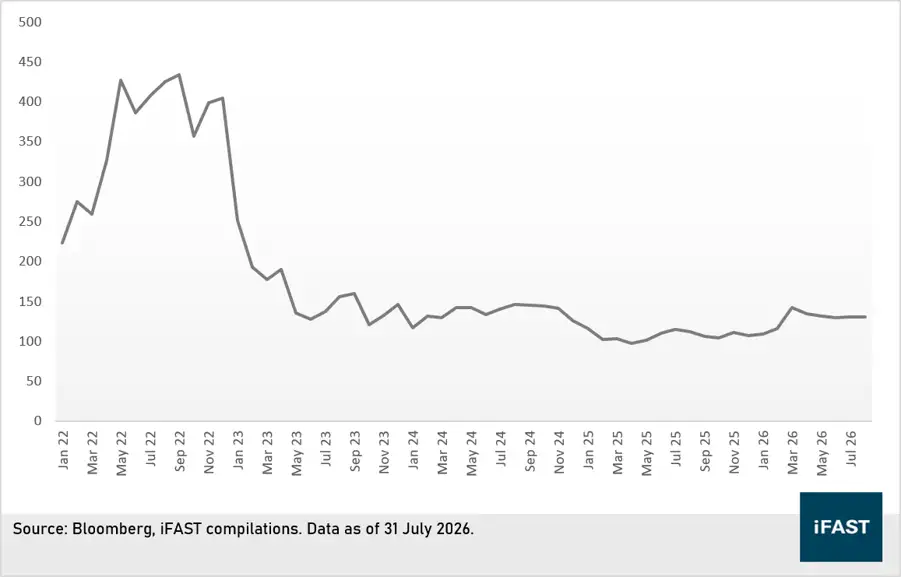
Nevertheless, we believe the Group’s underlying business performance remains relatively healthy, with its EBITDA margin holding at 26% in 1H26. Historically, the Group’s EBITDA margin has generally remained within the 20–27% range, except in 2023, when profitability was significantly affected by a mismatch between fuel costs and energy payments. This was largely due to a sharp decline in global coal prices in 2023, following the exceptionally high levels recorded in 2022 amid the Russia–Ukraine war.
Since then, the Group’s EBITDA margin has broadly moved in tandem with global coal prices, which have since stabilised from their 2022 peak.
Overall, while PBT declined by 32% YoY in 1H26, we do not view this as a sign of business deteriorating, given that the weaker performance was primarily attributable to temporary and unexpected plant outages.
Furthermore, management has indicated that Tanjung Bin Power is expected to resume operations by 3Q26, which should provide some recovery in earnings in the second half of the year.
Table 3: Profitability indicators (RM million, unless otherwise stated)
|
RM mil |
2022 |
2023 |
2024 |
2025 |
1H2025 |
1H2026 |
|
Revenue |
10,355.2 |
9,067.0 |
8,969.6 |
7,209.3 |
4,047.6 |
3,283.7 |
|
EBITDA |
2,284.9 |
1,027.6 |
1,863.8 |
1,626.7 |
847.1 |
761.2 |
|
(Loss)/Profit before tax |
736.8 |
(954.9) |
458.3 |
175.7 |
143.4 |
97.2 |
|
TTM EBITDA margin (%) |
22% |
11% |
21% |
23% |
20% |
24% |
|
TTM EBIT margin (%) |
9% |
-1% |
9% |
7% |
8% |
6% |
Source: Company Reports, iFAST Compilations. Data as of 30 June 2026.
Malakoff’s revenue is closely correlated with global coal prices. As shown in Chart 1, the sharp increase in coal prices in 2022 also benefited Malakoff, resulting in higher revenue. This is primarily because a significant portion of the Group’s revenue is derived from energy payments received by its coal-fired power plants, which are calculated based on the Applicable Coal Price (ACP).
As such, movements in global coal prices have a direct impact on the ACP. When coal prices decline, the ACP is adjusted downwards, resulting in lower energy payments and, consequently, lower overall revenue for the Group.
Chart 1: Newcastle coal price (USD/MT)
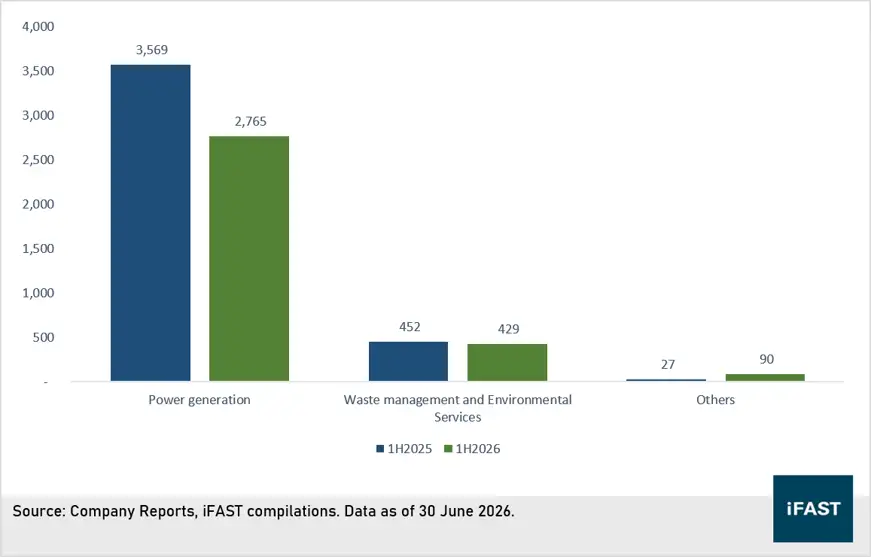
If we delve deeper into the segmental breakdown, the Power Generation segment remained the Group’s largest revenue contributor, although revenue declined by 22.5% YoY to RM2,765 million in 1H26. Meanwhile, the remaining two segments remained relatively stable, recording only marginal movements during the period.
Chart 2: Segmental breakdown (revenue – RM million)
Malakoff Remains Highly Leveraged; Credit Risk Remains Manageable
In 1H26, Malakoff remained highly leveraged, with its net debt-to-equity ratio rising to 1.31x from 1.09x in FY25. The increase in gearing was primarily driven by a significant decline in cash balances, which fell to RM583.3 million from RM1,824.2 million as at December 2025. This was mainly attributable to a ~RM1.2 billion increase in trade receivables from Tenaga Nasional Berhad (TNB), coupled with lower earnings contribution following the temporary plant disruptions. These factors subsequently weighed on the Group’s operating cash flow. If we take the RM1.2 billion into consideration, the adjusted net debt-to-equity ratio would remain relatively stable at around 1.09x.
We do not view the higher trade receivables as a major concern, as the increase was largely attributable to June invoices, which remained within the Group’s standard 30-day collection period.
Despite this, the Group still remained in positive operating cash flow during the period; however, free cash flow turned negative, mainly due to higher trade receivables, which weighed on operating cash flow.
Meanwhile, the interest coverage ratio (TTM) moderated slightly to 3.9x in 1H26. Nevertheless, this remains a comfortable level, indicating that the Group continues to generate sufficient earnings to service its interest expenses despite the temporary plant outages.
Overall, while Malakoff remains highly geared, we believe its credit risk remains relatively low, supported by several factors. First, the Group’s power generation business is underpinned by long-term PPAs, with TNB as the key off-taker, providing relatively stable and predictable cash flows. Second, a higher level of gearing is common for a capital-intensive business such as power generation, given that the development and construction of power plants require substantial upfront investment, often running into billions of Ringgit and taking several years to complete.
Table 4: Credit metrics (RM million, unless otherwise stated)
|
RM Mil |
2022 |
2023 |
2024 |
2025 |
1H2026 |
|
Short-term Debt |
972.2 |
926.7 |
752.1 |
786.9 |
885.0 |
|
Long-term Debt |
7,771.2 |
7,878.4 |
7,016.1 |
6,556.7 |
6,752.5 |
|
Cash and cash equivalents |
1,539.6 |
2,571.0 |
1,375.4 |
1,452.4 |
583.3 |
|
Operating cash flow |
59.56 |
1,736.53 |
1,345.90 |
1,824.21 |
116.80 |
|
Free cash flow |
(241.65) |
1,434.90 |
879.05 |
1,174.62 |
(228.48) |
|
Cash to short term debt ratio (x) |
1.58 |
2.77 |
1.83 |
1.85 |
0.66 |
|
Interest coverage ratio (x) |
4.4 |
2.1 |
4.3 |
4.0 |
3.6 |
|
Net debt-to-equity ratio (x) |
1.08 |
1.12 |
1.15 |
1.09 |
1.31 |
|
Total Assets* / Total Debt (x) |
1.94 |
1.81 |
1.92 |
1.88 |
1.94 |
|
*Includes only assets that can be sold and converted into cash. |
Source: Company Reports, iFAST Compilations. Data as of 30 June 2026.
Debt Maturity Profile
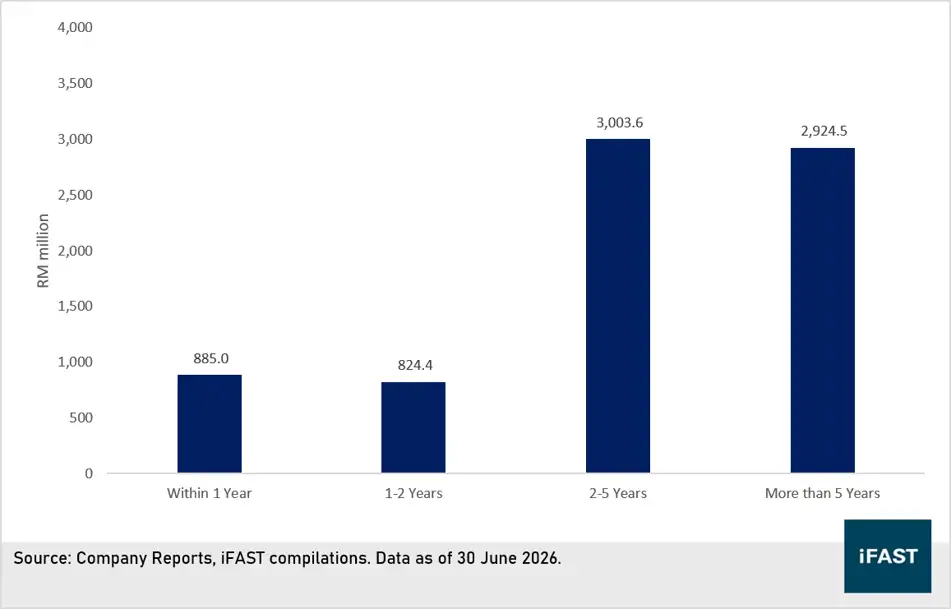
Another factor supporting our view that Malakoff’s credit risk remains manageable is its debt maturity profile. Despite the Group’s elevated borrowing levels, its debt maturities are well spread across a longer tenure, reducing the risk of significant refinancing or repayment pressure in any single year. As such, we believe Malakoff should remain well positioned to meet its annual principal repayment obligations.
Chart 3: Debt maturity profile (RM million)
Risks
Plant outages / disruptions: Any unplanned outage or prolonged disruption at Malakoff’s power plants could adversely affect the Group’s revenue and earnings, particularly through lower energy and capacity payments.
PPA renewals: As Malakoff’s power generation business is conducted under PPAs with TNB, the non-renewal of an existing PPA could have a material impact on the Group’s future earnings and cash flows.
However, given that Malakoff’s power generation business is conducted under PPAs, one of the key risks for investors is PPA renewal risk, particularly the possibility of TNB choosing not to renew the Group’s PPAs upon expiry.
At this juncture, however, we believe this risk has been largely mitigated, given the expected structural growth in Malaysia’s electricity demand, particularly from the rapid expansion of data centres. According to the Ministry of Energy Transition and Water Transformation, electricity consumption by the data centre sector is expected to increase significantly, accounting for 31% of total electricity consumption, equivalent to 73,274 GWh by 2035, compared with 7% or 10,544 GWh in 2026.
Against this backdrop, we believe there is a strong likelihood that TNB will continue to renew its PPAs with Malakoff, particularly as demand for reliable baseload power is expected to remain robust. This is also supported by Malakoff’s continued expansion of its power generation footprint in Malaysia, signalling the Group’s confidence in the long-term growth prospects of the domestic power market.
Our view
We are of the view that Malakoff’s overall fundamentals, including its earnings and credit profile, remain healthy despite the weaker earnings recorded in 1H26 and its elevated leverage. We believe the Group’s debt repayment capacity and earnings visibility will continue to be supported by its long-term PPAs with TNB, which provide relatively stable and predictable cash flows.
Overall, we maintain a positive view on Malakoff at this juncture. Existing bondholders may continue to hold their bonds, as we believe the Group’s underlying credit profile remains sound and the near-term risks are manageable.
Alternatively, investors may consider other MYR-denominated bonds offering a higher yield pickup (refer to Table 6).
Table 5: Recommended Bonds
|
Bonds |
Yield to Maturity |
Years to Maturity |
Credit Rating (MARC) |
Min / Sub |
|
4.02 % |
5Y6M |
AA- |
RM 250k /250k |
|
|
4.27% |
8Y6M |
AA- |
RM 250k /250k |
Source: BSM, iFAST Compilations. Data as of 08 September 2026.
Table 6: Other recommendations
|
Bonds |
Yield to Maturity |
Years to Maturity |
Bond Credit Rating (MARC) |
Min / Sub |
|
6.10% |
5Y (Years to call) |
N.R |
RM 25k / 5k |
|
|
5.10% |
2Y11M |
A+ |
RM 5k / 5k |
Source: BSM, iFAST Compilations. Data as of 08 September 2026
For specific disclosure, at the time of publication of this report, IFPL (via its connected and associated entities) the analyst who produced this report hold NIL positions in the abovementioned securities.