


Highlights:
- Far East Horizon adopts a financial leasing business model, its main source of profits comes from earning the “interest spread”. This type of business model is relatively stable, and quite suitable for bond investors. The Group had a consistent growth in revenues and profits, and its main operating indicators (net interest margin and net interest spread) were also gradually improving.
- Although the Group's leverage ratio is relatively high, this is a common phenomenon in the industry. In fact, the Group’s actual liquidity pressure is not huge.
- The Group’s short-to-medium term bonds place investment value. Several USD bonds are giving a yield of 5.6% to 6.6%. Also, it has a RMB bond due in 2024, which has a yield to maturity of 7.0%.
The leasing industry Far East Horizon engages in has been changing slowly, mainly due to the leasing companies’ medium-to-longer term lease terms, which generate a stable source of revenues. On the other hand, the key expense of this type of company is the interest expense. The future interests are often able to be roughly calculated before borrowing. Based on these factors, the company’s financial status generally tends to be stable, meaning that its business model is quite suitable for bond investors.
In fact, Far East Horizon’s latest 2021 annual result also reflects the above industry characteristics. Its operating indicators are quite decent. Next, let’s dive into the Group’s latest development.
Earning “Interest Spread” becomes the Group’s Main Source of Profits
The Group adopts a financial leasing business model, which is to earn the “interest spread” through acquiring assets (usually with a longer service life) by debts and own funds, and then leasing the assets to lessees.
Under the normal terms of financial leasing, before the lease expires, the Group still has the ownership of the assets until the end of the lease. Then, the asset ownership will be transferred to the leaseholders. The advantage of this business model is that the Group has the right to get back the asset if the lessees default during the leasing period. Not only does this ensure the benefits of the Group, but the lessees also do not need to pledge a lot of collateral to use the assets.
Some people might believe that the Group would suffer losses under this business model, as it has to transfer the asset right to lessees after the lease contract is expired. Actually, financial leasing is different from operating leasing. Under financial leasing, the lessee pays the “rent” by instalment. Part of the “rent” comes from the purchase price of the asset, and the remaining part can be viewed as the lessees’ financing cost or the extra cost of instalment payment.
In other words, the Group first contributes the capital to acquire the asset for a lessee, and then the lessees can acquire the asset by instalment payment. During the payment process, the Group can earn the asset yield while the main cost is interest expense. Thus, we can see that earning the “interest spread” becomes the Group’s main source of profit.
The Group had Consistent Growth in Revenues and Profits, with Main Operating Indicators Gradually Improving
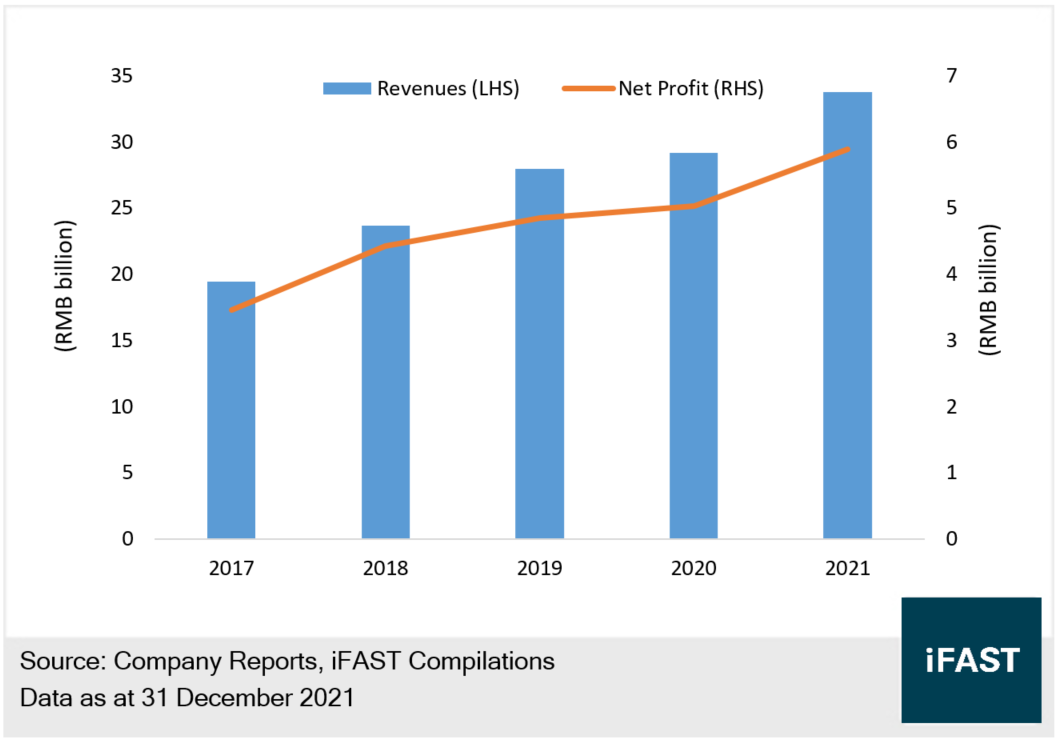
In 2021, Far East Horizon’s total revenues were RMB 33.79 billion, increased by 15.8% YoY. The net profit increased 17.2% to RMB 5.9 billion, mainly owing to the increasing size of interest-earning assets and the widening net interest spread. As shown in Chart 1, the Group had consistent growth in revenues and profits over the past few years. The overall performance is quite decent.
Chart 1: The Group’s revenues and profits over the past five years
To evaluate the Group’s operating efficiency, we can take references from its net interest margin and net interest spread. Net interest margin is used to estimate capital efficiency, which is close to the concept of return on assets. On the other hand, net interest spread is used to measure the difference between the Group’s cost of borrowing and investment yield, which is close to the concept of gross margin.
As shown in Table 1, in 2021, the Group’s net interest margin and net interest spread increased to 4.1% and 3.2% respectively. The profitability is gradually improving. If we break the net interest spread into two elements, we can learn that the while average yield of interest-earning assets keeps increasing, the average borrowing cost was gradually dropping. These reflect the Group’s overall asset quality is uplifted, together with stronger demand for SMEs’ financial leasing needs and the Group’s solid financing ability.
Table 1: The Group’s Main Operating Indicators
2019 | 2020 | 2021 | |
Net Interest Margin | 3.7% | 3.8% | 4.1% |
Net Interest Spread (A-B) | 2.5% | 2.9% | 3.2% |
- Average Yield of Interest-earning Assets (A) | 7.4% | 7.5% | 7.6% |
- Average Cost of Borrowing (B) | 5.0% | 4.6% | 4.4% |
Sources: Company’s Reports, iFAST compilations Data as at 31 December 2021 | |||
High Gearing is a Common Phenomenon in the Industry; The Group’s Actual Liquidity Pressure is Not Huge
Regarding the credit profile (see Table 2), as at the end of 2022, the Group’s liability to asset ratio was up to 86.4%, which is better than two years ago. Although the Group’s high gearing ratio appears to be high, purchasing assets aggressively for leasing is a common phenomenon in this industry.
The Group’s current non-performing asset ratio was as low as 1.1%, showing that the asset quality is good and the leasing default situation is expected to be under control. The provision coverage ratio was high at 242%. Despite a small decline compared to the past, the provision coverage ratio is still higher than the industry average. The risk response ability is relatively stronger.
Table 2: The Group’s Main Credit Indicators
2019 | 2020 | 2021 | |
Total Assets (RMB billion) | 260.6 | 299.9 | 335.9 |
Total Debts (RMB billion)* | 176.7 | 211.6 | 235.0 |
Liability to Asset Ratio (%)* | 87.8% | 87.7% | 86.4% |
Non-performing Asset (%) | 1.1% | 1.1% | 1.1% |
Provision Coverage Ratio (%) | 246% | 252% | 242% |
*Include perpetual debts Sources: Company’s Reports, iFAST compilations Data as at 31 December 2021 | |||
It is highlighted that the Group’s cash level is low at RMB 15.7 billion, and it faces short-term debts of RMB 103.9 billion. It seems to have a greater liquidity pressure. Nevertheless, in general, banks and financial institutions continuously allow financial leasing companies to repay their debts by refinancing, so the key is whether the Group’s refinancing ability can be maintained.
Considering the Group’s assets are loans and account receivables, the Group can get back the asset if the lessee defaults. Also, the securitization of leasing assets can be another financing way for the Group. Besides, the Group’s large shareholder is Sinochem Holdings (which holds the Group’s 22% stake). Its background as a central enterprise benefits the Group when negotiating refinancing with banks and financial institutions. In addition to its investment-grade issuer rating, it will be easier for the Group to raise capital in the secondary market. As such, we believe the Group’s refinancing ability is relatively strong, and its actual liquidity pressure is not huge.
Short-to-Medium Term Bonds place Investment Value, with USD Bonds Yielding at 5.6% to 6.6%
In the article “When the Average Yield of Investment Grade Bonds is Close to 5%”, we mentioned the investment grade bond yields have been risen in recent months, including Far East Horizon, of which the current issuer rating and bond rating are both BBB- (S&P), belonging to investment-grade level.
Due to the Group’s outstanding refinancing ability and its improving outlook on business and profitability, we believe that the short-to-medium term bonds place investment value. Currently, the Group’s USD bonds matured within two to three years are yielding at 5.6% to 6.6% (Table 3), higher than BBB grade peers’ bond yield average of around 4% to 5% level with a similar maturity date. Apart from that, the Group has a CNY bond due in 2024, which has a yield to maturity of 7.0%. Investors can pay attention to them.
Table 3: Far East Horizon’s Bonds
Bond Name | Currency | Years to Maturity | Ask Price (Investor Buys) | Yield to Maturity |
USD | 1.8 | 94.9 | 5.6% | |
USD | 2.8 | 93.2 | 6.1% | |
USD | 4.4 | 91.4 | 6.7% | |
FRESHK 4.700% 09FEB2024 CORP (CNH) (Bond Express Member) | CNH | 1.7 | 96.2 | 7.0% |
Source: Bondsupermart Data as at 20 May 2022 | ||||
Related Risks
There is an economic growth slowdown in Mainland China, which might result in a higher non-performing asset ratio or bad debt provision as well as a decline in the yield of interest-earning assets. This probably affects the operating performance.
To a large extent, The Group’s repayment ability and growth are based on its stronger refinancing ability. If the financing activities shrink, this will adversely affect the performances of these two parts.
Conclusion
Far East Horizon adopts a financial leasing business model, its main source of profits comes from earning the “interest spread”. This type of business model is relatively stable, and quite suitable for bond investors. The Group had a consistent growth in revenues and profits, and its main operating indicators (net interest margin and net interest spread) were also gradually improving.
Although the Group's leverage ratio is relatively high, this is a common phenomenon in the industry. In fact, the Group’s actual liquidity pressure is not huge.
The Group’s short-to-medium term bonds place investment value. Several USD bonds are giving a yield of 5.6% to 6.6%. Also, it has a RMB bond due in 2024, which has a yield to maturity of 7.0%.
Declaration: For specific disclosure, at the time of publication of this report, IFPL (via its connected and associated entities) holds positions in FRESHK 4.700% 09Feb2024 Corp (CNH), and the analyst who produced this report holds a NIL position in the abovementioned securities.









