Highlights:
- Phoenix Group exhibits strong operational performance. The management expects mid-single-digit growth in operating cash generation, with business performance surpassing prior expectations. The Group’s annual total cash generation and excess cash will be used to reduce debt, as it is currently in a phase of using cash flow for debt reduction.
- Phoenix Group maintains robust capital buffers and liquidity, with its credit profile expected to improve over time, which is favourable to bondholders.
- Investors could consider Phoenix Group’s USD and GBP bonds, which have certain attractiveness, providing yield to maturity of 4.7% to 6.3%.
In the current environment of tight credit spreads, finding a high-credit-rated bond with a yield exceeding 5% is not an easy task. For instance, the popular HSBC bonds with two- to three-year tenors have seen yields drop below 5%. So, can investors still find investment opportunities comparable to HSBC bonds in today’s market?
The answer is yes! The bonds issued by Phoenix Group, another player in the UK financial sector, offer higher yields. Like HSBC, Phoenix Group holds an issuer credit rating of A+ (Fitch), placing it in the high investment-grade category with considerable stability.
Phoenix Group is a major UK insurance company, primarily engaged in wealth management, pension management, retirement solutions, and asset management. Its assets under administration (AUA) total £290 billion. The Group is listed on the London Stock Exchange (ticker: PHNX.LN) with a market capitalization of approximately £5.83 billion.
We previously introduced this issuer in “Idea of the Week: Over 7% Yield! Phoenix Group—UK Pension Management with Cash Flow Grows”. Now, let us explore its latest developments, operational performance, credit profile and bond investment opportunities.
Strong Operational Performance, Using Cash Flow for Debt Reduction
In 2024, Phoenix Group’s operating cash generation reached £1.4 billion, a significant 22% year-on-year increase (see Chart 1). This milestone was achieved ahead of the Group’s target to reach £1.4 billion by 2026, reflecting robust operational performance.
Chart 1: Phoenix Group’s Key Operational Metrics
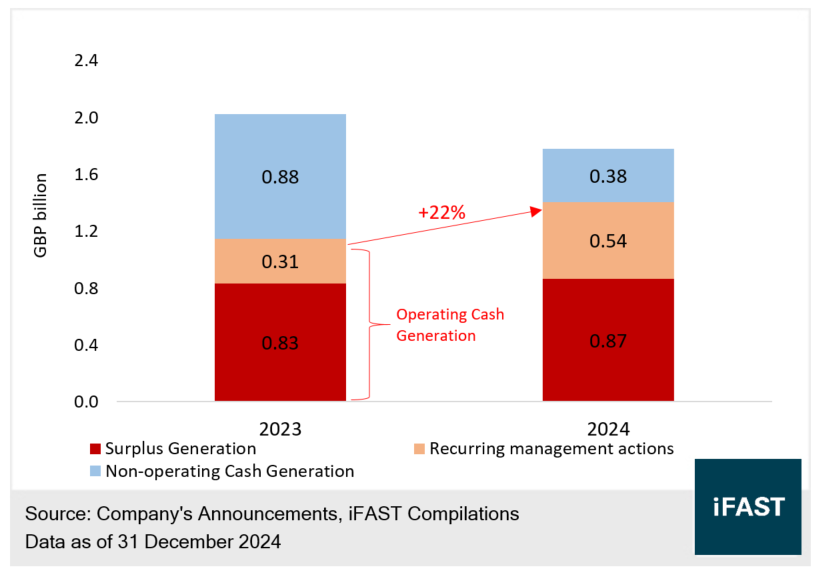
Operating cash generation comprises two components: surplus generation and recurring management actions. The former refers to excess cash generated from business operations and compliance requirements during the period, while the latter involves regular steps taken by the Group to maintain efficiency and profitability. Both are part of the Group’s daily operations, contributing to stable cash flows to the Group.
Total cash generation includes both operating and non-operating cash generation. Non-operating cash generation comes from one-off actions (e.g., asset sales, capital release, capital restructuring, or insurance portfolio adjustments). While being less stable and predictable, it provides additional cash flow to the Group.
In 2024, Phoenix Group’s total cash generation (previously referred to as “cash generation by operating companies”) reached a high of £1.78 billion. Although this figure represents a decline from 2023, the drop is primarily due to a high base effect from non-operating cash generation, not a deterioration in operational performance.
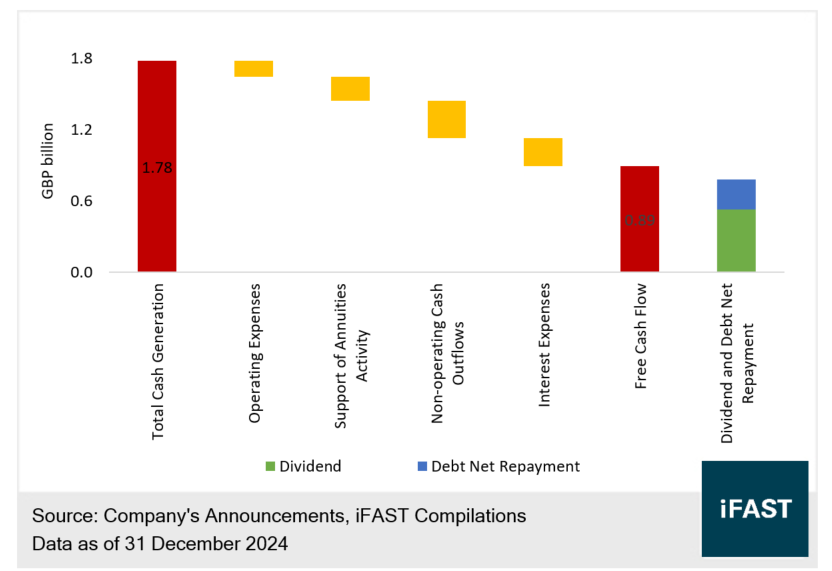
The total cash generation can be allocated to settling operational expenses, debt repayment, interest payments, shareholder returns, new investments or acquisitions—similar to operating cash flow in typical companies. As such, it directly impacts the Group’s debt repayment capacity and reflects its operational performance.
The management estimates mid-single-digit growth in operating cash generation and has raised its three-year cumulative total cash generation forecast (2024–2026) from £4.4 billion to £5.1 billion. This reflects better-than-expected operational performance and suggests that total cash generation in 2025 and 2026 will remain at a high level of £1.65 billion annually.
Additionally, the management notes that the Group can consistently generate at least £300 million in excess cash annually (defined as total cash generation minus dividends, interest, operating expenses and corporate optimization costs). This excess cash will be used to reduce debts, implying that the Group’s debt levels could decrease by approximately £300 million per year.
In fact, in 2024, the Group generated approximately £890 million in free cash flow, with about 60% allocated to dividend payments and 30% used for debt reduction (see Chart 2), aligning with management’s strategy of using cash flow for debt reduction.
Chart 2: Cash Flow Performance and Free Cash Flow Allocation in 2024
Robust Capital Buffers and Liquidity
In terms of credit profile, as shown in Figure 3, Phoenix Group’s shareholder capital coverage ratio (eligible own funds/solvency capital requirement) slightly declined to 172%. This was primarily due to the Group repaying approximately £250 million in debt, resulting in a 5% drop in the coverage ratio (from 177% to 172%). Nevertheless, this ratio remains at the high end of the Group’s guidance range of 140% to 180%, indicating robust capital buffers and liquidity.
Chart 3: Phoenix
Group’s Shareholder Capital Coverage Ratio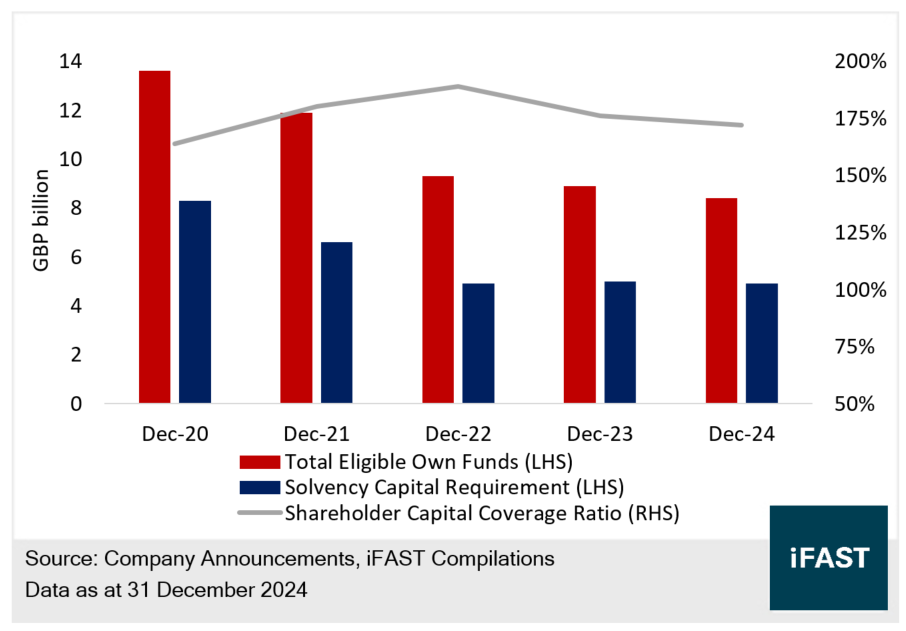
Compared to peers (see Table 1), Phoenix Group’s shareholder capital coverage ratio is below the peer average, and its leverage ratio is higher than the peers’. This reflects a broader industry trend where peers typically adopt more conservative capital allocation strategies, preferring higher coverage ratios and lower leverage ratios. Phoenix Group, however, stands out as a unique player among its peers.
Table 1: Peers’ Shareholder Capital Coverage and Leverage Ratios
|
|
Shareholder Capital Coverage Ratio (%) |
Adjusted Leverage Ratio (%) |
|
Phoenix Group |
172% |
36% |
|
Legal & General |
232% |
26% |
|
Aviva |
203% |
29% |
|
Just Group |
204% |
32% |
|
Admiral Group |
196% |
20% |
|
Direct Line Insurance Group |
195% |
22% |
|
*Adjusted Leverage Ratio = Total Debt / (Total Debt + Total Equity + Contractual Service Margin), the lower is better Sources: Bloomberg Finance L.P., Company Reports, iFAST Compilations Data as at 31 December 2024 |
||
However, Phoenix Group aims to reduce its leverage ratio to below 30% by the end of 2026, primarily by using up to £850 million in excess cash for debt reduction, targeting a 6% decrease in the leverage ratio. We believe the Group has ample room to achieve this goal, as it can consistently generate at least £300 million in excess cash annually and, if necessary, redirect a portion of dividend payouts for debt reduction.
Even if Phoenix Group is unwilling to significantly reduce shareholder returns to accelerate debt reduction, we believe its leverage ratio will continue to trend downward over the next few years. This suggests an improving credit profile, which is favourable to bondholders.
USD and GBP Bonds have Certain Attractiveness, with Yields to Maturity of 4.7% to 6.3%
Phoenix Group currently holds an issuer rating of A+ (Fitch), classifying it as a high investment-grade issuer. However, as its bonds are subordinated with lower repayment priority, they carry a bond rating of BBB+ (Fitch), which is lower than the issuer rating but still within the investment-grade range.
As shown in Table 2, Phoenix Group’s USD and GBP bonds have certain attractiveness, with many providing yield to maturity of 4.7% to 6.3%, which is worth investors’ consideration.
Table 2: Phoenix Group’s USD and GBP Bonds
|
Bond Name |
Currency |
Tenor (Years) |
Ask Price (Investors Buy) |
Yield to Maturity |
|
PHNXLN 6.625% 18Dec2025 Corp (GBP) |
GBP |
0.7 |
100.9 |
5.0% |
|
PHNXLN 4.016% 13Jun2026 Corp (GBP) |
GBP |
1.1 |
99.2 |
4.7% |
|
PHNXLN 5.375% 06Jul2027 Corp (USD) |
USD |
2.2 |
99.8 |
5.5% |
|
PHNXLN 5.867% 13Jun2029 Corp (GBP) |
GBP |
4.1 |
100.5 |
5.7% |
|
PHNXLN 5.625% 28Apr2031 Corp (GBP) |
GBP |
6.0 |
96.9 |
6.3% |
|
Sources: Bondsupermart Data as at 25 April 2025 |
||||
This bond does not have a call date, nor does it have a coupon reset date. But there are two features of this bond, namely deferred interest payment and extendable tenor. If the regulatory authority makes a judgement that the Group falls into operation crisis, the Group might need to suspend paying coupons (and accumulate the coupons until the regulatory authority approves it to pay coupons again) or/and delay the maturity date of the bond. Under these circumstances, the bond is not still considered as defaulted.
Compared to bonds issued by HSBC and Standard Chartered (see Table 3), Phoenix Group’s USD bond offers 50 bps to 70 bps yield pick-up, due to lower bond rating compared to bonds issued by HSBC and Standard Chartered and its subordinate nature, while this represents certain attractiveness of Phoenix Group’s USD bond. Investors who seek a stable income could consider it.
Table 3: USD Bond Comparison
|
Bond Name |
Issuer |
Issuer Rating (S&P / Fitch) |
Bond Rating (S&P / Fitch) |
Seniority |
Ask Price |
Yield To Maturity |
|
PHNXLN 5.375% 06Jul2027 Corp (USD) |
Phoenix Group |
N.R / A+ |
N.R / BBB+ |
Subordinate |
99.8 |
5.5% |
|
HSBC 5.887% 14Aug2027 Corp (USD) |
HSBC |
A- / A+ |
A- / A+ |
Senior Unsecured |
101.3 |
4.8%* |
|
STANLN 6.187% 06Jul2027 Corp (USD) |
Standard Chartered |
BBB+ / A |
BBB+ / A |
Senior Unsecured |
101.4 |
5.0%* |
|
*Involving coupon reset, assuming the coupon reset occurs, the Treasury yield is the currently projected yield, thus slightly differing from the yield shown on the platform. Source: Bondsupermart Data as of 25 April 2025 |
||||||
Regarding GBP bonds (see Table 4), most UK insurance peers primarily issue long-term bonds, with no bonds maturing within 3-5 years. A relatively comparable bond is "JUSTLN 8.125% 26Oct2029 Corp (GBP)," which has a slightly lower issuer rating and bond rating than "PHNXLN 5.867% 13Jun2029 Corp (GBP)" but offers a yield approximately 20 basis points higher. We believe both bonds are attractive. Investors may consider the lower-risk Phoenix Group bond or the slightly higher-yielding Just Group bond (related article).
Table 4: GBP Bond Comparison
|
Bond Name |
Issuer |
Issuer Rating (S&P / Fitch) |
Bond Rating (S&P / Fitch) |
Seniority |
Ask Price |
Yield To Maturity |
|
PHNXLN 5.867% 13Jun2029 Corp (GBP) |
Phoenix Group |
N.R / A+ |
N.R / BBB+ |
Subordinate |
100.5 |
5.7% |
|
JUSTLN 8.125% 26Oct2029 Corp (GBP) |
Just Group |
N.R / A |
N.R / BBB |
Subordinate |
108.7 |
5.9% |
|
Source: Bondsupermart Data as of 25 April 2025 |
||||||
Related Risks
Phoenix Group bonds are in the subordinate nature. Besides, features of the bonds include deferred interest payment and extendable tenor. Hence, the bond credit rating is lower than the issuer’s credit rating. It is riskier than general bonds.
The Group’s shareholder asset portfolio consists of around 34% illiquid assets. It has a higher proportion of illiquid assets than its peers. Once the Group needs to liquidate its assets in exchange for liquidity, it might need to dispose of its illiquid assets at a larger discount, or may not be able to sell these assets, thus affecting its solvency.
Conclusion
Phoenix Group exhibits strong operational performance. The management expects mid-single-digit growth in operating cash generation, with business performance surpassing prior expectations. The Group’s annual total cash generation and excess cash will be used to reduce debt, as it is currently in a phase of using cash flow for debt reduction.
Phoenix Group maintains robust capital buffers and liquidity, with its credit profile expected to improve over time, which is favourable to bondholders.
Investors could consider Phoenix Group’s USD and GBP bonds, which have certain attractiveness, providing yield to maturity of 4.7% to 6.3%.
Declaration: For specific disclosure, at the time of publication of this report, IFPL (via its connected and associated entities) holds position in JUSTLN 8.125% 26Oct2029 Corp (GBP) and the analyst who produced this report hold a NIL position in the abovementioned securities.