Important Events
- Macquarie Group Limited (MGL) delivered another year of robust financial performance in FY23 with net profits climbing 10% YoY.
- Its Commodities and Global Markets segment was a key contributor to profits in FY23, supported by heightened volatility in commodity markets.
- Looking ahead, we acknowledge macroeconomic headwinds which have led management to adopt a cautious stance. However, we remain positive on the company’s profitability, particularly on Commodities and Global Markets, as well as Banking and Financial Services.
- MGL’s credit and liquidity profiles remain healthy, with key ratios generally sitting comfortably above regulatory minimums.
- We provide some recommendations on bonds issued by Macquarie Group Limited and its subsidiary Macquarie Bank Limited, denominated in SGD, AUD, and USD.
About Macquarie Group Limited (MGL)
Macquarie Group Limited (MGL) is a global diversified financial services group headquartered in Australia. While it was initially founded in 1969 as an investment bank in Australia, it has since expanded its operations to cover asset management, retail and business banking, and commodities trading among other segments, operating in a total of 34 markets.
MGL currently splits its business into four key segments – we list the segments below as well as their key responsibilities.
- Commodities and Global Markets (CGM): Offers capital and financing, as well as giving clients exposure to markets (especially commodities)
- Banking and Financial Services (BFS): Focuses on retail banking, business banking, and wealth management, with deposits of AUD 129.4b and loan portfolio of AUD 127.7b as of 31 Mar 2023
- Macquarie Asset Management (MAM): Provides investment solutions with AUD 870.8b in assets under management (AUM) as of 31 Mar 2023
- Macquarie Capital (MacCap): Offers advisory and capital-raising services
In this article, we will look at bonds issued by Macquarie Group Limited (MGL) and Macquarie Bank Limited (MBL). MGL bonds primarily provide funding to the MAM and MacCap segments, while MBL bonds primarily provide funding to the CGM and BFS segments, though all of these segments ultimately fall under the broader MGL.
Financial highlights
MGL recently reported its FY23 financial performance (for the year ended 31 Mar 2023), which showcased yet another year of resilient performances for the group. Net operating income grew 10% from AUD 17,324m to AUD 19,122m in FY23. On the other hand, operating expenses also increased by 12% primarily due to higher employment costs and higher investments into technologies, while income tax expense also rose 15% alongside a slightly higher effective tax rate. Nonetheless, the strong operating income performance meant that net profits (attributable to shareholders) continued their robust growth from the previous year (56% growth from FY21 to FY22), growing by 10% YoY in FY23 to AUD 5,182m.
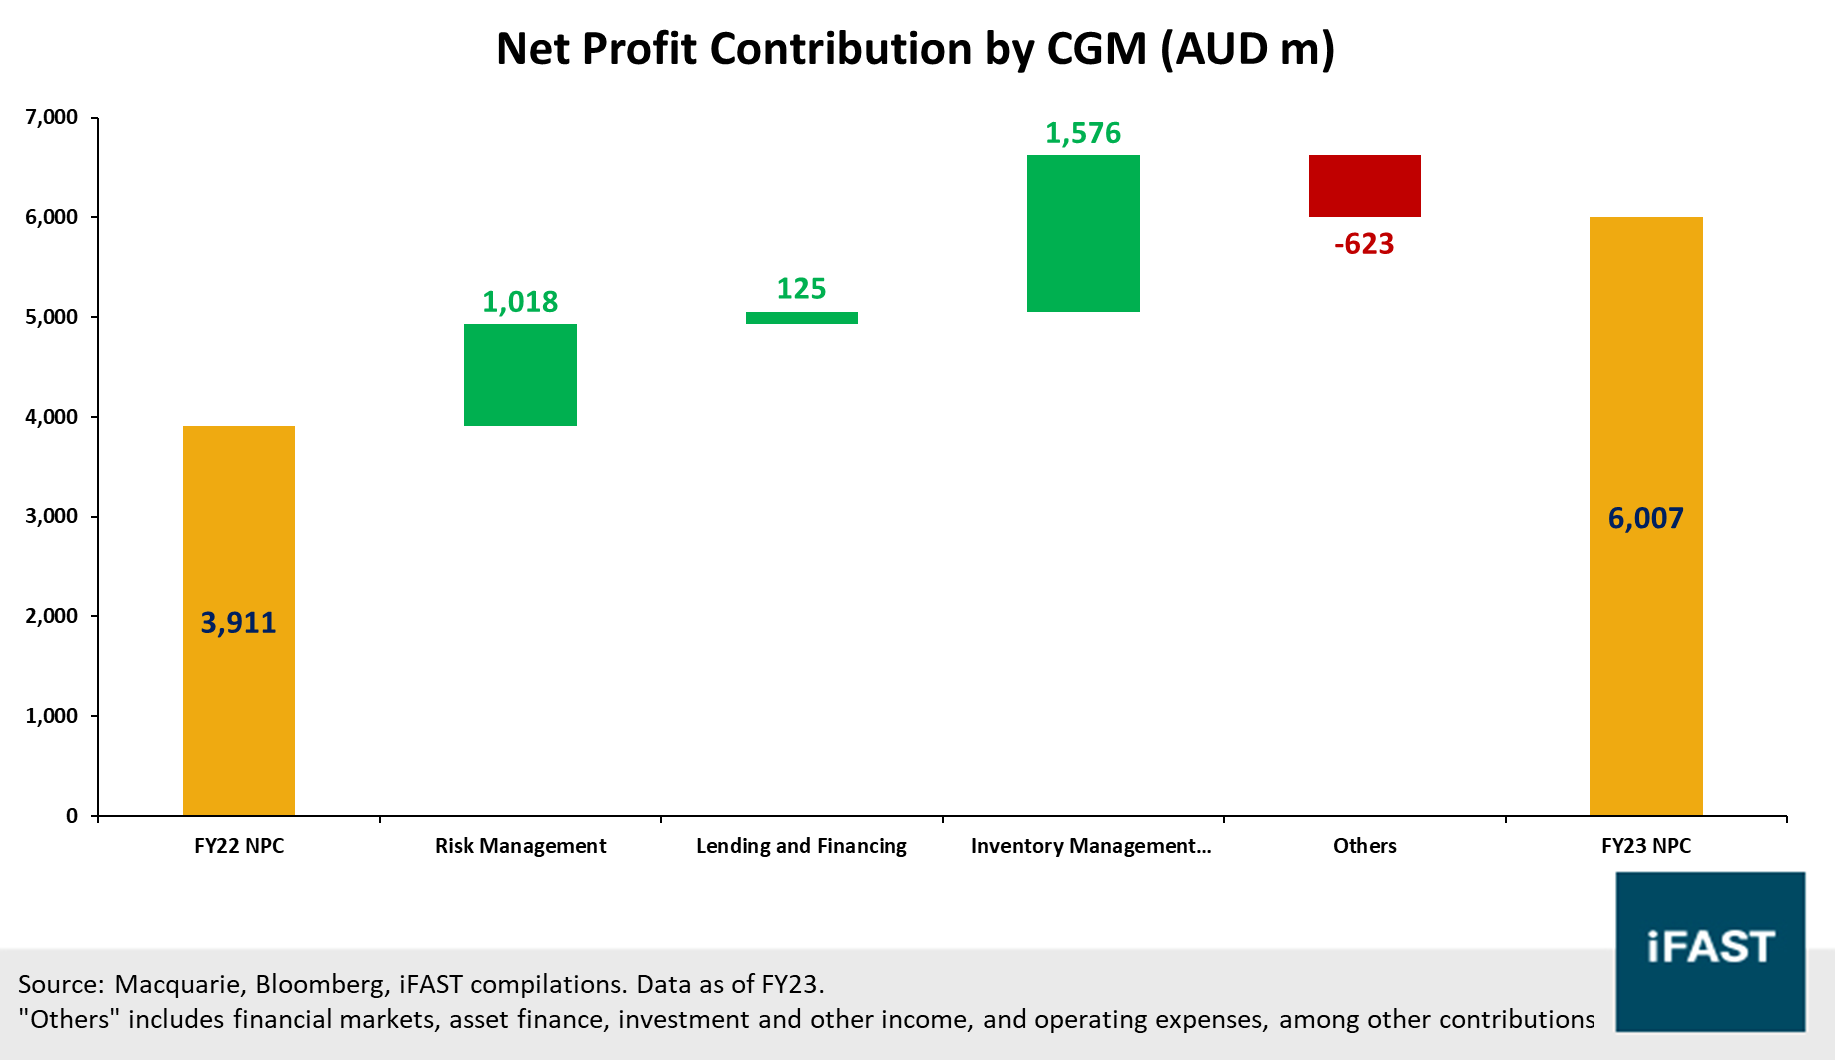
On a segmental level, CGM was the largest contributor by a large margin, accounting for 57% of net profits (Chart 1). This was mainly helped by heightened volatility in various asset prices in FY22, particularly commodities, which resulted in strong risk management profits, as well as significantly higher profits from inventory management and trading (Chart 2). The BFS segment also saw a solid net profit growth of 20% YoY, helped by growth in its loan portfolio as well as improved margins.
These strong performances were however offset by a weak performance in the second largest segment MAM (23% of net profits). MAM net profits fell by -23% to AUD 2,342m, hurt by a one-time recognition of a disposition fee related to Macquarie Infrastructure Corporation (AUD -577m). However, we note that underlying performance metrics within MAM remain robust, with AUM increasing by 10% YoY, and overall base fees and performance fees continuing to see positive YoY growth. In addition, we note that MacCap’s net profits also declined YoY primarily due to lower M&A fee income.
MGL has now achieved 54 consecutive years of profitability, which we believe underscores its resilience and ability to navigate different market environments. We believe FY23’s performance as a whole continues to paint a positive picture of MGL’s profitability, helped by the CGM and BFS segments.
Chart 1: MGL’s net profits rose 10% YoY in FY23, helped by strong CGM performance
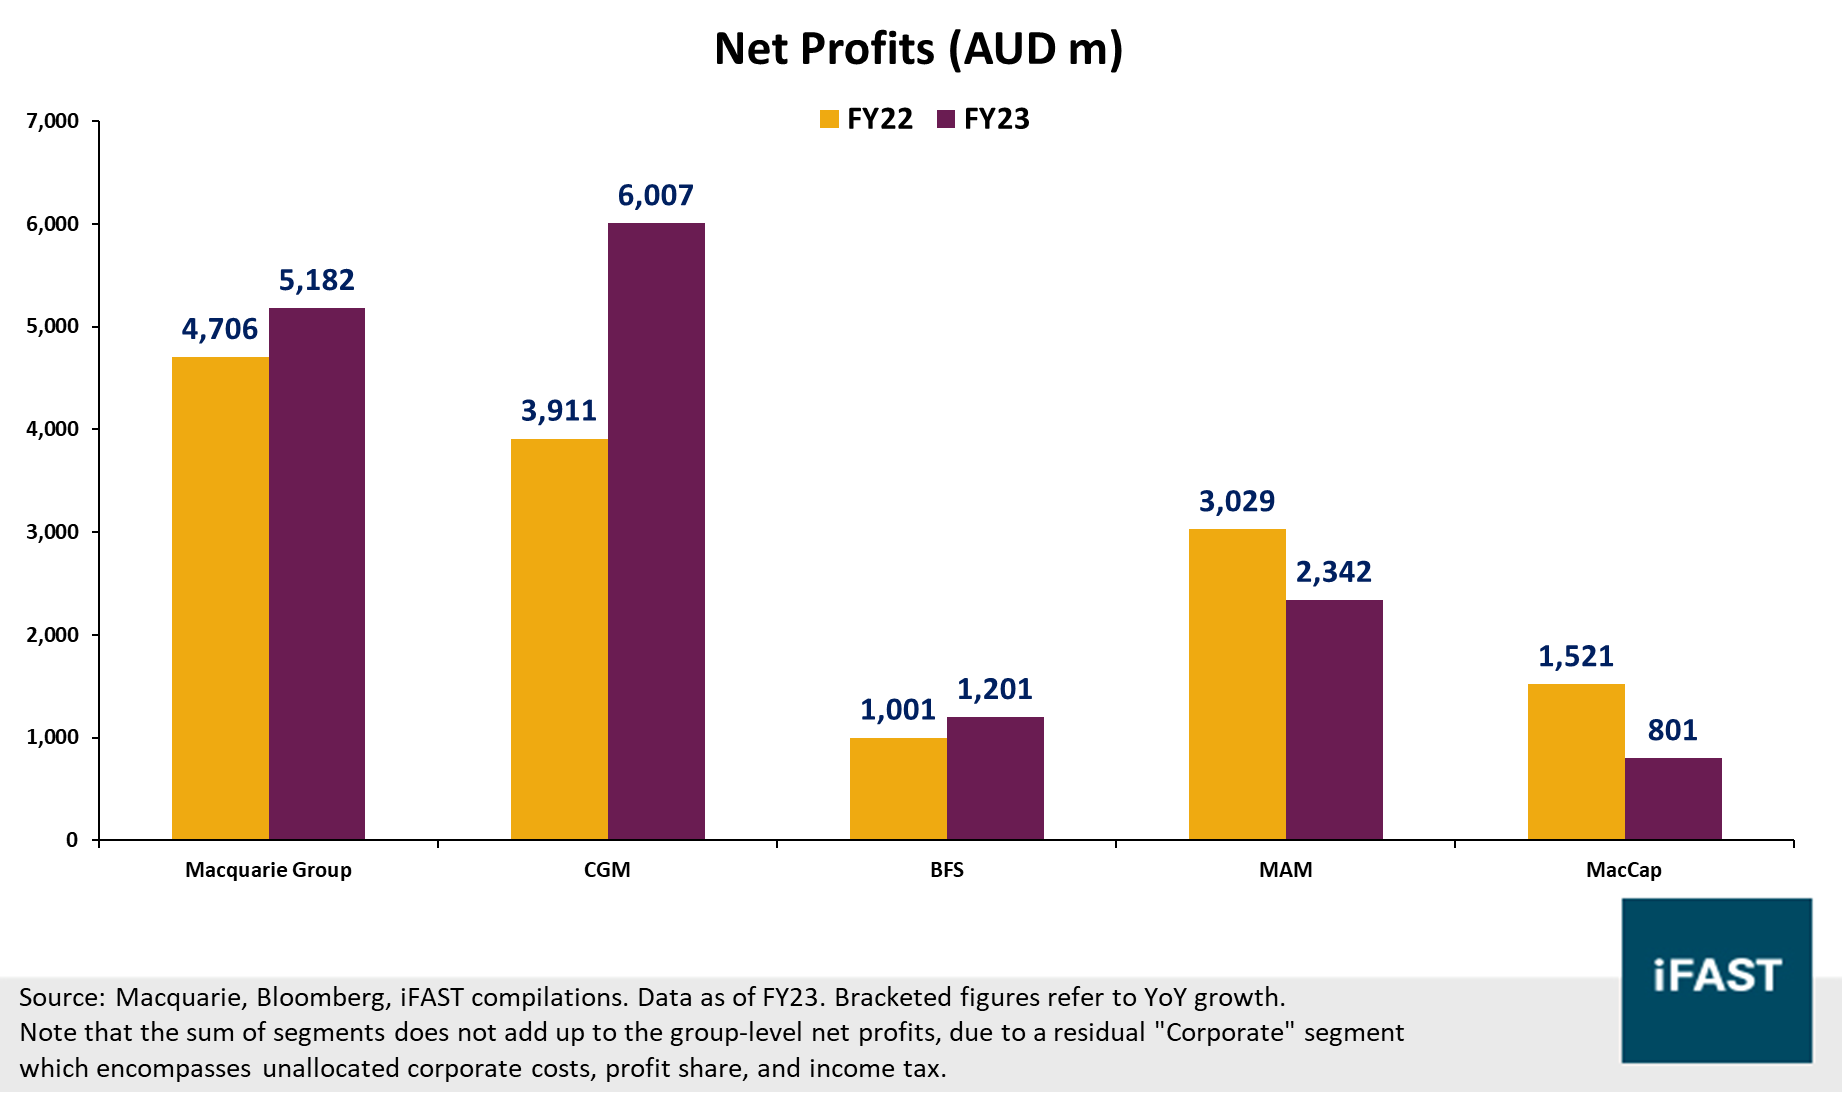
Chart 2: CGM segment benefited primarily from volatile commodities markets
Outlook for MGL
Management has indicated in a recent trading update that 1Q24 (first quarter of financial year ended 31 Mar 2024) operating income was substantially down YoY compared to 1Q23 as a result of weaker trading conditions, and that they would maintain a cautious stance moving forward. Key factors identified by management include lower investment-related income from MAM and MacCap, as well as high-base effects from the strong performance in CGM last year.
We acknowledge ongoing macroeconomic headwinds ahead globally (including in Australia itself), but nonetheless expect earnings growth for MGL to remain positive in FY24.
For the key CGM segment, we think earnings should remain supported on the back of continued uncertainty in energy markets, particularly due to supply-related reasons (e.g. arising from the Russia-Ukraine War, or from potential OPEC supply cuts). While management has highlighted that elevated volatility within gas markets has abated in 4Q23, we do not rule out a resurgence in such volatility in the quarters ahead. We also highlight that management estimated repeat client business to account for approximately 80% of client revenue (as of FY23), and we think that this high percentage could give additional resilience to performance moving ahead.
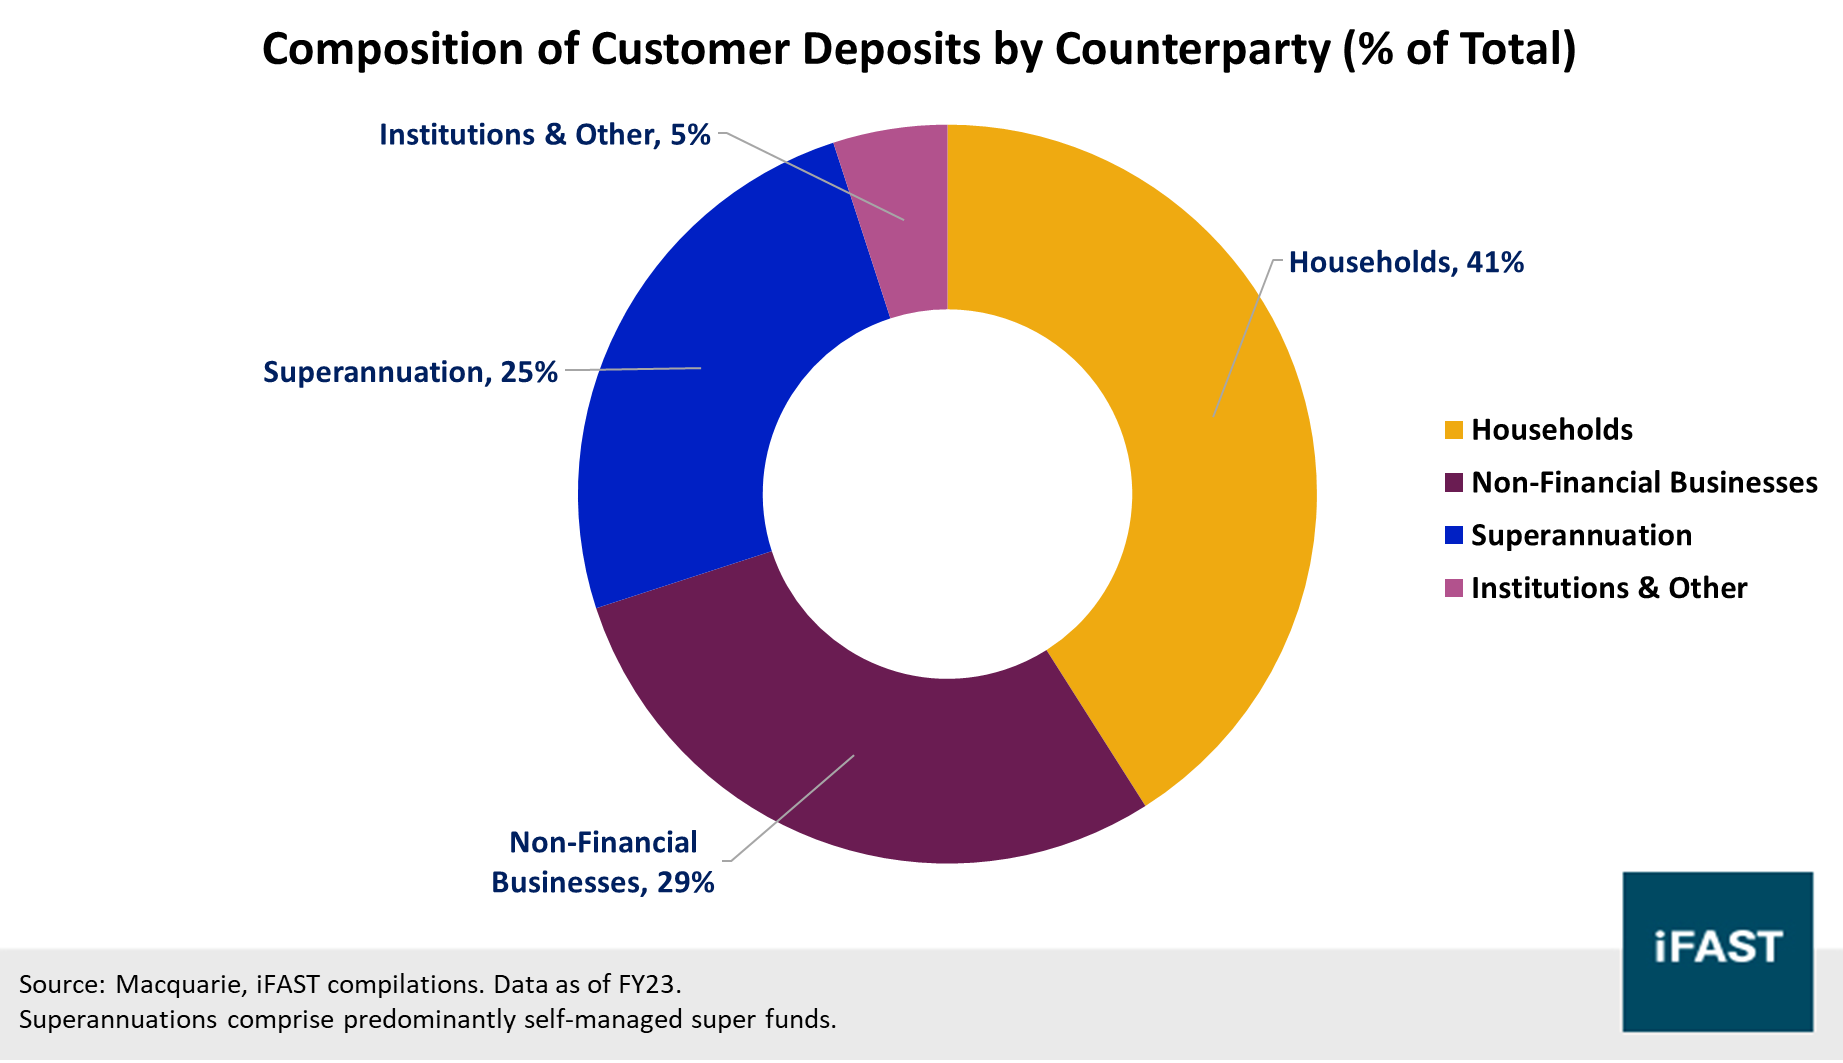
In addition, the BFS segment continues to be a bright spot for MGL, with the profit contribution of BFS in 1Q24 reported to be higher than that in 1Q23. Looking ahead, we think the BFS segment should also benefit from decent net interest margins, especially with inflation remaining persistently elevated (Chart 3) likely giving more room for the RBA to retain its hawkish stance for some time. We also like that its customer deposit base is fairly diverse across different sources (Chart 4), which could help to mitigate idiosyncratic risks within specific client groups.
As a whole, we think that MGL remains well-placed to continue its 54 years of profitability even in FY24. Its diversified sources of revenue allow it to remain more resilient even in tougher market environments, and we think the BFS and CGM segments within MGL’s banking business could be key earnings drivers in the year ahead, amidst a higher-for-longer rates as well as a potentially volatile market environment.
Chart 3: Inflation in Australia remains persistently elevated above target range
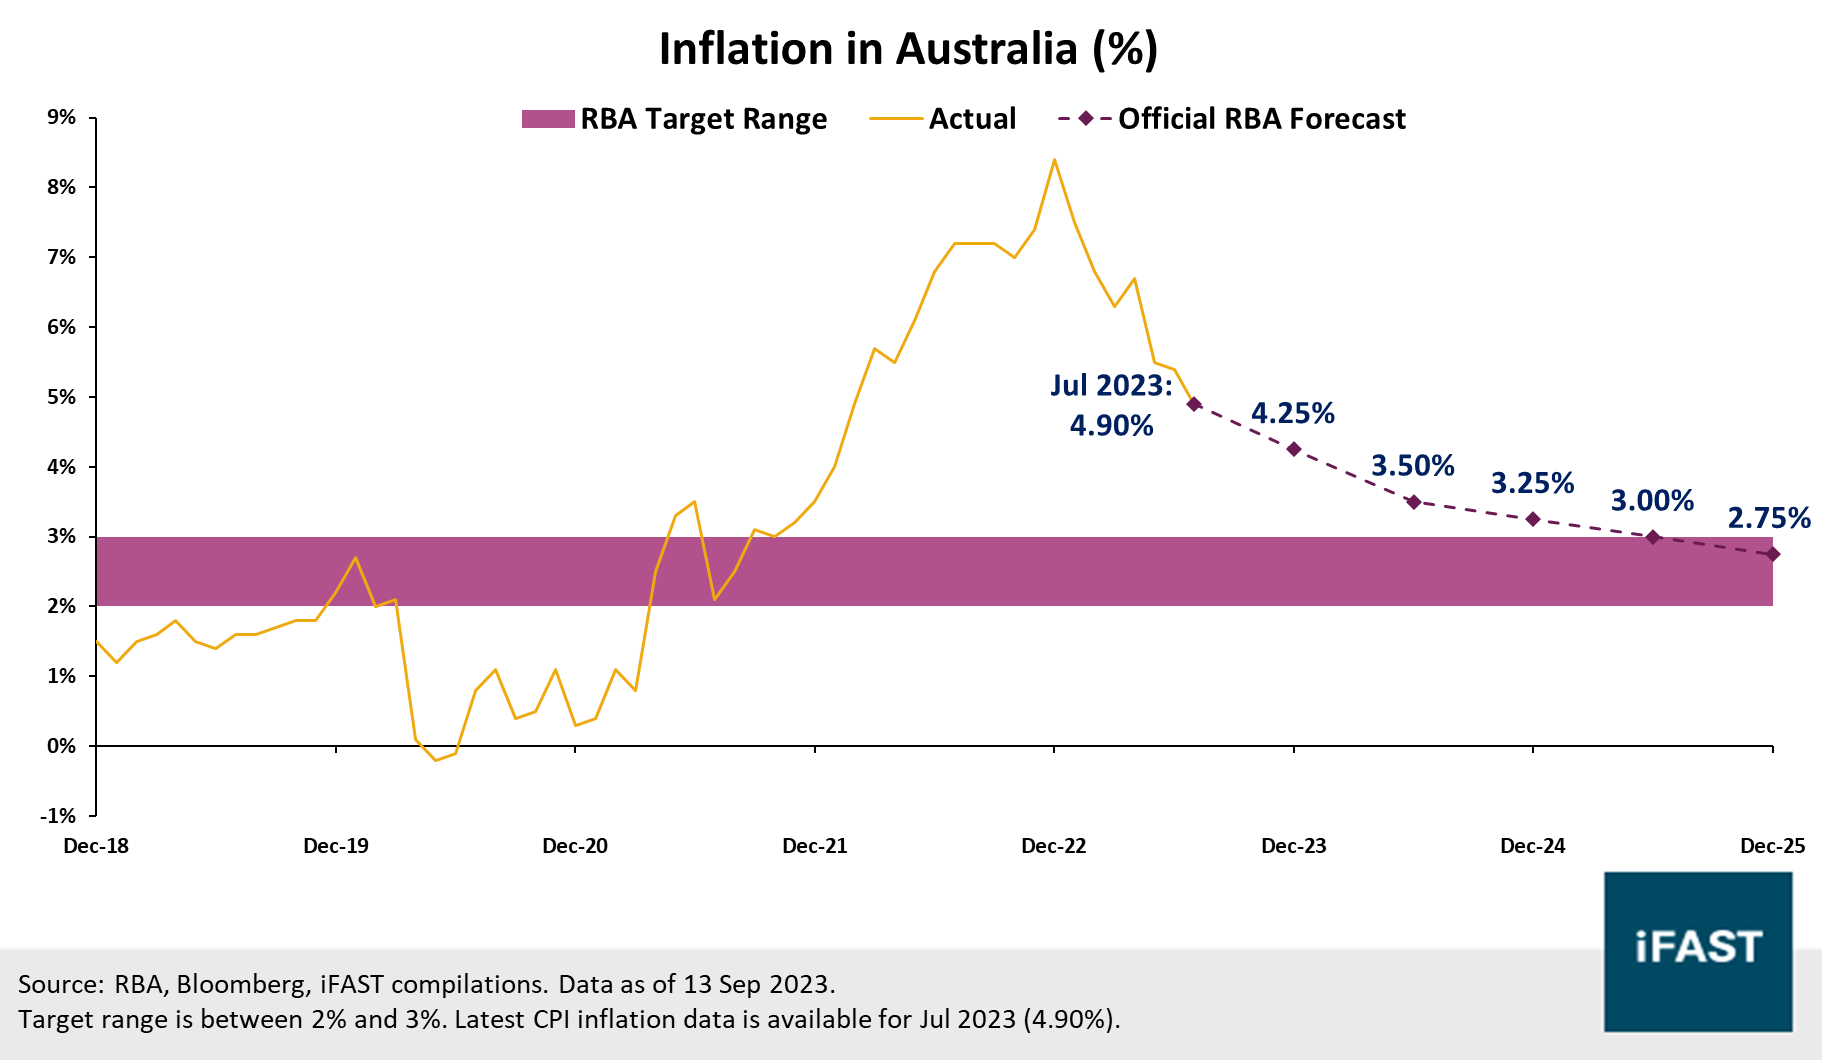
Chart 4: Customer deposit base is fairly diverse
Credit highlights
We believe Macquarie’s credit and liquidity profiles remain healthy. For instance, MGL has maintained a healthy capital surplus of AUD 12.6b in 1Q24 (1Q23: AUD 12.2b), representing a Tier 1 Capital ratio of about 15.2% above the regulatory minimum of 10.25%. In addition, we note that the Group faces little near-term funding pressures, as its term funding has a weighted average maturity of 4.4 years, with most of its maturities coming in more than 5 years (i.e. maturing later than 31 Mar 2028).
In addition, looking at additional Basel III requirements on a Level 2 Bank level, we observe that MBL’s metrics continue to show a decent buffer relative to their regulatory minimums. We highlight some key ratios below (Table 1).
- MBL reported a CET1 ratio of 13.6% in 1Q24 (18.1% using the BCBS Basel III framework, though Australian banks use a stricter calculation of 13.6% using the APRA Basel III framework), above the regulatory minimum of 8.75%.
- MBL’s leverage ratio of 5.2% in 1Q24 (5.9% using the BCBS Basel III framework) remains above the regulatory minimum of 3.5%. (Note: Leverage ratio in this case refers to Tier 1 capital divided by total non-risk-weighted exposures, and is an additional non-risk-based measurement.)
- MBL also reported a liquidity coverage ratio (LCR) of 211% as of 1Q24, once again comfortably above the minimum requirement of 100%. It also reported a net stable funding ratio of 115%.
We also highlight that the proportion of non-performing facilities (AUD 1,393m) has remained relatively stable at about 0.51% of gross credit exposure (AUD 273,003m as of 1Q24). MBL has also recently increased its provisions for non-performing loans, as expected given the cautious outlook expressed by management.
Table 1: Key ratios of MBL
| Capital / Liquidity Metric | Actual (as of 1Q24) | Regulatory Minimum |
| CET1 Ratio | 13.6% | 8.75% |
| Total Capital Ratio | 21.1% | 12.25% |
| Leverage ratio | 5.2% | 3.5% |
| Liquidity Coverage Ratio | 211% | 100% |
| Source: Macquarie, iFAST compilations, iFAST estimates. Data as of 1Q24. | ||
Recommendations
To summarise, we believe Macquarie remains well-positioned to do well in the coming quarters even amidst an uncertain macroeconomic environment, and bondholders should be heartened that it maintains a healthy credit profile. Both MGL and MBL have several outstanding bonds denominated in different currencies – we provide our recommendations for SGD, AUD, and USD below (Table 2).
For SGD, we think the MQGAU 4.500% 18Aug2026 Corp (SGD) looks fairly attractive with a yield-to-worst (YTW) of 4.207%. This bond also comes with an issuer call option on 10 Aug 2025, with a reset rate of 1Y SORA-OIS + 1.830% on the same date.
For AUD, we think both the MQGAU 4.150% 15Dec2027 Corp (AUD) and MQGAU 6.082% 07Jun2032 Corp (AUD) look fairly attractive.
- The former is a fixed-rate bond while the latter has a reset rate of the prevailing Australia 3-Month Bank Bill Swap Rate + 2.700%, resetting in Jun 2027 (with an issuer call option).
- The former bond is senior unsecured and rated BBB+ by S&P, while the latter bond is Tier 2 subordinated and rated BBB by S&P. We note that the Tier 2 nature of the latter means they have loss-absorption features, which may be triggered upon the occurrence of a non-viability event.
Overall, we think the former 2027 bond could be suited for investors with a lower risk appetite, as it is not exposed to non-call risks as well as loss-absorption risks. However, given the positive outlook for MGL and MBL, we think the latter 2032 bond remains attractive for investors looking to gain a small yield pickup (+19 bps).
For USD, we think the MQGAU 3.624% 03Jun2030 Corp (USD) looks attractive. This bond is also a Tier 2 subordinated bond with an S&P rating of BBB. Investors should note the long maturity profile of this bond (similar to the 6.082% AUD bond) and the accompanying duration risks. However, this bond also offers a decent yield of 6.660%, which may be of interest to investors with a larger risk appetite.
Table 2: Recommendations
| Bond Name | Next Call / Maturity Date (Years to Next Call / Maturity) |
Bond Rating by S&P / Fitch | Ask Price | Current Yield (to Maturity) (%) |
Yield to Worst (%) |
| MQGAU 4.500% 18Aug2026 Corp (SGD) |
10 Aug 2025 / 18 Aug 2026 (1.9 / 2.9) |
BBB+ / A | 100.533 | 4.476% | 4.196% |
| MQGAU 4.150% 15Dec2027 Corp (AUD) |
15 Dec 2027 (4.3) |
BBB+ / A | 93.932 | 4.418% | 5.782% |
| MQGAU 6.082% 07Jun2032 Corp (AUD) |
07 Jun 2027 / 07 Jun 2032 (3.7 / 8.7) |
BBB / BBB+ | 100.343 | 6.061% | 5.974% |
| MQGAU 3.624% 03Jun2030 Corp (USD) |
03 Jun 2030 (6.7) |
BBB / BBB+ | 83.779 | 4.326% | 6.660% |
| Source: Bloomberg, Bondsupermart, iFAST compilations. Data as of 14 Sep 2023. | |||||
Declaration: For specific disclosure, at the time of publication of this report, IFPL (via its connected and associated entities) and the analyst who produced this report hold a NIL position in the abovementioned securities.
Our podcast series, Yield Hunters, is available on Spotify, iTunes Podcasts and Google Podcasts. We share our thoughts on new bond issues and hold discussions on the fixed income space. Listen to our latest episode below and follow us!