Receive first-hand news on the latest bond issues, credit updates and special events when you join us on our Telegram channel at https://t.me/bondsupermart!
- OUE recorded stronger revenue in FY24, helped by the real estate business segment, which continues to see strong post-Covid recovery.
- The group recorded a net loss in FY24, driven largely by non-cash losses. Excluding these losses, operating profit remains resilient.
- Debt metrics saw a moderation in FY24, but liquidity has strengthened. OUE’s debt financing remains manageable, even on a standalone basis.
- OUE’s credit profile remains stable and we recommend OUESP 4.000% 08Oct2029 Corp (SGD) for its attractive yield, especially against other SG real estate developers.
OUE Limited (“OUE”) is a leading real estate and healthcare group with assets across Asia. The Group is the manager of two SGX-listed REITs, OUE REIT and First REIT. OUE also operates and owns healthcare assets through OUE Healthcare. As of 31 December 2024, OUE’s total assets were valued at SGD 8.9b. The Group reports in three operating segments:
- Real estate – Operations from the 1) Investment Properties business, which includes the rental of investment properties and management of REITs/ properties under development, 2) Hospitality business, which operates and manages hotels, 3) Development Properties business, which includes the sale of properties/ properties under development. The real estate business includes contributions from OUE REIT (The manager of OUE REIT, OUE REIT Management, is a wholly-owned subsidiary of OUE).
- Healthcare – OUE Healthcare owns, operates, and invests in healthcare businesses. OUE Healthcare is also the sponsor and the largest unitholder of First REIT (“First REIT”). The manager of the REIT is 60% directly held by OUE and 40% directly held by OUE Healthcare as of 31 December 2024.
- Others - Operation of F&B outlets and consumer-related investments.
OUE recorded a net loss in FY24, driven largely by non-cash losses
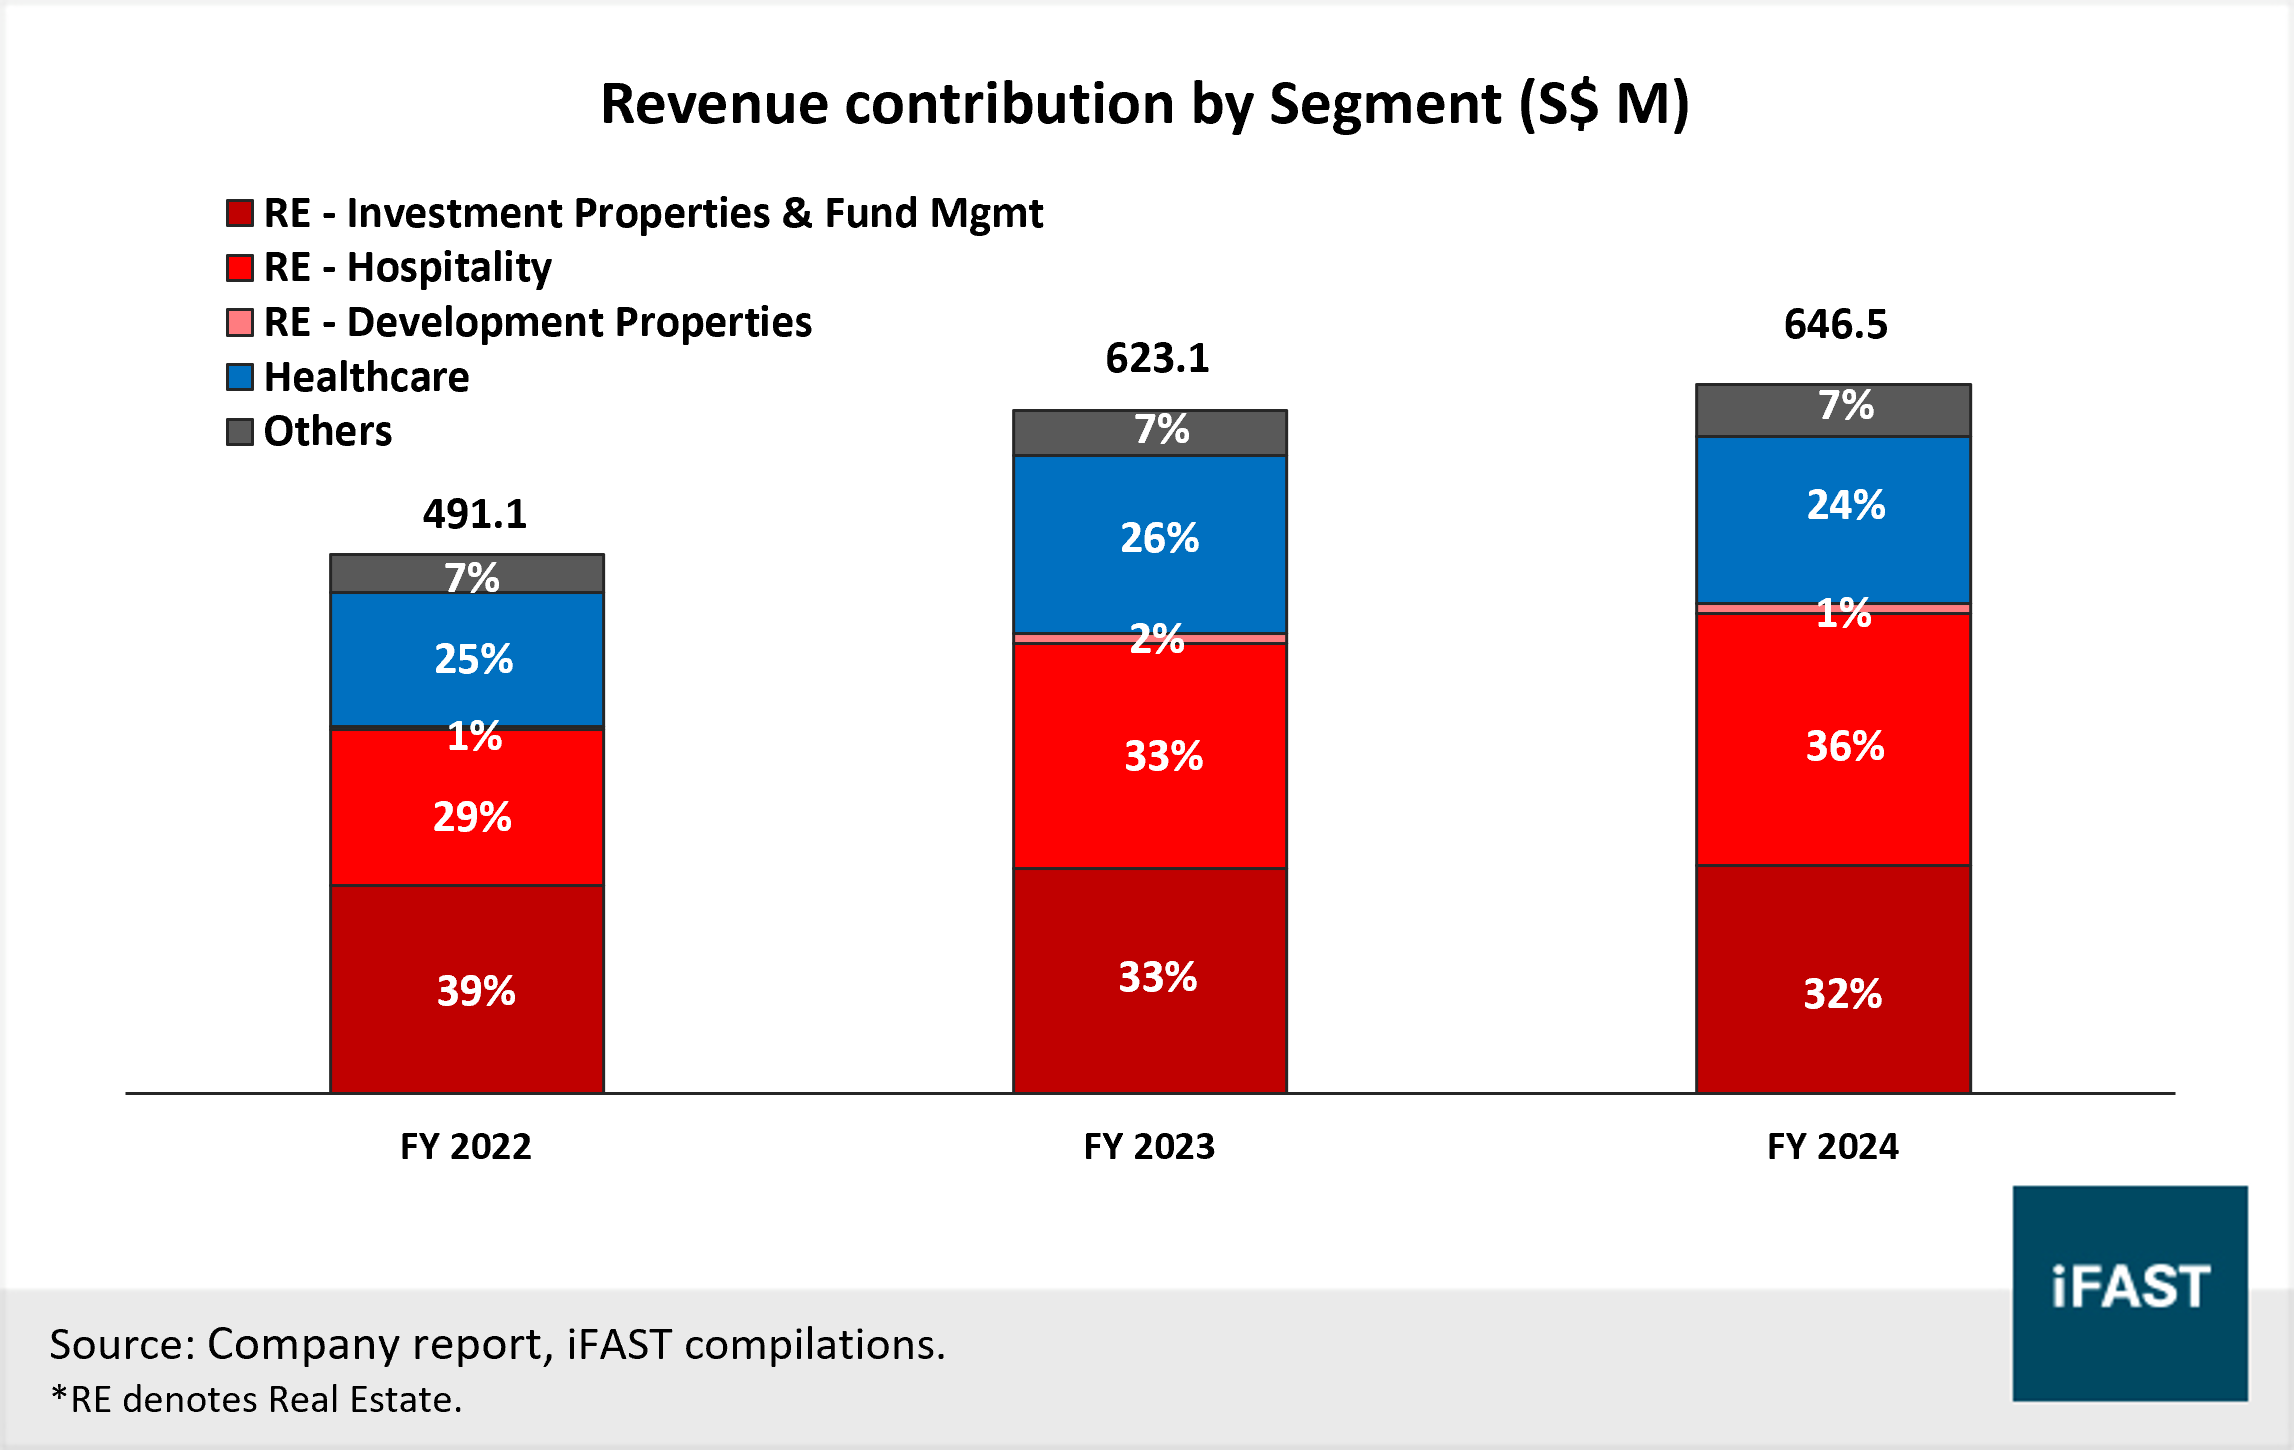
For the financial year ended 31 December 2024 (“FY24”), OUE recorded revenue of S$646.5m, up slightly by 3.8% YoY (FY23: S$623.1m), driven by higher turnover from the real estate and others business segment. The Group’s real estate segment grew 6.5% YoY to S$447.0m in FY24 (FY23: S$207.5m) and remains the key revenue driver (Chart 1), contributing around 69% of the total revenue. This was fuelled by its investment properties and hospitality sub-segment, which comprised OUE REIT’s asset portfolio.
Meanwhile, OUE’s Healthcare segment recorded a 6.1% YoY decline in revenue to S$152.2M in FY24 (FY23: S$162.1M), largely due to the lower contribution from First REIT which was hurt by weaker IDR and JPY against the SGD. Lastly, OUE’s Others segment reported a 15.0% YoY revenue growth to S$47.3m in FY24 (FY23: S$41.1m) due to contributions from dining concepts launched over the past 1-2 years.
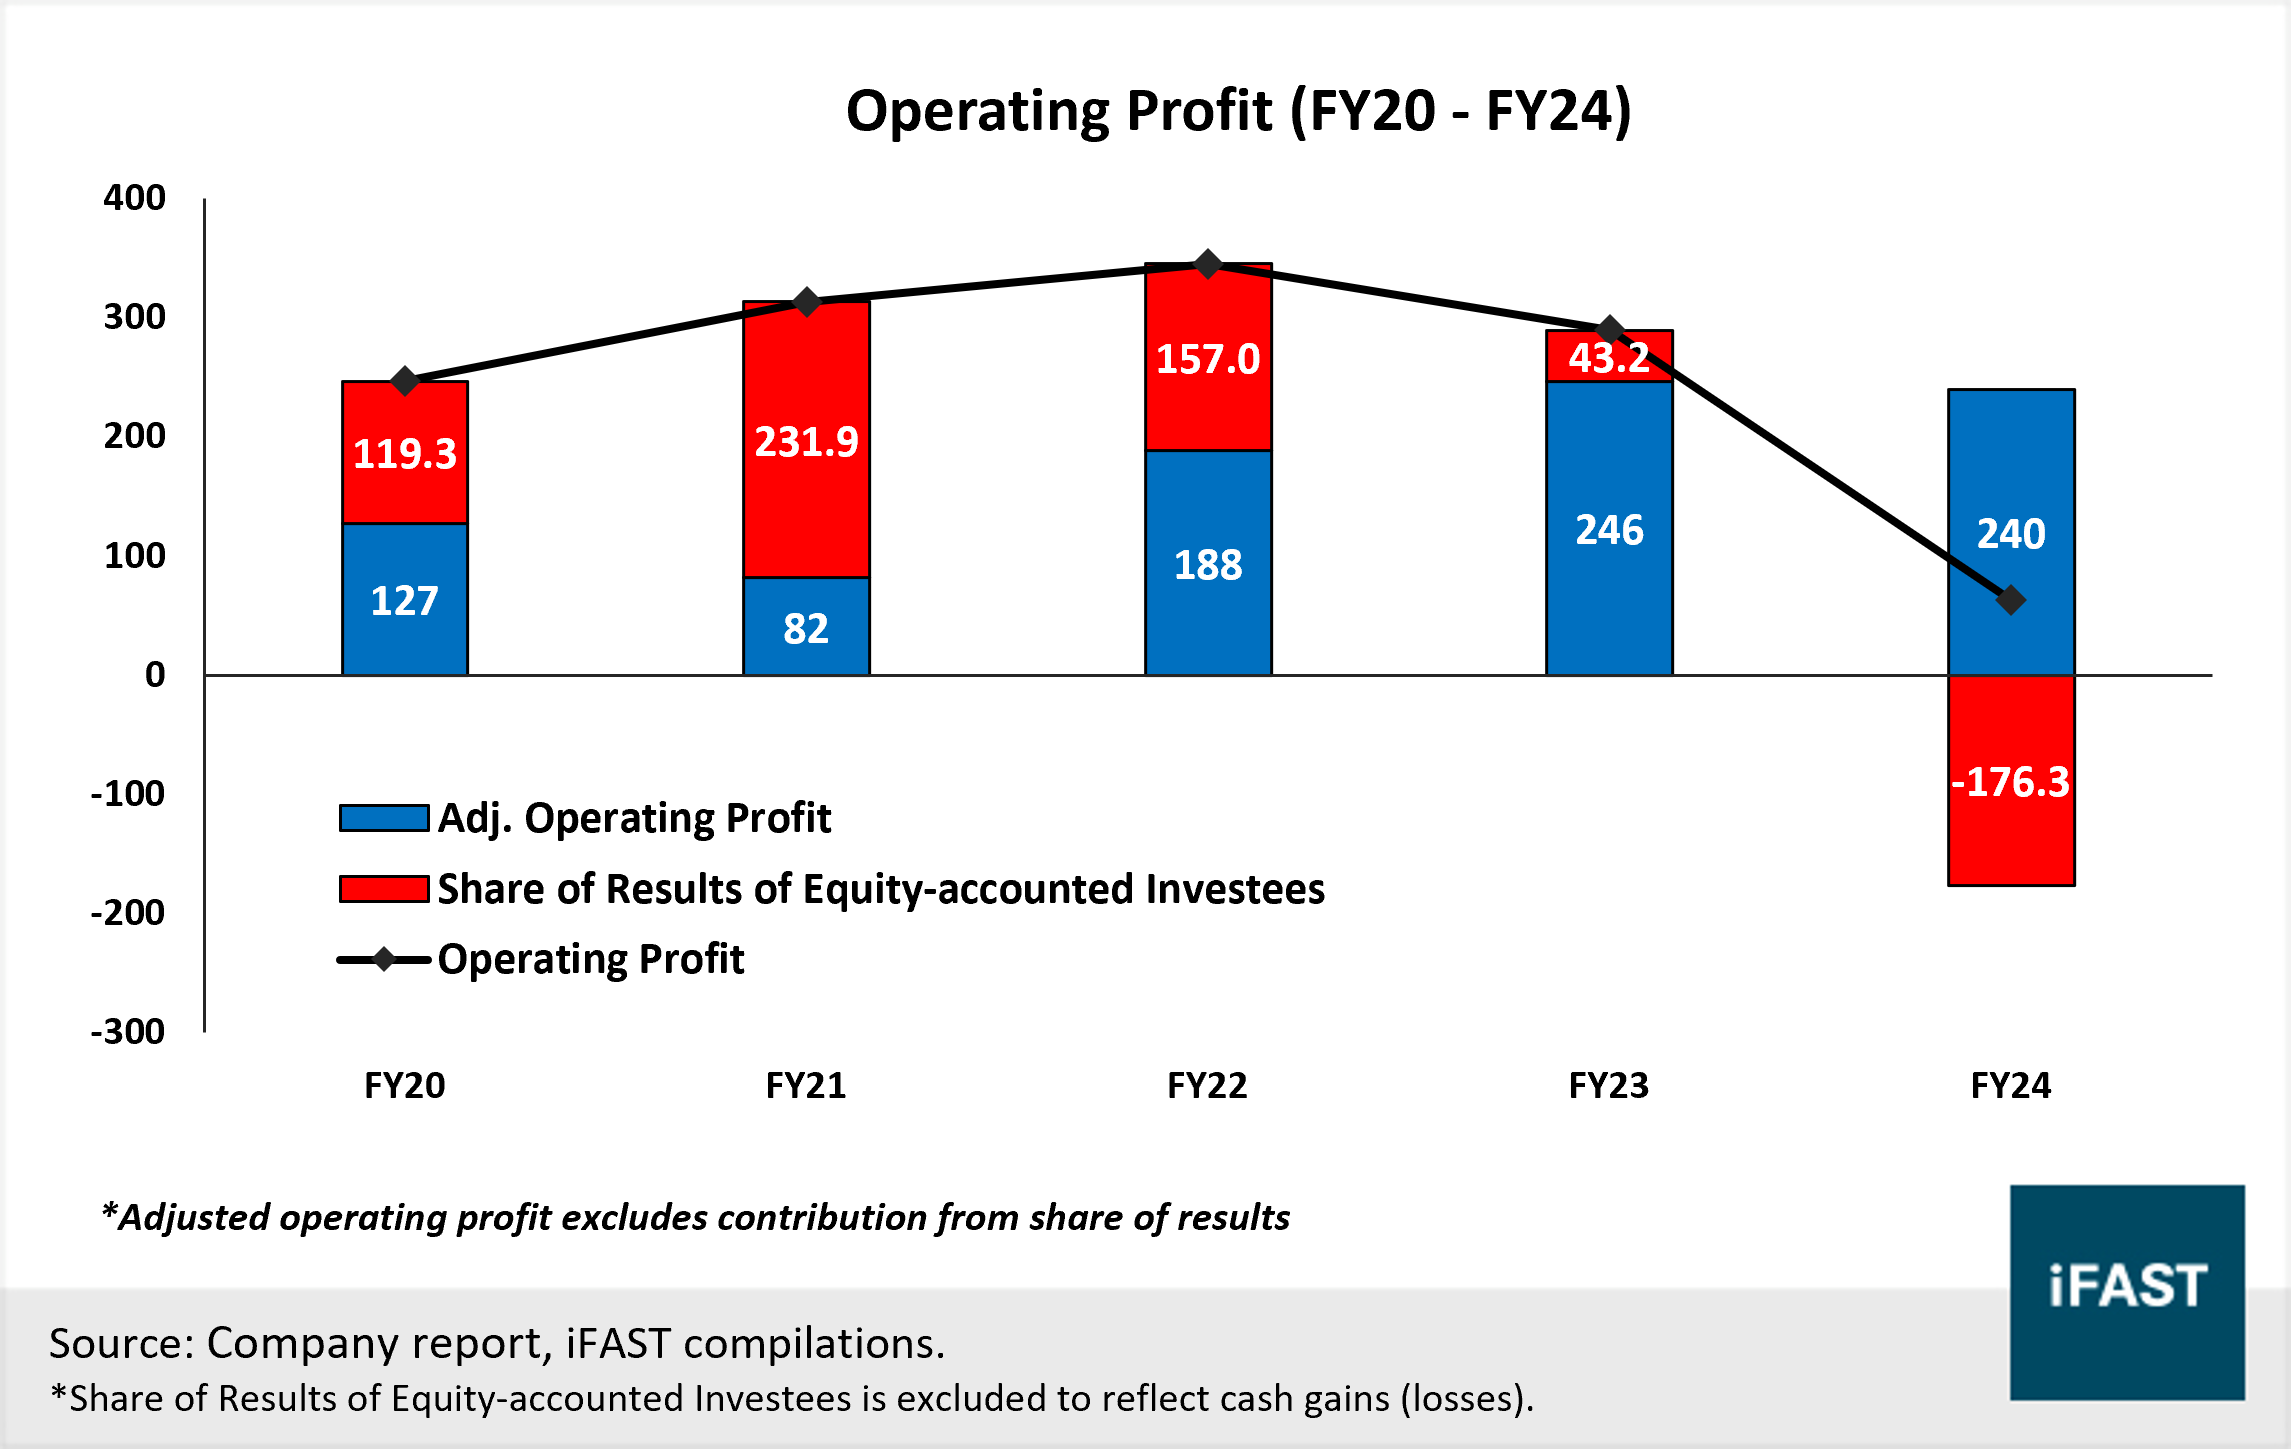
Despite resilient revenue growth, OUE reported a 78.1% YoY decline in operating profit of S$63.4m (FY23: S$289.4m) and consequently, a net loss attributable to shareholders of -S$286.8m in FY24 (FY23: S$81.1m). This was largely due to 1) S$55.0m fair value losses in OUE’s investment properties, and 2) S$191.4m losses from the share of results of equity-accounted investees. The latter was mainly losses recorded from the Group’s 25.9%-owned associate, Gemdale Properties and Investment Corporation (“GPI”), which had been adversely hit by the property market downturn in China.
That said, we highlight that these losses are mainly non-cash in nature with no material impact on OUE’s cashflow and funding requirements. Excluding these losses (from share of results of equity-accounted investees), we estimate OUE’s operating profit to be S$239.7m in FY24 – instead of the reported S$63.4m (Chart 2) – which suggests decent operating performance.
Chart 1: Revenue has improved in recent years, supported by the real estate (“RE”) business
Chart 2: Operating profit fell in FY24 largely due to non-cash losses. Excluding these, operating profit remains resilient
Real estate business remains strong, supported by OUE REIT
The Group’s real estate business revenue remains strong and has grown at a compound annual growth rate of 21% since 2021, demonstrating strong recovery post-Covid. Within the segment, the Investment Properties division continues to contribute greatly, recording a 1.3% YoY increase in revenue to S$207.5m (FY23: S$204.7m), helped by OUE REIT’s resilient retail and office portfolio in Singapore (Table 1) – healthy rental reversion (10.7% for SG office and 19.8% for Mandarin Gallery) and strong portfolio’s committed occupancy of over 90% (as of FY24). The rising contribution from Investment Properties also means that a substantial portion of OUE’s revenue comes from recurring income sources, pointing to improving revenue resiliency.
Meanwhile, the Hospitality division recorded a 12.1% YoY rise in revenue to S$230.2m in FY24 (FY23: S$205.4m), helped by 1) contribution from OUE REIT’s Crowne Plaza Changi Airport after its asset enhancement works (Dec ’23) was completed, and 2) improved occupancy rates, helped by higher visitor arrivals and the strong lineup of concerts, meetings, conferences and exhibitions. Contribution from development properties remained minor at S$9.4M in FY24 (~1% of total revenue).
OUE REIT has completed its 100% divestment of Lippo Plaza Shanghai as of 27 December 2024, eliminating exposure to the volatile Chinese property market amidst the ongoing US-China trade uncertainties. Post-divestment, the REIT’s remaining assets are in Singapore, which we deem stable and more resilient. By extension, this should continue to support OUE’s real estate revenue, with room for improvement if Hospitality revenue improves on greater visitor arrivals and higher occupancy rates.
Table 1: OUE REIT’s SG-focused portfolio remains resilient, helped by strong occupancy rates and RevPar in FY24
|
Committed Occupancy
|
Revenue per
Available Room (RevPar)
|
|
OUE REIT’s Portfolio
|
FY24
|
FY23
|
FY24
|
FY23
|
|
OUE Bayfront
|
98.2%
|
97.6%
|
-
|
-
|
|
One Raffles Place
|
95.3%
|
96.3%
|
-
|
-
|
|
OUE Downtown Office
|
91.9%
|
92.6%
|
-
|
-
|
|
Mandarin Gallery
|
98.2%
|
97.6%
|
-
|
-
|
|
Hilton SG Orchard
|
-
|
-
|
$290
|
$274
|
|
Crowne Plaza Changi Airport
|
-
|
-
|
$242
|
$205
|
|
Source: OUE REIT annual report, iFAST
compilations.
|
Expect stable profit outlook – Supported by real estate segment, while healthcare segment may experience volatility
Looking ahead, we expect profit to remain stable for OUE, anchored largely by its real estate business, which is supported by OUE REIT’s high-quality Singapore-centric portfolio. On the other hand, we think OUE’s Healthcare segment may experience near-term earnings volatility as First REIT executes its Growth 2.0 strategy - to reshape its portfolio by expanding into developed markets, targeting more than 50% AUM by FY27 (current ~25.5%). This may be reflected through a more volatile portfolio income as the REIT undergoes asset acquisitions and disposals to achieve its target.
In January 2025, First REIT received a preliminary non-binding letter of intent from PT Siloam International Hospitals Tbk (“Siloam”) to acquire its portfolio of hospital assets in Indonesia. The board of First Reit’s manager is conducting a strategic review to assess this potential acquisition. While disposing of these assets aligns with First REIT’s growth 2.0 strategy, they contribute materially (~80%) to the REIT’s gross rental revenue. Therefore, the income stability of First REIT will depend on how its assets are managed, which can eventually impact the earnings contribution from OUE’s healthcare business.
Liquidity position has strengthened
OUE has strengthened its liquidity position in FY24. On a consolidated basis (including its subsidiaries), cash balance (less pledged deposits) rose by S$419.2m to S$598.5m in the year (FY23: S$179.8m), largely helped by asset divestments and proceeds from last year’s note issuance. The Group also has additional unutilised committed facilities amounting to S$409.9m. Overall, OUE’s consolidated cash position can comfortably cover its short-term borrowings of S$183.0m in FY24, suggesting little near-term liquidity risk.
OUE recorded a rise in total borrowings by S$237.7m to S$3,111.2m as of end-FY24 on a consolidated basis (FY23: S$2,873.5m) due to bank loans and bond issuances. That said, short-term borrowings – which the Group can comfortably cover - remain a small portion at 6%. Beyond the short-term, if refinancing needs rise, we think OUE is unlikely to face issues in getting funding. The Group has demonstrated easy access to the SGD bond market with last year’s S$150m issuance of its 5-year SGD bond and a further S$50m re-tap of the same bond.
Debt financing remains manageable even without contribution from REITs
As OUE reports on a Group level, the debt of its REITs (OUE REIT and First REIT) are consolidated into its financial statements. Excluding these debt, OUE’s standalone leverage profile will vary from what was reflected in the consolidated numbers. We estimate the OUE to have a total debt of around SGD 558.1m on a standalone level, as compared to the S$ 3,111.2m reported on a consolidated level as of end-FY24.
We see no liquidity hurdles in the near-term as standalone short-term debt (excluding REIT’s debt) makes up a small portion at S$66.9m. This can be comfortably covered by the standalone cash balance (excluding REIT’s cash) of S$202.2m. Based on our estimation, OUE receives about S$92 – 98m annually in dividends from its REIT over the past three years, which should be sufficient to service interest expense.
Assuming an annual interest expense of S$90m – a maximum sum that can be covered by the dividends from OUE’s REITs – we find the implied average cost of debt to be 16% on OUE’s standalone debt. This is significantly higher than its actual average cost of debt, which we estimate to be in the low to mid-single digit range. In fact, the highest reported cost of debt was nearly 6% on OUE’s secured bank loans. With the actual average cost of debt likely to be much lower than the 16%, which suggests a much lower interest expense than SGD 90m, we expect dividends from OUE’s REITs to sufficiently service the standalone interest expense.
Debt metrics have moderated in FY24
On a consolidated basis, OUE’s EBITDA-related debt metrics have weakened greatly in FY24, given the non-cash losses (Table 2). Treating perpetual securities as debt, the net leverage (net debt to EBITDA) ratio recorded a jump to 20.1x in FY24 (FY23: 7.8x) while EBITDA interest coverage ratio fell to 0.7x (FY23: 2.2x). As the moderation in these metrics is larger than typical historical moves, we adjusted EBITDA to remove non-cash contributions (from losses/gains of OUE’s investees further) for a fair assessment of these debt metrics.
Doing so, we find that the net leverage ratio saw a smaller decline to 8.4x in FY24 instead (FY23: 8.9x), given a higher EBITDA. Meanwhile, EBITDA interest coverage ratio also fell less drastically to 1.7x (FY23: 1.9x), remaining at a comfortable level. This is in line with a 1) milder weakening seen from OUE’s net gearing ratio, which rose slightly to 47.9% in FY24 (FY23: 46.6%), below the 63% average observed across the developers which are SGD issuers, and 2) a slight rise in total debt to total assets fell to 35.4% (FY23: 31.4%), below the 36% average across peers. Together, we think debt metrics have certainly weakened but are not yet a cause for concern, as indicated by the milder decline after most ratios, especially after adjusting EBITDA.
Table 2: Debt metrics showed milder deterioration, excluding non-cash losses from OUE’s equity-accounted investees
|
Ratios (treating perp as debt)
|
FY22
|
FY23
|
FY24
|
|
Net Gearing
|
45.0%
|
46.6%
|
47.9%
|
|
Total Debt to Total Assets
|
31.6%
|
31.4%
|
35.4%
|
|
Net Debt to EBITDA
|
6.7
|
7.8
|
20.1
|
|
Net Debt to Adj. EBITDA
|
11.1
|
8.9
|
8.4
|
|
EBITDA Interest Coverage
|
3.8
|
2.2
|
0.7
|
|
Adj. EBITDA Interest Coverage
|
2.3
|
1.9
|
1.7
|
|
Source: Company report, iFAST
compilations.
*Adj. EBITDA
removes non-cash contributions (from losses/gains of OUE’s equity-accounted
investees).
** The above ratios
have treated perpetual securities as debt. Coverage ratios also include distributions from perpetual securities.
|
Recommendations
Table 3: OUE’s ’29 bond offers the highest yield amongst its peers
|
Bond
Name
|
Issuer
|
Bond
Price
|
Years
to Maturity
|
Yield
to Maturity (%)
|
|
OUESP 4.000% 08Oct2029 Corp (SGD)
|
OUE Treasury
|
99.7
|
4.42
|
4.09
|
|
HOBEE 4.350% 11Jul2029 Corp (SGD)
|
Ho Bee
Land
|
102.3
|
4.18
|
3.70
|
|
GUOLSP 4.400% 27Jul2028 Corp (SGD)
|
GuocoLand Investment
|
102.6
|
3.22
|
3.53
|
|
WINGTA 4.380% 03Apr2029 Corp (SGD)
|
Wing Tai
Holdings
|
103.2
|
3.91
|
3.50
|
|
FPLSP 3.000% 09Oct2028 Corp (SGD)
|
Frasers
Property
|
99.2
|
3.26
|
3.25
|
|
CITSP 3.397% 24Oct2029 Corp (SGD)
|
City Developments
|
100.8
|
4.47
|
3.21
|
|
Source:
Bondsupermart, iFAST compilations. Data as of 8 May 2025
|
In our view, the credit profile for OUE remains stable. Despite a moderation in debt metrics, the Group’s liquidity has improved, and we expect a stable earnings outlook, anchored by OUE REIT’s resilient Singapore-focused assets. We see little risk in financing and debt servicing for OUE, especially in the near term, on both a consolidated and stand-alone basis.
We like OUESP OUESP 4.000% 08Oct2029 Corp (SGD) and find its yield (~4.0%) attractive. It is one of the highest-yielding real estate developer SGD bonds, trading 40 - 90bps wider against other issuances with similar tenors (Table 3). Typically, wider yields correspond to higher credit risk, but for OUESP 4.000% 08Oct2029 Corp (SGD), we do not think the issuer (OUE) has significantly higher credit risk than other developers in Table 1. Therefore, the 4% yield from OUESP 4.000% 08Oct2029 Corp (SGD) remains compelling to us.
Overall, OUESP 4.000% 08Oct2029 Corp (SGD) provides attractive yield within the SGD corporate bond space, especially for investors hunting for 4% (and above) yields – which is an increasingly rarer find. We think the note can also be a good hold-to-maturity option for investors to lock in decent yields in the medium term.
Declaration: For specific disclosure, at the time of publication of this report, IFPL (via its connected and associated entities) holds a position in HOBEE 4.350% 11Jul2029 Corp (SGD) and the analyst who produced this report holds a NIL position in the abovementioned securities.
Our podcast series, Yield Hunters, is available on Spotify, iTunes Podcasts and Google Podcasts. We share our thoughts on new bond issues and hold discussions on the fixed income space. Listen to our latest episode below and follow us!