Receive first-hand news on the latest bond issues, credit updates and special events when you join us on our Telegram channel at https://t.me/bondsupermart!
Highlights:
- Phoenix Group has a long history as a large insurance company in the UK. In recent years, the Group has continued to acquire its peers to expand its insurance footprint.
- The Group has robust operations with risk management strategies to lock in cash flows. The cash flows can remain stable in different market conditions. The Group’s liquidity continues to improve, with a better-than-peers leverage ratio.
- Investors can consider its 2025 GBP bond, with a yield to maturity of 7.4%.
Phoenix Group is a large insurance company in the UK, formerly known as Pearl Group. The Group’s insurance business can trace back to 1914. The Group currently engages in life insurance and reinsurance, wealth management and pension businesses. There are presently 13 million customers and assets under administration of £270 billion.
The Group is currently listed on the London Stock Exchange (Stock Code: PHNX.LN), with a market capitalisation of around £5.1 billion.
Continued to Acquire Peers to Expand Insurance Footprint
As shown in Chart 1, Phoenix Group has a number of insurance subsidiaries, including Phoenix Life, Standard Life and ReAssure Life, where the Group has continued to acquire its peers in the past, including Standard Life from abrdn for £3.28 billion in 2018 and ReAssure from Swiss Re in 2019 for £3.3 billion (see Table 1). All of these companies are primarily engaged in life insurance and pension businesses in the UK. These help the Group to increase its market share and expand its insurance footprint.
Table 1: The Group’s Current Structure (Simplified Version)
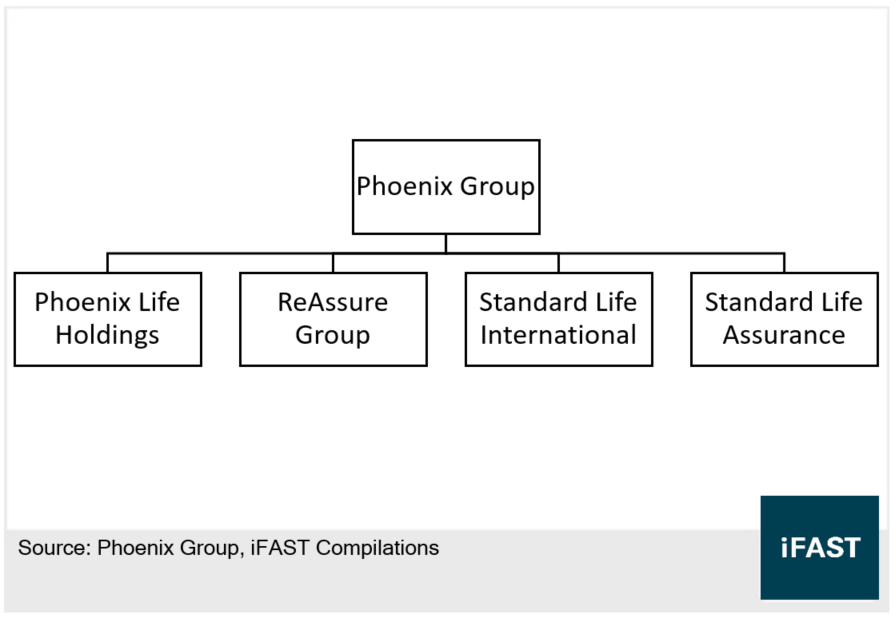
Table 1: The Group’s Large Acquisition Records in the Past Few Years
|
Date |
Acquisition Price |
Target Company |
Seller |
Target Company’s Main Businesses |
|
May 2016 |
£375 million |
AXA’s UK Insurance, Investment and Pension Businesses |
AXA |
Insurance, Investment and Pension Businesses |
|
August 2018 |
£3.24 billion |
Standard Life |
abrdn (formerly known as Standard Life Aberdeen) |
Life Insurance and Pension Businesses |
|
December 2019 |
£3.3 billion |
ReAssure |
Swiss Re |
Life Insurance and Pension Businesses |
|
August 2022 (Not completed) |
£248 million |
Sun Life Financial of Canada UK |
Sun Life Financial |
Life Insurance, Pension and Annuity Businesses |
|
Sources: Company’s Announcements, Internet Resources, iFAST Compilations Data as at 4 August 2022 |
||||
Robust Operations with Risk Management Strategies to Lock In Cash Flows
As shown in Table 2, the first half of 2022, Phoenix Group’s operating companies’ cash generation increased by 15% to £950 million, and the operating profit also increased by 4% to £530 million. The overall performance is robust. The incremental new business long term cash generation doubled YoY to £430 million, which might reflect a cash flow growth in the coming years.
The operating companies’ cash generation means the actual cash flows from the Group’s subsidiaries to the holding company level, which is similar to the operating cash flows in other industries.
The incremental new business long-term cash generation means the expected cash generation in the next few years of the new business acquired within the period. The figure would be reflected gradually in the future results and the operating companies’ cash generation. It is to foresee the future growth in the cash flows.
Since the Group’s operating profit is determined by a number of assumptions or expectations related to the investment portfolio, it might not show the actual profitability for the period. Therefore, it is used as a supplementary indicator for reference purposes only.
Table 2: The Group’s Main Operating Indicators
|
2022 1H |
2021 1H |
YoY Change (%) |
2021 Full Year |
2020 Full Year |
|
|
Operating Companies’ Cash Generation (GBP million) |
950 |
830 |
15% |
1,720 |
1,710 |
|
Incremental New Business Long term Cash Generation (GBP million) |
430 |
210 |
109% |
1,180 |
770 |
|
Operating Profit (GBP million) |
530 |
510 |
4% |
1,230 |
1,200 |
|
Asset Under Administration (GBP billion) |
268.8 |
304.4 |
-12% |
310.4 |
337.7 |
|
Sources: Company’s Reports, iFAST Compilations Data as at 30 June 2022 |
|||||
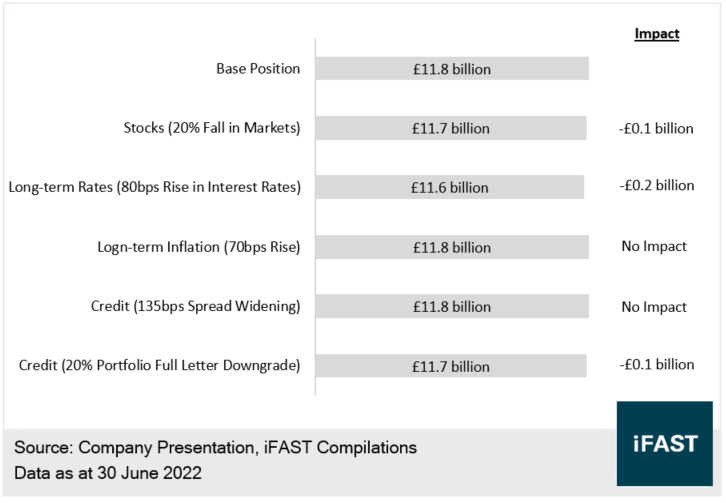
In addition, the Group estimated its latest long-term free cash was £11.8 billion. The long-term free cash represents the total cash flows expected to be generated by the Group from operating companies and new businesses over a long period of time in the future, plus the cash currently available at the Group’s holding company level, assuming repayment of all debts and interests for the period and net of costs associated with M&A. In simple terms, this indicator reflects the Group’s long-term net business value and cash flow performance.
Although the market was volatile in the first half of the year, resulting in a decline in the Group's assets under administration, overall cash flow remained good and operating performance was solid.
As shown in Chart 2, the Group's long-term free cash was virtually unaffected by common market conditions, including a fall in the stock market, a rise in interest rate, an increase in the long-term inflation rate, widening credit spreads and bond rating downgrades.
This is due to the use of different hedging strategies that help to lock in future cash flows. Therefore, the Group's long-term free cash would remain stable in different market conditions and hence it ensures the Group's liquidity.
Chart 2: The Sensitivity Test of the Group’s Long-term Free Cash under Different Market Conditions
Liquidity Continues to Improve, with Better-than-Peers Leverage Ratio
As shown in Chart 3, in the first half of 2022, Phoenix Group’s shareholder capital coverage ratio (total eligible own funds / solvency capital requirement) increased to 186%, which was also higher than the guidance range of 140% to 180%. It shows that its liquidity has continued to improve.
Chart 3: The Group’s Shareholder Capital Coverage Ratio
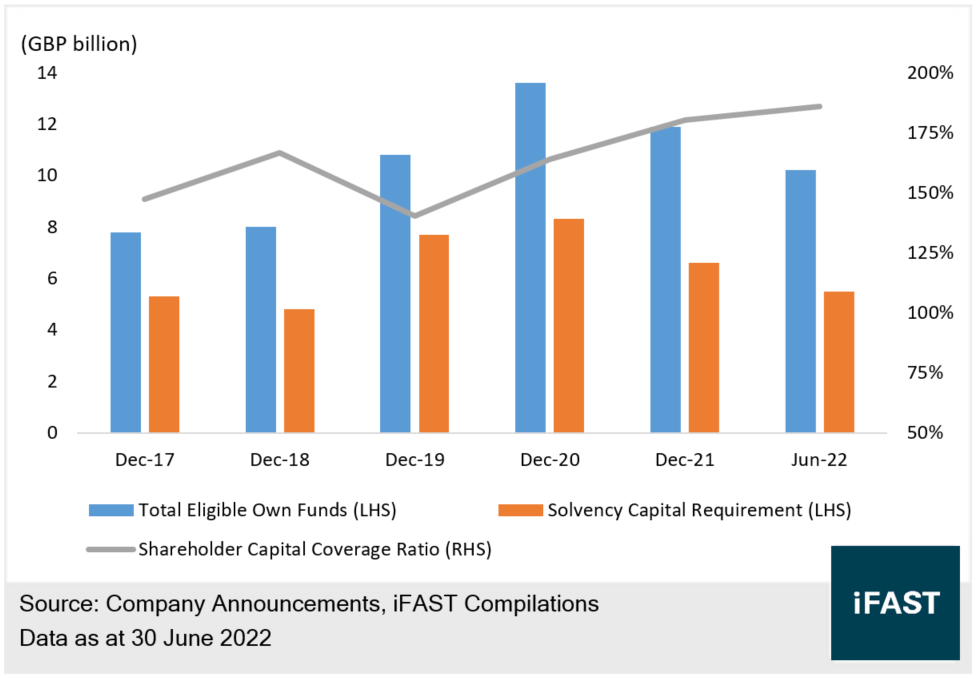
Compared to the peers (see Table 4), the Group’s shareholder capital coverage ratio was slightly lower than the peers’, but it was still much larger than the Solvency II regulatory requirement, i.e. 100%. Nevertheless, the Group’s leverage ratio was better than peers’. The leverage level is quite decent.
Table 3: The Peers’ Shareholder Capital Coverage Ratios and Leverage Ratios
|
|
Shareholder Capital Coverage (%) |
Leverage Ratio (%)* |
|
Phoenix Group |
186% |
28% |
|
Legal & General |
212% |
32% |
|
Aviva |
234% |
30% |
|
Just Group |
184% |
26% |
|
Admiral Group |
185% |
44% |
|
Direct Line Insurance Group |
152% |
21% |
|
AXA |
227% |
27% |
|
Aegon |
214% |
23% |
|
*Leverage Ratio = Total Debt / (Total Debt + Total Equity), the lower is better Sources: Bloomberg Finance L.P., Company Reports, iFAST Compilations Data as at 30 June 2022 |
||
Margin Call Events of Pension Funds are Expected to have Little Impact on the Group
In mid-September, the market worried about the impacts of the peers’ margin call events on the Group’s pension business, resulting in a huge drop in its stock price.
The events started from the UK government announcing the mini-budget, i.e. radical tax cuts and energy subsidies. The British pound depreciated quickly and sharply. The pound hit a 30-year low against the USD. At the same time, the UK government bonds fell significantly, resulting in a sharp rise in government bond yields of all tenors within a short period of time. A sharp increase in bond yields caused some pension funds to face funding shortfalls. They are required to put additional margin by the counterparties.
As most UK pension funds take advantage of interest rate swaps, Collateralized Debt Obligations (CDOs) and other derivatives as part of their “Liability-Driven Investment (LDI)” strategies, these funds might need to sell treasuries, bonds and equities to tackle the liquidity crises. The market also views this as the beginning of UK financial crisis. The systemic risk in the UK is increasing.
In view of this, the Bank of England (BoE) immediately announced an unlimited buyback of long-term government bonds in an attempt to stabilise the foreign exchange rate and bond market. Besides, the UK government even withdrew the mini-budget and may switch to contractionary fiscal policies such as a tax hike. We believe that the government and the BoE would continue to rescue the market. It is unlikely that there is a systemic crisis in the UK which is close to the level of 2008 Global Financial Crisis.
On the other hand, in terms of structures, insurance companies, including the Group, are subject to the European Union Solvency II capital requirements. They thus have a certain amount of liquidity buffer, which allows them to cope with the shocks in the financial system. The margin call events of pension funds are expected to have little impact on the Group’s solvency.
Investors can Consider 2025 GBP bond, with a Yield to Maturity of 7.4%
Investors who expect a rebound in pound and seek a high return can consider Phoenix Group’s GBP bond. The net yielding of the bond due in December 2025 is as high as 7.2% (see Table 4). The Group’s issuer rating is A+ (Fitch), and this bond credit rating is BBB+ (Fitch), which belongs to the investment grade category.
Table 4: The Group’s 2025 GBP Bond
|
Bond Name |
Currency |
Years to Maturity |
YTM |
|
GBP |
3.2 |
7.4% |
|
|
Source: FSMOne Data as at 28 October 2022 |
|||
This bond does not have a call date, nor does it have a coupon reset date. But there are two features of this bond, namely deferred interest payment and extendable tenor. If the regulatory authority makes a judgement that the Group falls into operation crisis, the Group might need to suspend paying coupons (and accumulate the coupons until the regulatory authority approves it to pay coupons again) or/and delay the maturity date of the bond. Under these circumstances, the bond is not still considered as defaulted.
Bond Related Risks
Features of the bond include deferred interest payment and extendable tenor. Hence, the bond credit rating is lower than the issuer’s credit rating. It is riskier than general bonds.
The Group’s shareholder asset portfolio consists of around 30% illiquid assets. It has a higher proportion of illiquid assets than its peers. Once the Group needs to liquidate its assets in exchange for liquidity, it might need to dispose of its illiquid assets at a larger discount, or may not be able to sell these assets, thus affecting its solvency.
Conclusion
Phoenix Group has a long history as a large insurance company in the UK. In recent years, the Group has continued to acquire its peers to expand its insurance footprint.
The Group has robust operations with risk management strategies to lock in cash flows. The cash flows can remain stable in different market conditions. The Group’s liquidity continues to improve, with a better-than-peers leverage ratio.
Investors can consider its 2025 GBP bond, with a yield to maturity of 7.4%.
Declaration: For specific disclosure, at the time of publication of this report, IFPL (via its connected and associated entities) and the analyst who produced this report hold a NIL position in the abovementioned securities.
Our podcast series, Yield Hunters, is available on Spotify, iTunes Podcasts and Google Podcasts. We share our thoughts on new bond issues and hold discussions on the fixed income space. Listen to our latest episode below and follow us!