Introduction
Affin Bank is one of the smaller listed banks in Malaysia, with market capitalisation of RM5.3 billion as of 5 October 2026.
Table 1: Universe of Malaysia listed banks
|
|
Market Cap |
|
MALAYAN BANKING BHD |
120.9B |
|
PUBLIC BANK BERHAD |
91.4B |
|
CIMB GROUP HOLDINGS BHD |
83.6B |
|
HONG LEONG BANK BERHAD |
49.6B |
|
RHB BANK BHD |
32.6B |
|
AMMB HOLDINGS BHD |
21.5B |
|
HONG LEONG FINANCIAL GROUP |
21.1B |
|
ALLIANCE BANK MALAYSIA BHD |
8.1B |
|
AFFIN BANK BHD |
5.3B |
|
MBSB BHD |
4.4B |
|
BANK ISLAM MALAYSIA BHD |
4.7B |
|
Source: Bloomberg, iFAST compilations. Data as of 5 October 2026. |
|
With its subsidiaries, the group provides retail & corporate banking, investment banking & stockbroking, Islamic banking, money broking and insurance activities.
What stood out in this bank is its strategic investors, with the likes of Sarawak Government, The Bank of East Asia Limited, and Lembaga Tambung Angkatan Tentera (LTAT), statutory body that manages pension fund for Malaysian armed forces.
As per the latest known filing date (27 February 2026), Sarawak government holds 31.25% of stakes, while Bank of East Asia and LTAT hold 23.93% and 21.12% respectively.
Nonetheless, Affin Bank operates as a commercially independent, BNM-regulated public bank.
Growth gaining traction, but profitability still has room to improve
Since Group CEO Datuk Wan Razly Abdullah took charge in 2020, Affin Bank has gradually transitioned from a traditionally military-linked bank under LTAT into a more diversified commercial banking group.
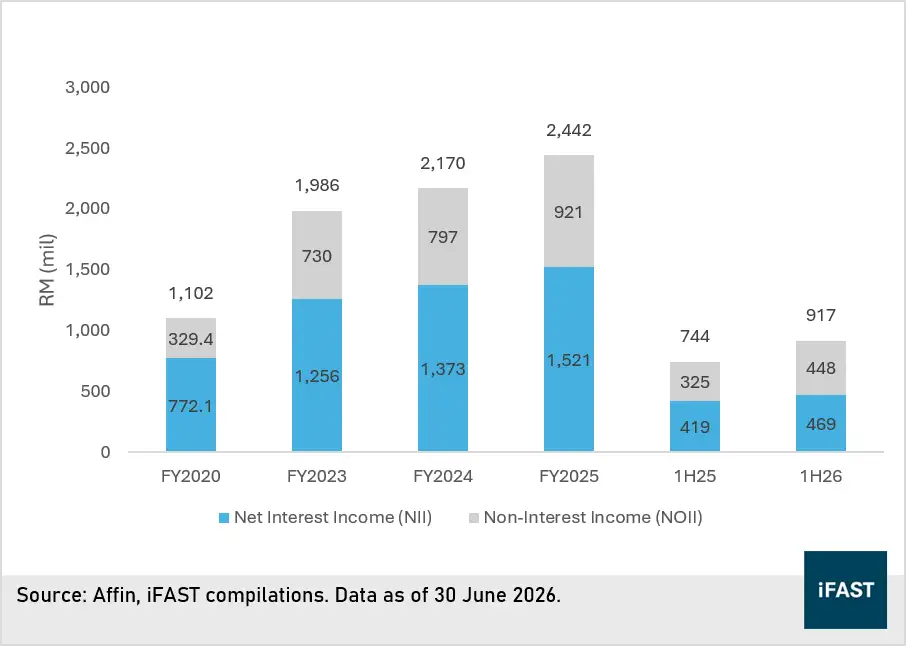
In 1H26, NII grew 12% yoy to RM469 million, while NOII rose 38% yoy to RM448 million. The increase in NII was supported by both loan growth and an improvement in net interest margin (NIM). The group has successfully lowered its cost of funds, allowing NIM to improve despite the 25bps OPR cut in July 2025, which increased from 1.42% in FY23 to 1.52% in 2Q26.
Nonetheless, it remains well below that of larger domestic peers, with Maybank, Public Bank and CIMB Bank recording NIMs of 2.14%, 2.11% and 2.06%, respectively. We therefore see further NIM improvement as an important area for management to address.
Table 2: Increase in both gross loan & net interest margin
|
Period |
Gross Loans (RM Billion) |
Net Interest Margin (NIM) |
|
FY23 |
65.2 |
1.42% |
|
FY24 |
70.9 |
1.45% |
|
FY25 |
79.5 |
1.45% |
|
2Q25 |
74.1 |
1.48% |
|
2Q26 |
84.1 |
1.52% |
|
Source: Affin, iFAST compilations. Data as of 30 June 2026. |
||
Table 3: NIM comparison with peers
|
|
Last known net interest margin (%) |
|
Maybank |
2.14 |
|
Public Bank |
2.11 |
|
CIMB Bank |
2.06 |
|
AmBank |
1.98 |
|
RHB Bank |
1.91 |
|
Affin Bank |
1.52 |
|
Source: Companies report, iFAST compilations. Data as of 18 August 2026. |
|
Also, if we annualise Affin’s 1H26 earnings, they would come in below FY25’s full-year level, mainly due to a sharp increase in impairment allowances (RM147m in 1H26 vs RM31m in FY25), lower contributions from insurance associates (RM12m in 1H26 vs RM46m in 1H25), and lower net gains on financial instruments.
The higher impairment charges reflect pressure on lower-income households and selected retail/SME borrowers amid persistent cost-of-living pressures. Nonetheless, as management tightens its underwriting standards, we believe the group should be better positioned to rein in credit costs and limit the need for higher impairment allowances going forward, hence we are still comfortable with Affin’s earning drivers as a whole.
Diversifying revenue streams to reduce reliance on interest income
As part of its strategy to reduce reliance on interest rate cycles, Affin Bank has been actively expanding its non-interest income streams.
The group is pursuing several initiatives, including
1) Acquisition of Pheim Asset Management to boost fee income.
2) Shifting toward a wholesale banking model, combining Corporate, Treasury, and Investment Banking to capture more fee-based deals.
3) Received approval from Bank Negara Malaysia to establish a new private equity arm. The new addition is looked to enhance corporate advisory proposition and enable the group not only to advise clients on transactions and capital structuring, but also to participate alongside.
Despite strong NOII growth, its contribution to total income declined slightly to 34% in 1H26 from 37% in 1H25, as stronger loan growth and lower net gains on financial instruments boosted NII's relative contribution. Nevertheless, we expect management to continue prioritising NOII growth, as NII continue to be competitive.
Table 4: Contribution of NII and NOII to total income
|
|
Net Interest Income (NII) |
Non-Interest Income (NOII) |
|
FY23 |
63% |
37% |
|
FY24 |
63% |
37% |
|
FY25 |
62% |
38% |
|
1H25 |
63% |
37% |
|
1H26 |
66% |
34% |
|
Source: Affin, iFAST compilations. Data as of 30 June 2026. |
||
Asset quality edges weaker, prompting tighter underwriting
Asset quality has shown modest signs of deterioration, with Stage 3 loans increasing from RM1.3 bil in 2025 to RM1.5 bil in 1H26. Consequently, the gross impaired loan (GIL) ratio rose from 1.64% to 1.82% over the same period. Nonetheless, we view the deterioration as manageable for now. Management highlighted that RM290 million of mortgage loans are currently undergoing the legal auction process, of which RM62 million have already been sold and are awaiting proceeds.
In response, management has indicated that it is tightening mortgage underwriting standards and adopting a more cautious approach towards new credit origination. We believe these measures should help contain further deterioration, although asset quality remains an area to monitor as the loan book continues to expand.
Table 5: Impairment model (RM bil)
|
Period |
Stage 1 (Performing) |
Stage 2 (Underperforming) |
Stage 3 (Impaired) |
Total Gross Loans |
|
FY22 |
53.5 |
4.6 |
1.2 |
59.3 |
|
FY23 |
59.6 |
5.8 |
1.3 |
66.7 |
|
FY24 |
65.9 |
4.8 |
1.4 |
72 |
|
FY25 |
73.0 |
5.2 |
1.3 |
79.5 |
|
1Q26 |
75.5 |
5.2 |
1.4 |
82.1 |
|
2Q26 |
77.6 |
5.0 |
1.5 |
84.1 |
|
Source: Affin, iFAST compilations. Data as of 30 June 2026. |
||||
Standalone loan loss coverage (LLC) has trended lower over the years, declining from 123.8% in 2022 to 71.2% as of 2Q26. On a peer basis, Affin’s coverage is broadly in line with lower-coverage peers such as AmBank and RHB Bank, at 70.1% and 73.2%, respectively, but remains well below the >100% levels maintained by Maybank, CIMB and Public Bank.
Including regulatory reserves, Affin’s total coverage improves to 116.8%, providing an additional buffer against potential credit losses. Nevertheless, its provisioning cushion remains relatively lean compared with the larger domestic banks, leaving less room to absorb a meaningful deterioration in asset quality.
Table 6: Latest published loan loss coverage
|
|
Loan loss coverage (excluding regulatory reserve) |
Loan loss coverage (including regulatory reserve) |
|
Maybank |
104.4% |
115.7% |
|
Public Bank |
147.0% |
251.2% |
|
CIMB Bank |
101.8% |
133.7% |
|
AmBank |
70.1% |
102.5% |
|
RHB Bank |
73.2% |
114.3% |
|
Affin Bank |
71.2% |
116.8% |
|
Source: Companies report, iFAST compilations. Data as of 30 June 2026 (Affin). |
||
LDR crosses 100%, but liquidity buffer remains comfortable
Affin Bank’s balance sheet has expanded aggressively in recent years, with loan growth outpacing deposit growth. Its loan-to-deposit ratio (LDR) rose steadily from 92.1% in FY23 to 99.2% in FY25, before crossing the 100% threshold to reach 103.8% in 1H26.
An LDR above 100% indicates that customer deposits alone are no longer sufficient to fully fund the loan book, increasing the group’s reliance on alternative funding sources such as medium-term notes. While this allows Affin to maximise earning assets, it also increases funding sensitivity and warrants monitoring as loan growth continues.
The group has nevertheless taken steps to strengthen its deposit base, including efforts to onboard more corporate payroll accounts and term investment accounts, alongside the launch of regional-themed cards. In May 2026, Affin also issued AT1 perpetual securities at 4.35% p.a., providing an additional source of capital.
Meanwhile, Affin’s liquidity coverage ratio (LCR) declined from 174.1% in FY23 to 152.3% in 1H26, partly reflecting clients’ shift from low-cost CASA deposits towards higher-yielding fixed deposits amid intense competition for deposits. Despite the decline, the LCR remains comfortably above BNM’s 100% minimum requirement, providing a sizeable buffer against potential short-term liquidity stress.
Table 7: Liquidity ratio
|
|
Loan to deposit ratio |
Liquidity coverage ratio |
|
FY23 |
92.10% |
174.10% |
|
FY24 |
96.70% |
165.20% |
|
FY25 |
99.20% |
162.40% |
|
1H25 |
94.07% |
171.10% |
|
1H26 |
103.79% |
152.30% |
|
Source: Affin, iFAST compilations. Data as of 30 June 2026. |
||
Capital ratio eases on rapid loan growth, but buffers remain adequate
Affin’s capital ratios have moderated alongside its rapid balance sheet expansion. Strong 13.5% yoy loan growth drove an increase in risk-weighted assets, resulting in the CET1 ratio declining to 12.62% as of 30 June 2026 from 13.34% at end-2025. The Tier 1 and total capital ratios also eased to 14.58% and 17.05%, respectively.
Despite the moderation, capitalisation remains comfortably above regulatory minimums. We therefore do not see an immediate capital adequacy concern, although continued balance sheet expansion could place further pressure on capital ratios.
Table 8: Capital adequacy ratio
|
|
Min. requirement |
31-Dec-23 |
31-Dec-24 |
31-Dec-25 |
30-Jun-26 |
|
CET1 capital ratio |
7.00% |
13.76% |
13.22% |
13.34% |
12.62% |
|
Tier 1 capital ratio |
8.50% |
15.29% |
14.64% |
14.70% |
14.58% |
|
Total capital ratio |
10.50% |
17.95% |
17.06% |
17.22% |
17.05% |
|
Source: Company report, iFAST compilations. Data as of 30 June 2026. |
|||||
Conclusion
Overall, Affin Bank is pursuing an aggressive growth strategy, which has supported strong growth in both NII and NOII. However, rapid balance sheet expansion has also brought several emerging pressure points, including higher impaired loans, a LDR above 100%, a thinner provisioning cushion and a decline in the CET1 ratio.
That said, we believe these risks remain manageable at this juncture. Management has room to address the emerging pressure points through tighter underwriting standards, higher provisioning, stronger deposit mobilisation and additional capital raising, where necessary.
With the group’s capital and liquidity ratios still comfortably above regulatory requirements, we believe Affin’s overall credit profile remains sound, although its aggressive growth trajectory warrants closer monitoring.
Table 9: Affin’s bond on platform (subject to liquidity)
|
|
Outstanding bond |
Years to next call/Years to maturity |
|
Bond price |
Yield to worst |
|
520 mil |
- /1Y3M |
Senior unsecured |
101.0 |
3.86% |
|
|
500 mil |
2Y0M/ - |
AT1 |
101.8 |
4.14% |
|
|
500 mil |
1Y8M/ - |
AT1 |
102.3 |
4.25% |
|
|
500 mil |
0Y9M/ 5Y9M |
Tier 2 |
100.9 |
3.81% |
|
|
300 mil |
3Y8M/ - |
Senior unsecured |
97.82 |
5.79% |
|
|
Source: Bondsupermart, iFAST compilations. Data as of 5 October 2026. |
|||||