- CLCT saw trouble
in its business operation in FY22 due to full or partial lockdowns implemented
across cities in China.
- In 1Q23, signs
of recovery were seen in its gross revenue and net property income, which were
primarily driven by its retail sector and backed by an improvement in retail
occupancy rates.
- Macroeconomic environment shows a promising outlook
for the retail sector.
- Credit profile stays competitive against other bigger
REITs.
- We like CRCTSP 2.400% 29Jun2028 Corp (SGD) as it offers one of the higher yields amongst other REITS with issues that are about the same maturity date.
About CapitaLand China Trust & involvement in the retail sector
Capitaland China Trust (“CLCT”) managed by CapitaLand China Trust Management Limited (“CLCTML”), is the largest China-focused real estate investment trust (REIT) listed in Singapore. CLCT focuses on investing and managing income-generating properties in China that are used primarily for retail, office and industrial purposes (including business parks, logistics facilities, data centres, and integrated developments). It is a subsidiary of CapitaLand Limited, a leading global real estate investment manager with a strong Asia foothold.
CLCT has total assets of approximately SGD 5.2b as of 31 December 2022 and a portfolio that constitutes 11 shopping malls, five business parks and four logistics parks across Tier-1 and Tier-2 cities in China. The geographically diversified portfolio has a total gross floor area (GFA) of approximately 2.0 million square metre (sq m), located across 12 leading cities in China.
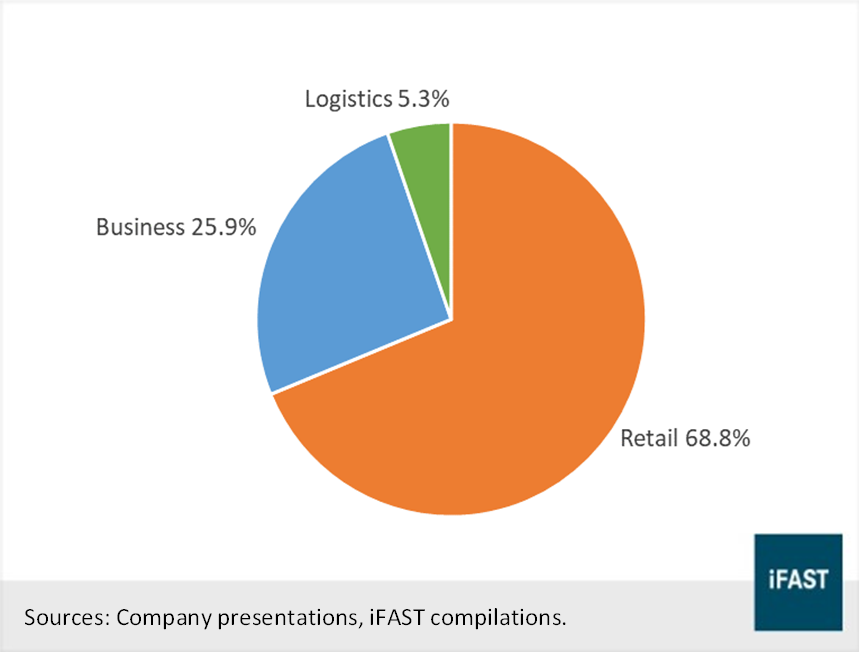
Chart 1Proportion of Gross Rental Income across
different types of properties
CLCT's
retail properties will be the main point of focus given that they account for
the majority of the company's Gross Rental Income (GRI) at 68.8%, and this
segment shows the greatest potential for income growth in this current
environment. China recently announced a complete relaxation of its Zero-COVID
Policy, and it is anticipated that domestic consumption will rise as a result.
Slowing financial performance of CLCT in 1Q23 due to COVID-19
Table 1Gross Revenue and Net Property Income of
CLCT
|
As of 31/3/2022 |
As of 31/3/2023 |
% Change Year-on-Year |
|
|
Gross Revenue |
489.9 |
475.5 |
-2.9% |
|
Net Property Income |
344.5 |
339.1 |
-1.6% |
|
Sources: Company presentations, iFAST compilations. |
|||
For the three months ended 31 March 2023 (“1Q23”), CLCT’s Gross Revenue and Net Property Income experienced an overall slight decrease at -2.9% to RMB 475.0m and -1.6% to RMB 339.1m year-on-year (“yoy”) respectively.
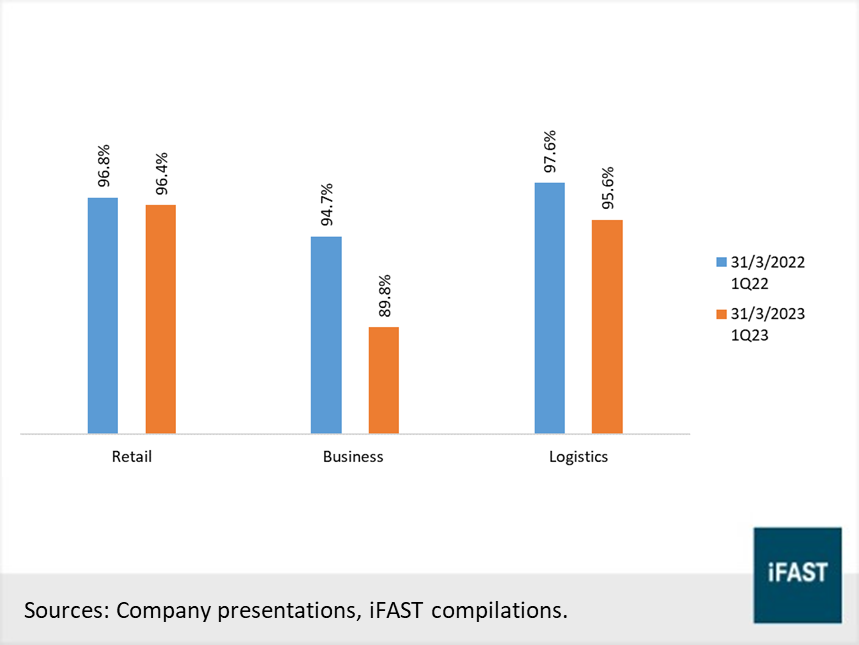
Chart 2Occupancy Rates across various property
types
Coupled
with the drop in financial performance, CLCT’s occupancy rate saw a similar
drop spanning across all three sectors of the portfolio – with retail falling
by 0.4% to 96.4% yoy, Business Parks dropping 4.9% to 89.8% yoy and Logistics
Park dropping 2% to 95.6% yoy.
Driving those revenue figures and occupancy rates down in 1Q23 can be associated with the events occurring in 2Q22, where full or partial lockdowns were implemented across cities in China, including Shanghai. Due to the stringent pandemic restrictions, CLCT’s operations were affected by long periods of COVID-19 lockdowns during the year, particularly in 2H22. Consequently, total tenant sales and traffic decreased 12.7% and 20.1% year-on-year respectively for FY2022. It was only in late December when the Chinese government lifted its ‘Zero-COVID’ policy that CLCT saw hope in those figures reversing, with shopper traffic growing 57.9% week-on-week in the final week of December 2022. Hence, with CLCT taking a hit in its operations in the second half, it is still in a position of recovery resulting in an overall slower performance for the first quarter of 2023 when compared yearly.
The fall is also said to be attributable to the effects of CapitaMall Qibao winding down, downtime from assets undergoing AEIs/Unit reconfiguration as well as lag time from committed occupancy handovers.
Retail properties driving CLCT’s rebound
Chart 3Financial Performance by CLCT over past
quarters since 2022 (in RMB m)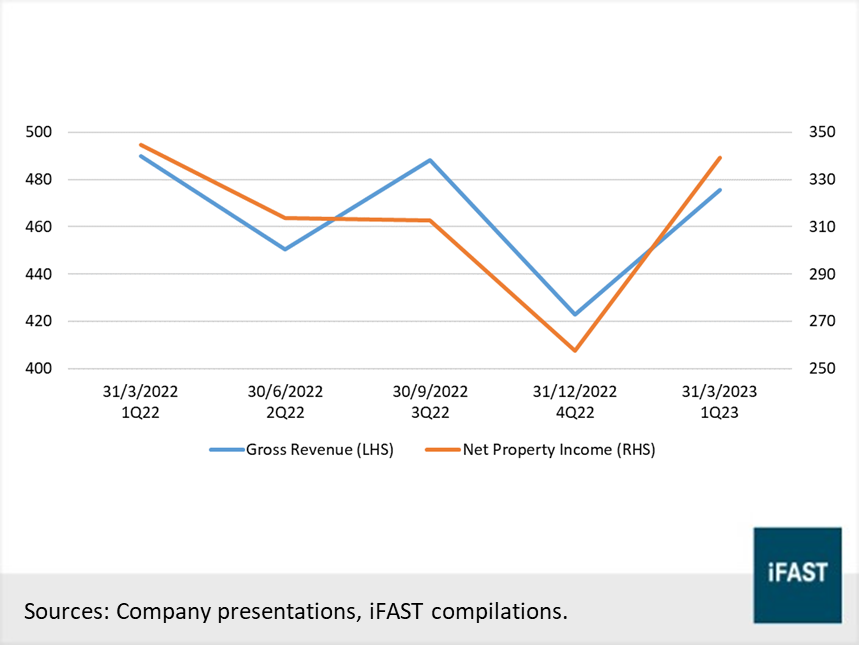
Chart 4
Occupancy Rate of Retail Properties over past quarters
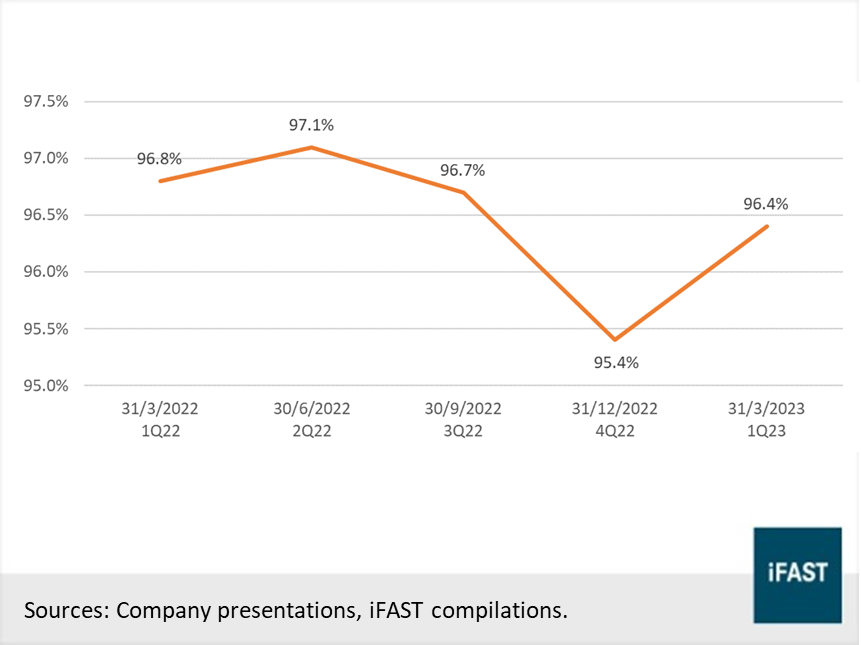
Comparing
the quarter-on-quarter data, we see that CLCT experienced a rebound in Gross
Revenue and Net Property Income with an increase of 12.4% and 31.6%
respectively. This rebound in 1Q23 is largely driven by its retail operation,
which is evident in its retail occupancy figures where it saw an improvement over
the last quarter, by a percentage point to 96.4% and proves to show that CLCT’s
business environment has improved.
Chart 5Occupancy Rate of Retail Properties by
individual malls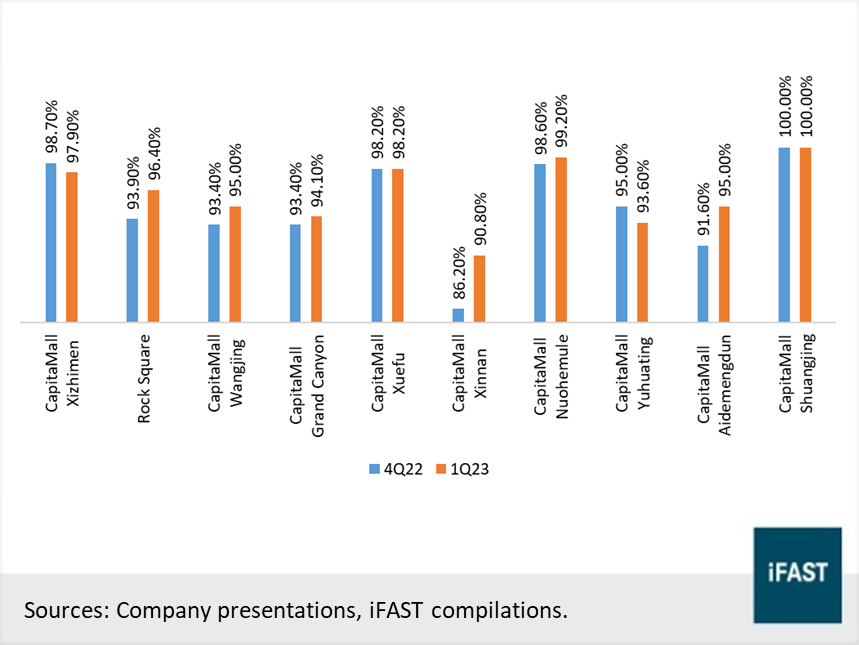
The majority of the malls saw an increase in occupancy rates and even with minor downtrends such as CapitaMall Yuhuating, performance from the mall remained well with a rental reversion of +112% being recorded due to an Asset Enhancement Initiative (AEI) that was conducted.
Traffic and retail sales also saw an upward trend this quarter with a 10.6% and 15.4% increase YoY respectively, with 1Q tenant sales reportedly reaching 95% of pre-COVID levels. These figures are led by strong first-quarter sales in important trade categories, such as food and beverage (+18.2% yoy), beauty and health (+10.3% yoy), leisure and entertainment (+26.3% yoy), and services (+101.3% yoy), revealing a significant return of consumers.
CLCT said retail leasing activity picked up in March after slower take-up in January and February, securing leasing of 31,862 sq m of retail space, representing 30% of FY 2023 expiring NLA. The Retail Weighted Average Lease Expiry ("WALE") for CLCT is 3.1 years by Net Lettable Area ("NLA") and 2 years by Gross Rental Income ("GRI"). The WALE of CLCT is favorably positioned among its counterparts in the retail REIT sector. The fact that WALE is just the right length—neither too short nor too long—enables CLCT to benefit from the favorable rental reversion it would need upon renewal, especially in light of the upbeat forecasts from the rebound in retail sales and traffic, while also maintaining a certain level of stability to the overall performance.
Despite the lockdown and setbacks in the operating environment for retail in the second half of 2022, CLCT's rental reversion saw its first positive figure from 3Q22, of +4.9%, and it continued the positive trend of rental reversion for the following next quarter with FY2022, of +2.7%, and 1Q23, of +3.1%, with consistent execution of AEIs on its properties.
The environment should prove to be advantageous for CLCT to negotiate higher rents for its properties in the near future, sustaining or allowing CLCT to experience more favorable rental reversion. This is especially so considering the continued AEI effects such as the CapitaMall Yuhuating AEI which was fully completed in 1Q23, which is expected to further contribute to the revenue from next quarter onwards.
Retail is expected to recover to pre-COVID-19 levels with lockdowns removed, combined with the Chinese government's push to recover the economy by focusing on consumer spending. We are optimistic about CLCT's upcoming performance because it has demonstrated remarkable fortitude in navigating the economic unpredictability.
Macroeconomic environment looking less bleak
As previously indicated, China's mobility limitations will be completely lifted starting in December 2022, and domestic expenditure is expected to rebound from the years when COVID lockdowns frequently slowed the economy.
Chart 6Forecasted Retail Sales Growth in 2023
and 2024 (year-on-year growth)
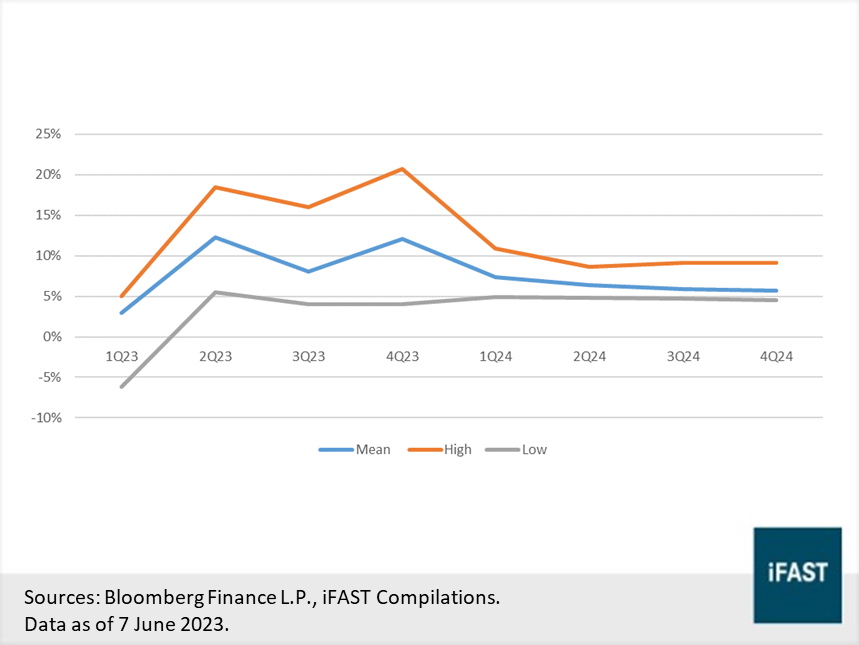
Retail sales in China increased by 18.4% yoy in April 2023, performing under the market prediction of 21% but dramatically accelerating from a 10.6% gain in the previous month, according to data issued by the National Bureau of Statistics of China. Similarly, forecasts from Bloomberg show that market predictions are well in the positive for retail sales YoY. Even across the low prediction for retail sales from 2Q23 to 2Q24, it is expected for retail sales to recover on average of at least 5% yoy.
Ultimately, we believe that even though the current economic data suggests that China’s recovery might be shaky, the continued recovery into 2023 will nonetheless support the growth in the retail sector, at least until it manages to recover back to the pre-COVID-19 levels. The
Chinese Central Bank is also providing support by altering its monetary
policies to encourage economic growth. For the majority of Chinese banks, the
reserve requirement ratio ("RRR") dropped by 25 basis points (“bps”)
in March, and it is anticipated that there will be additional reductions after
the second half of the year.
Similar to this, in the recent week, China's central bank unexpectedly introduced a short-term policy interest rate cut, showing signs that officials are increasingly concerned about faltering growth and are stepping up stimulus to boost the recovery. Therefore, we feel that the retail economic outlook for CLCT appears to be positive as these measures aim to make lending easier and boost spending in the Chinese economy.
CLCT’s Credit Profile
Table 2Several Credit Metrics for CLCT, MPACT
and CICT as of 1Q23
|
Capitaland China Trust (CLCT) |
Mapletree Pan Asia Commercial Trust (MPACT) |
Capitaland Integrated Commercial Trust (CICT) |
|
|
Gearing |
40% |
40.9% |
40.9% |
|
Interest Coverage Ratio (Adjusted) |
3.4 times |
3.5 times |
3.4 times |
|
Fixed Debt Proportion |
75% |
75.5% |
77% |
|
Average Term to Maturity |
3.7 years |
3 years |
4.2 years |
|
Weighted Average Cost of Debt |
3.48% |
2.68% |
3.10% |
|
Market Cap (in SGD Billions) |
1.9 |
6.3 |
13.2 |
|
Sources: Company presentations, iFAST Compilations. |
|||
We see that when comparing the overall credit metrics, particularly the gearing and interest coverage ratio, of CLCT amongst some of its notable SREITs peers involved in the Retail Industry, it stays highly competitive amongst them. It may also seem that the weighted average cost of debt of CLCT stands higher amongst its peers, but we believe this is because CLCT is generally a smaller operating REIT as compared to its giant peers with just a market cap of SGD 1.9b. Hence due to its size, the ability to loan at a favorable interest rate will be dampened.
Chart 7Debt Maturity Profile as of 1Q23
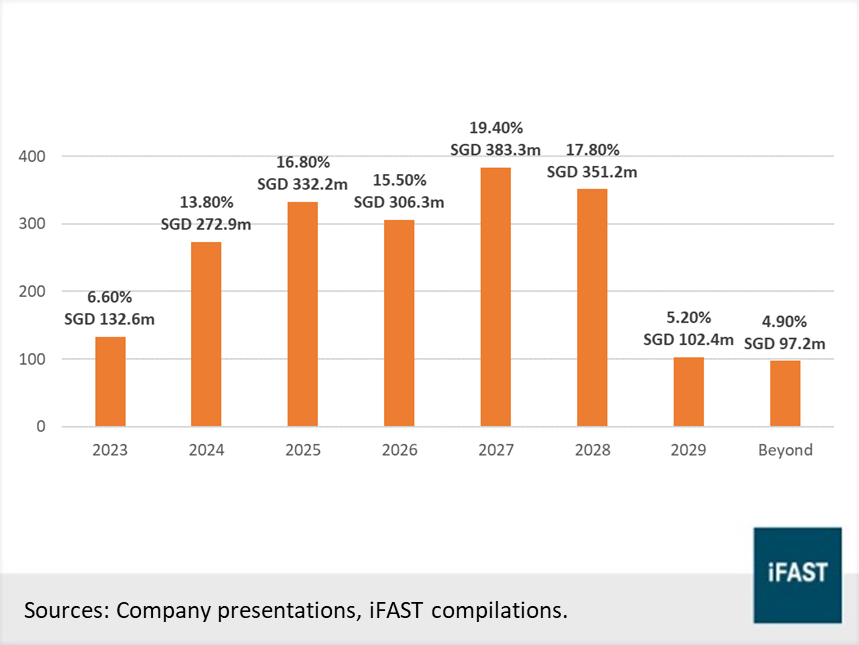
Short-term borrowings of CLCT stand at SGD 132.6m or about 6.6% of the total loan debt. Should CLCT choose to refinance this amount, we believe that it should not cause a large jump in the weighted average cost of debt, due to its diminutiveness.
Moreover, looking at its debt maturity profile, CLCT’s debts are well spread out across the next five years, averaging at about 16.7% of total debts looking for a refinance, which would help it maintain a stable cost of debt and also gives it the ability to comfortably capture opportunities of lowering its cost of debt.
Table 3Balance Sheet Highlights for CLCT, MPACT and CICT as of 1Q23
in SGD ’000s | Capitaland China Trust (CLCT) | Mapletree Pan Asia Commercial Trust (MPACT) | Capitaland Integrated Commercial Trust (CICT) |
Current Asset | 270,987 | 296,867 | 328,859 |
Current Liability | 517,441 | 985,558 | 1,605,157 |
Current Ratio | 0.52 | 0.30 | 0.20 |
Cash and Cash Equivalent | 231,048 | 195,202 | 248,396 |
Sources: Company presentations, iFAST Compilations. | |||
Current ratio of CLCT amongst its peers shows that it has one of the strongest liquidity profile amongst them while its current liabilities stand at one of the lowest. This is possibly due to the diversified debt portfolio it has created. Coupled with its cash position being approximately SGD 231m, and enough to cover its short-term borrowings, CLCT is unlikely to face hiccups in repaying its short-term debts.
Recommendations and Conclusion
Table 4Fixed Rate Issuances from CLCT, MPACT
and CICT
|
Issue |
Ask Price |
Years to Maturity |
Yield to Maturity |
|
90.93 |
5.06 |
4.35% |
|
|
97.15 |
4.22 |
3.78% |
|
|
95.65 |
6.46 |
3.82% |
|
|
92.78 |
4.75 |
3.78% |
|
|
Sources: Bloomberg Finance L.P., Bondsupermart, iFAST Compilations. Data as of 8 June 2023. |
|||
The fixed-rate bond CRCTSP 2.400% 29Jun2028 Corp (SGD) from CLCT has a yield to maturity of 4.35%. It offers one of the highest yields to maturity on its bond among its competitors with around the same remaining time to maturity, specifically in contrast to MCTSP and CAPITA.
We would recommend this to someone looking for a stable income bond as we believe CLCT is well-positioned for growth, with the Chinese economy attempting to recover by increasing consumer expenditure. CLCT also shows a healthy credit profile and stands competitive amongst its large industry competitors by providing a comfortable I-spread of 95.4 basis points as of today.
Overall, we are optimistic about CLCT’s business outlook, as the Chinese economy looks to rebound from the impact of COVID-19, it creates a conducive environment for CLCT's expansion. Moreover, the company benefits from the support of the central bank, which has implemented changes to monetary policies to stimulate economic growth. Furthermore, CLCT's management actively seeks growth opportunities, exemplifying their proactive approach. By engaging in various AEIs for its properties, CLCT demonstrates its commitment to exploring avenues that drive growth. With these interconnected factors at play, we believe that CLCT is poised for growth in the future.
Declaration: For specific disclosure, at the time of publication of this report, IFPL (via its connected and associated entities) holds a NIL position and the analyst who produced this report holds a NIL position in the abovementioned securities.
Our podcast series, Yield Hunters, is available on Spotify, iTunes Podcasts and Google Podcasts. We share our thoughts on new bond issues and hold discussions on the fixed income space. Listen to our latest episode below and follow us!