Receive first-hand news on the latest bond issues, credit updates and special events when you join us on our Telegram channel at https://t.me/bondsupermart!
Highlights:
- Western European countries have become more dependent on natural gas imports from the US, and an increase in the imbalance between supply and demand led to a sharp rise in US natural gas prices. We believe that US natural gas prices will stay at a higher level for a longer period of time, benefiting the upstream natural gas companies. Their credit profiles would improve significantly over time.
- Southwestern Energy has ample reserves. The company's cash flow performance is good, benefiting from high natural gas prices and past acquisitions of peers. The company hedged a large portion of natural gas ahead of time, but still benefits from the high price environment regardless of whether it reduces or increases the hedge position in the future.
- The company has a higher chance of moving towards investment grade this year. The credit risk is manageable in the short- to medium-term. Investors could consider their bond due in 2027, with a yield to maturity of 7.0%.
We discussed the outlook for the oil market in "Idea of the Week: Anton Oilfield Services – Capturing High Yield Opportunity in Oilfield Service".
In an environment of high oil prices and tight energy supply, the fundamentals and balance sheets of oil and gas companies have improved further, with more companies in good credit profiles. In addition, the yields on these bonds are generally higher than the yields on bonds under the non-cyclical sectors in terms of similar credit rating. We believe that investors could consider bonds issued by oil and gas companies for additional yield enhancement.
Southwestern Energy is the second largest natural gas company (in terms of daily production) in the U.S. after EQT Corporation. The company is currently listed on the New York Stock Exchange (NYSE: SWN.US) and has a current market capitalization of around USD 6.63 billion.
The company is primarily a natural gas (NG) producer, accounting for approximately 88% of total production, with crude oil and natural gas liquid (NGL) accounting for the remaining 12%. Understanding the U.S. natural gas market is more important than the crude oil price.
Natural Gas Glossary 101
Distinguish between Natural Gas and Natural Gas Liquid
To understand how the natural gas market works, it is important to first understand the difference between natural gas (NG), liquefied natural gas (LNG), compressed natural gas (CNG) and natural gas liquid (NGL). Investors can easily confuse these terms.
Liquefied natural gas (LNG) and compressed natural gas (CNG) are the gaseous products which result from the compression or purification of natural gas (NG). The unit of energy is the million British Thermal Units (MMBtu) or one thousand cubic feet (Mcf). One MMBtu is approximately equal to one Mcf.
On the other hand, natural gas liquid (NGL) is a kind of liquid produced during the extraction of natural gas. The properties and uses of natural gas liquid are closer to those of oil. It is mostly priced with reference to oil prices, generally at 40% to 60% discount of WTI crude oil. The energy unit is the same as that of crude oil, which is measured in barrels (Bbl).
Most natural gas companies produce both natural gas (NG) and natural gas liquids (NGL). However, the proportions between natural gas and natural gas liquids could vary significantly, depending on field characteristics, geographic locations or the company's exploration technology.
In
addition, when it comes to energy unit conversion, one Bbl of oil is equivalent
to six Mcf of natural gas. After conversion, the oil and natural gas quantities
can be added together in Mcfe (one thousand cubic feet equivalent) or Mboe (one
thousand barrel of oil equivalent).
US Natural Gas Market Outlook
Western European Countries Being More Dependent on Natural Gas Imports from the US
According to S&P Global Platts, the US natural gas supply is expected to fall short of demand through 2025. A shortfall of 1.9 Bcf per day (equivalent to 1,900 Mcf per day) through 2025 is expected (see Chart 1).
Chart 1: US Natural Gas Supply and Demand Forecast
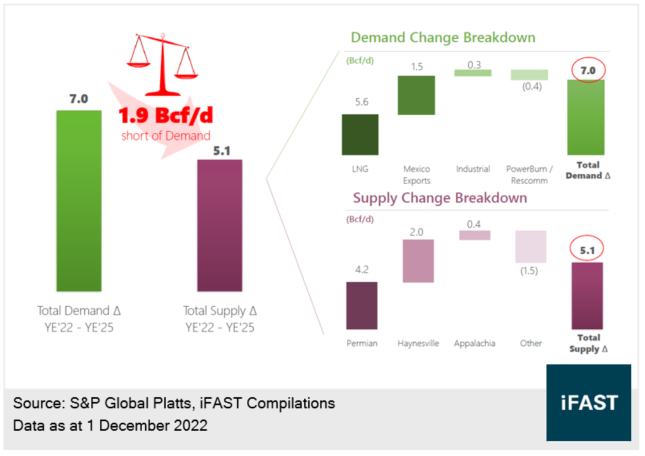
The demand side is mainly driven by the demand for liquefied natural gas (LNG) and electricity and increased exports from Mexico. While the supply is also expected to increase, such as the production in the Permian Basin and Haynesville Shale, but the demand is expected to increase faster than the supply. This might support the US gas prices.
In addition, some traditional US basins might begin to experience a decline in production capacity. A lack of the US energy infrastructure also puts pressure on the future gas supply growth. For example, it might not be able to efficiently export more gas due to the lack of pipelines. The processing facilities, such as liquefaction plants, are likely to reach their peak performance.
There are prolonged underinvestment in traditional energy, climate changes and the environmental concern caused by fossil fuels. Besides, due to Russia-Ukraine war, the European Union imposed sanctions against Russia, including oil embargo against Russia and setting a price ceiling on Russian oil. Some Western European countries refused to pay Russian Rubles to Russia, leading to a suspension of the natural gas supply by Russia. Together with other factors like Nord Stream pipeline explosion, Western European countries are more dependent on Natural Gas imports from the US. The imbalance between supply and demand has been aggravated, causing US natural gas prices to rise sharply.
US Natural Gas Prices will Stay at Higher Level for Longer Period of Time
As shown in Chart 2, amidst a large volatility, US natural gas prices sharply increased to over $8.5 in the middle of 2022. It has now fallen back to $4.5 level, but are still significantly higher than the median of around $3.0 over the past decade. The upstream companies can be beneficiaries under the high natural prices.
Chart 2: US Natural Gas Spot Price
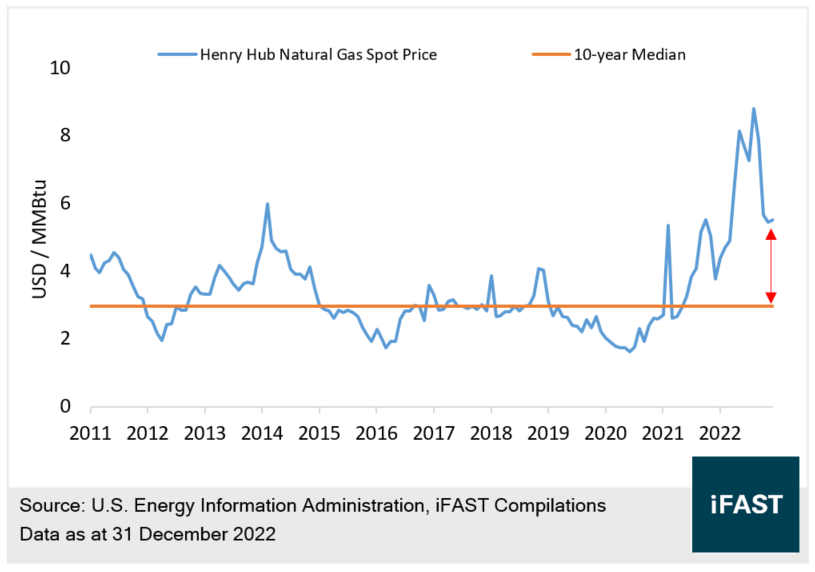
The US natural gas prices need to plunge around 30% to return to the median level of the past five years, providing a greater margin of safety in terms of prices. This would provide a greater buffer to the credit profile of natural gas companies.
Going forward, we believe the US natural gas prices will stay at a higher level for a longer period of time. However, the volatility of gas prices will be generally higher than that of oil prices. The short-term natural gas prices will be more influenced by international events and/or short-term changes in the supply and demand of some local regions.
Even so, if the natural gas prices fall sharply for a short period of time, this does not mean that the prices will recover to the situation similar to the last five years (where prices were low for a longer period of time, below $3 / Mcf). If the structural factors such as prolonged underinvestment are present, investors should not be too worried about the short-term price volatility in terms of bond investments.
Along with the higher natural gas prices being maintained, the US natural gas companies would be more conservative in the approach towards capital expenditures, as they experienced a seven-year long down cycle (2014 to 2020). Instead, they put debt reduction, dividend payments and repurchases of shares into higher priority. This approach also maintains the structural factor, prolonged underinvestment in conventional energy.
As a result, we could expect their credit profiles to improve significantly over time. Even if there is another down cycle sometime in the future, they would have a higher chance of weathering the downturn.
Operating Condition
The Company has Sufficient Reserves, with Good Cash Flow Performance
As shown in Table 1, Southwestern Energy’s 2022 total production (including natural gas, natural gas condensate and crude oil) is estimated to be 1,523 Bcfe. Around 88% of the production is natural gas. The current average production cost is around $1.9 per Mcfe.
The company generally sells the natural gas at a discount of around $0.8/Mcf to the Henry Hub natural gas spot price. In other words, when looking at the Henry Hub natural gas spot prices, the company's break-even point falls at about $2.7 / Mcf.
Table 1: Southwestern Energy’s Main Operating Indicators
|
2019 |
2020 |
2021 |
2022E |
|
|
|
Yearly Total Production (Bcfe) |
778 |
880 |
1,240 |
1,523 |
|
|
Daily Production (Bcfe / Day) |
2.2 |
2.4 |
3.4 |
4.2 |
|
|
Average Unit Cost of Production ($/Mcfe)* |
1.5 |
1.5 |
1.6 |
1.9 |
|
|
Natural Gas as of Total Production** |
78% |
79% |
80% |
88% |
|
|
Natural Gas Sale Price Discount to the Market ($/Mcf)** |
0.7 |
0.7 |
0.5 |
0.8 |
|
|
Natural Gas Average Sale Price ($/Mcf) (Excluding Hedging)** |
2.0 |
1.3 |
3.3 |
6.2 |
|
|
Natural Gas Average Sale Price ($/Mcf) (Including Hedging)** |
2.2 |
1.7 |
2.3 |
2.8 |
|
|
*Cost includes lease operating expenses, general & administrative expenses, taxes (other than income taxes) and full cost pool amortization **Excluded Natural Gas Liquids (NGLs) Sources: Company’s Reports, iFAST compilation Data as of 30 September 2022 |
|||||
The company's total production has nearly doubled over the past three years through continued acquisitions of peers, including Montage Resources, Indigo Natural Resources and GEP Haynesville. As of the end of 2021, the Company has a reserve production ratio of up to 17 years, which is much higher than the peer average of 11.5 years. The company has sufficient reserves.
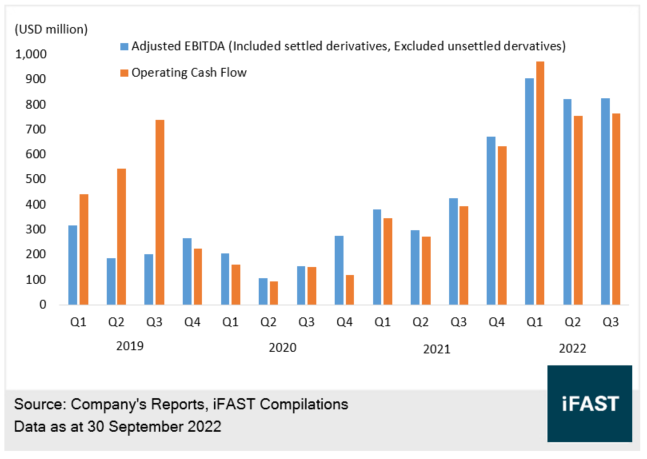
On the profit side (see Chart 3), the company’s adjusted EBITDA was USD 2.55 billion in the first three quarters of 2022, up 130% YoY, benefiting from the surge in natural gas prices and increased production. The operating cash flow also rose 145% YoY to $2.49 billion. The cash flow performance is good.
Chart 3: Southwestern Energy’s EBITDA and Operating Cash Flow
A Large Portion of Natural Gas was Hedged Ahead of Time; Ultimately Still Benefits from High Price Environment
The company's risk management strategy is usually to hedge a large portion (60% to 80%) of its natural gas production ahead of time to lock in cash flow. For example, during 2021, the return to an upward trajectory, the company hedged at an average selling price of around $3 / Mcf in 2021 (when Henry Hub natural gas spot price was around $3 - $5 / Mcf). This ends up with nearly 85% of production hedged in 2022 and around 62% of production hedged in 2023. This hinders the company from fully benefiting from the high price environment.
However, this type of risk management strategy is the industry norm. As shown in Chart 4, only Antero Resources (AR) is close to being unhedged amongst its peers, while the rest hedged half or more of their natural gas production early. After all, natural prices above $3.0 / Mcf are rarely seen between 2017 and 2020.
Chart 4: US Natural Gas Companies’ 2023 Hedged Position
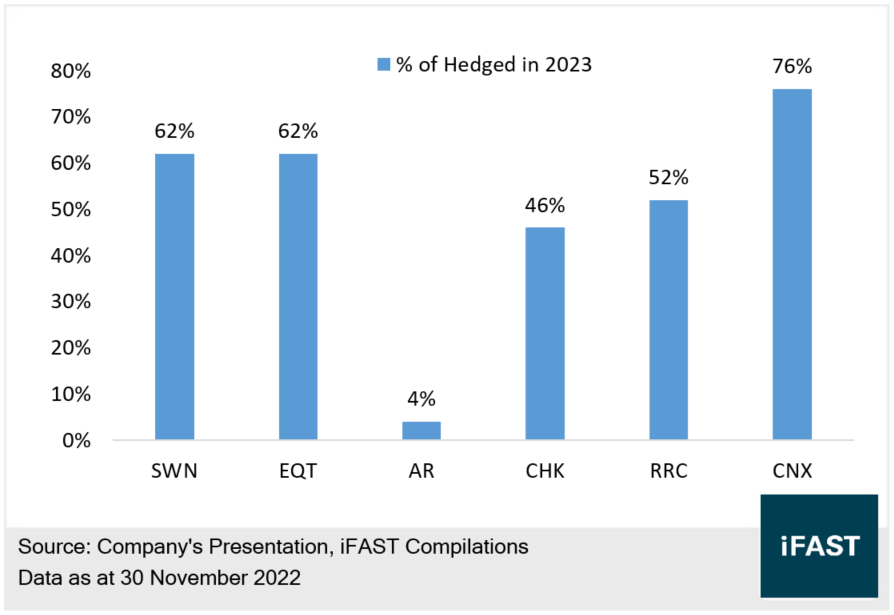
As the high price environment for natural gas continues, these companies will be able to deploy hedging strategies at a higher average price going forward. They would benefit regardless of whether they reduce or increase their hedging positions in the future.
Credit Profile
A Further Improvement in Balance Sheet with Manageable Short- to Medium-term Credit Risk
As shown in Table 2, Southwestern Energy's total debt increased significantly over the past few years, mainly due to the company’s continued acquisitions of peers in the past. However, its total debt already peaked and fell back to USD 4.89 billion. The interest coverage ratio increased significantly, with low leverage level. The net debt to adjusted EBITDA and net debt to free-cash flow are only 1.5x and 4.1x respectively. While the company’s net debt to market capitalisation of 72% is slightly higher than the peers, but it is still at a manageable level.
Table 2: Southwestern Energy's Main Credit Indicators
|
Dec 19 |
Dec 20 |
Dec 21 |
Sep 22 |
|
|
Total Debts (USD billion) |
2.26 |
3.17 |
5.44 |
4.89 |
|
Total Market Capitalisation (USD billion) |
1.31 |
2.00 |
4.73 |
6.65 |
|
Net Debt / Adjusted EBITDA (times) |
2.3x |
4.3x |
3.0x |
1.5x |
|
Net Debt / Free Cash Flow (times) |
376.2x |
-v.e FCF |
9.3x |
4.1x |
|
Net Debt / Market Capitalisation (%) |
172% |
156% |
114% |
72% |
|
Interest Coverage Ratio (times) |
5.6x |
4.1x |
7.6x |
10.8x |
|
Average Cost of Borrowings (%) |
7.7% |
6.7% |
5.4% |
5.9% |
|
Sources: Company’s Reports, iFAST Compilations Data as of 30 September 2022 |
||||
Investors might be worried that these leverage declines is due to a high base effect, which could lead to a spike in leverage ratios if natural gas prices fall. In fact, as mentioned above, the company usually hedges a large position of its natural gas exposure ahead of time. The adjusted EBITDA or free cash flow already takes into account the settled derivatives. The company’s 2022 average hedge price is only about $3/Mcf, which is definitely not a "high base".
The upstream energy companies generally retain very little cash on their balance sheets and use most of their operating cash flows to repay some debts, buyback bonds and shares, pay dividends and put into capital expenditures. In other words, they rely heavily on refinancing for debt repayment. If refinancing does not work out, they might choose to raise capital through a share placement to tackle over short-term liquidity pressures.
Therefore, the company's leverage ratios, interest coverage ratio and cost of borrowings are important indicators, which directly affect the company's success rate in refinancing. The total market capitalization also dominates the size of the company's shares placement or rights issue. With the reference to net debt to market capitalization, we can also understand the efficiency of equity financing for debt repayment.
Currently, the company is performing well. It is in the process of reducing debt with good leverage level. We expect the company's balance sheet to improve further. The short- to medium-term credit risk is quite manageable.
Bond Investment
Investors could Consider the Bond due in 2027, with a Yield To Maturity of 7.0%
The current issuer credit rating of Southwestern Energy is BB+ / BB+ (S&P / Fitch), belonging to the highest grade under the non-investment grade level. The company's credit profile is improving. It has a higher chance of moving up to investment grade in 2023.
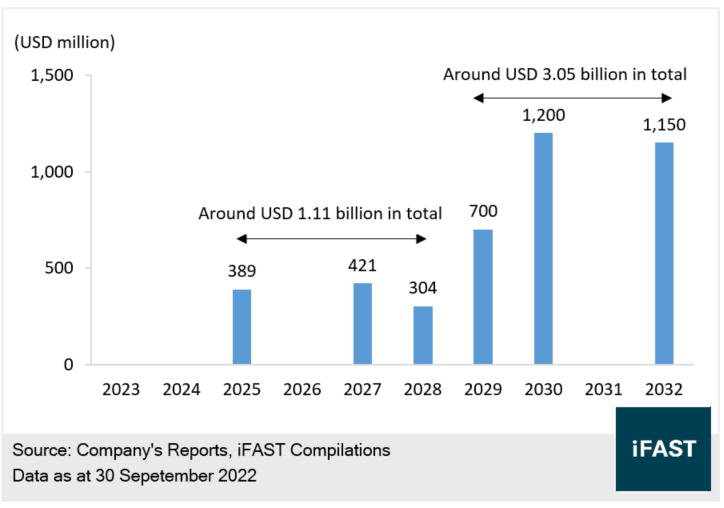
The company's outstanding bonds account for 85% of the total debt. As shown in Chart 5, most of the bonds are concentrated in or after 2029, accounting for 73% of its outstanding bonds. Bonds maturing in or before 2028 amount to about USD 1.11 billion, which is lower than the free cash flow of the past 12 months (around USD 1.2 billion). In other words, the company's free cash flow for one year can fully repay the bonds due in or before 2028. The short- to medium-term debt repayment pressure is low.
Chart 5: Southwestern Energy’s Bond Maturity Profile
Investors might consider this bond due in 2027 (see Table 3), with a yield to maturity of 7.0%. Given its strong cash flow, the company might choose to exercise its redemption option in 2025, with a net yield to call of 6.4%. Investors might consider this bond as a yield pickup option.
Table 3: Southwestern Energy’s 2027 Bond
|
Bond Name |
Years To Maturity |
YTM |
YTC (Year 2025) |
|
4.7 |
7.0% |
6.4% |
|
|
Source: Bondsupermart Data as of 6 January 2023 |
|||
Related Risks
The company's revenues are primarily from the sale of natural gas, which is highly volatile. This might cause its revenues to be volatile as well. At the same time, if the company mistakenly makes significant long-term hedges during periods of low prices, this may result in low cash flows in the long-term.
The company's acquisition of peers may increase its leverage level and debt repayment pressure. In addition, since the company relies more heavily on the issuance of new bonds to repay old bonds, if the US bond market is volatile or interest rates continue to rise, the financing ability and liquidity might be affected.
Conclusion
Western European countries have become more dependent on natural gas imports from the US, and an increase in the imbalance between supply and demand led to a sharp rise in US natural gas prices. We believe that US natural gas prices will stay at a higher level for a longer period of time, benefiting the upstream natural gas companies. Their credit profiles would improve significantly over time.
Southwestern Energy has ample reserves. The company's cash flow performance is good, benefiting from high natural gas prices and past acquisitions of peers. The company hedged a large portion of natural gas ahead of time, but still benefits from the high price environment regardless of whether it reduces or increases the hedge position in the future.
The company has a higher chance of moving towards investment grade this year. The credit risk is manageable in the short- to medium-term. Investors could consider their bond due in 2027, with a net yield to maturity of 6.8%.
Declaration: For specific disclosure, at the time of publication of this report, IFPL (via its connected and associated entities) and the analyst who produced this report hold a NIL position in the abovementioned securities.t holds a NIL position in the abovementioned securities.