Highlights:
Teva is the world’s largest generic drug supplier, considered as the top leader in generic drugs. It currently produces and sells around 550 generic prescription products, with a market share of 8.3% in the US.
- Single-digit growth is expected in the global generic drug market. The company’s margin should be stable. It enjoys the advantage of economies of scale. The Company was accused of being heavily indebted, but it has been actively reducing its debts in recent years. Overall, the credit risk is manageable.
- Investors can consider its bonds maturing in two years. Its bonds due in July 2023 and April 2024 have a yield to maturity of 5.4% and 6.3% respectively, which are a bit attractive.
The pharmaceutical companies generally known to investors mainly produce patent drugs, such as Eli Lilly, Merck, Pfizer and Fosun Pharmaceutical. In addition to these companies, there are still some generic companies in the market that produce other companies' brands. After a drug’s patent expires (usually after 20 years), other pharmaceutical companies can replicate the same drug by referring to its drug ingredients, which is called a "generic drug".
Generic drugs have been on the rise for the past 30 years, and their strategy with “high turnover and low profit margin” is successful in penetrating different markets around the world. This allows patients to purchase the drugs at lower prices. Next, we will introduce the credit profile of Teva Pharmaceutical, the world's largest generic drug company from Israel, and its bonds, which should be of interest to investors.
The Top Leader in Generic Drugs, with a Market Share of 8.3% in the US
Teva Pharmaceutical Industries ("Teva") is the world’s largest generic drug supplier. Its sales are far away from the second ranked company, Sandoz from Switzerland (see Table 1). It is considered as the top leader in generic drugs. The company is currently listed on the Tel Aviv Stock Exchange and NYSE (Stock code: TEVA.IS/TEVA.US) with a market capitalisation of around USD 9.79 billion (same currency below).
Table 1: Sales Ranking of Top 10 Generic Pharmaceutical Companies in the World
|
Rank |
Company Name |
Country |
Generic Drug Sales in 2021 (USD billion) |
Generic Drug Sales in 2020 (USD billion) |
YoY Change |
|
1 |
Teva Pharmaceutical |
Israel |
89.9 |
93.1 |
-3% |
|
2 |
Novartis' Sandoz |
Switzerland |
75.0 |
77.0 |
-3% |
|
3 |
Viatris |
US |
56.3 |
52.9 |
+6% |
|
4 |
Sun Pharma |
India |
46.4 |
45.2 |
+3% |
|
5 |
Fresenius Kabi |
Germany |
37.2 |
35.8 |
+4% |
|
6 |
Aurobindo |
India |
31.8 |
29.7 |
+7% |
|
7 |
Cipla |
India |
26.5 |
24.7 |
+7% |
|
8 |
Aspen Pharmacare |
South Africa |
22.0 |
19.6 |
+12% |
|
9 |
Dr. Reddy’s Laboratories |
India |
21.7 |
19.2 |
+12% |
|
10 |
Hikma |
UK |
18.8 |
17.3 |
+9% |
|
Source: Fierce Pharma, IFAST compilations Data as of 31 December 2021 |
|||||
Teva currently produces and sells around 550 generic prescription products and has more than 1,100 generic products in the pre-approved pipeline. According to IQVIA data, in 2021, Teva provided over 300 million total generic prescriptions in the U.S, representing 8.3% of total U.S generic prescriptions. The generic drug supplies and sales account for around 60% of its total revenues.
Besides generic drugs, Teva still has a small businesses about specialty drugs and over-the-counter drugs. In addition to these segments, Teva engages in the sale of active pharmaceutical ingredients to third parties and provides contract manufacturing services.
Single-digit Growth Expected in the Generic Drug Market; Stable Company Margin
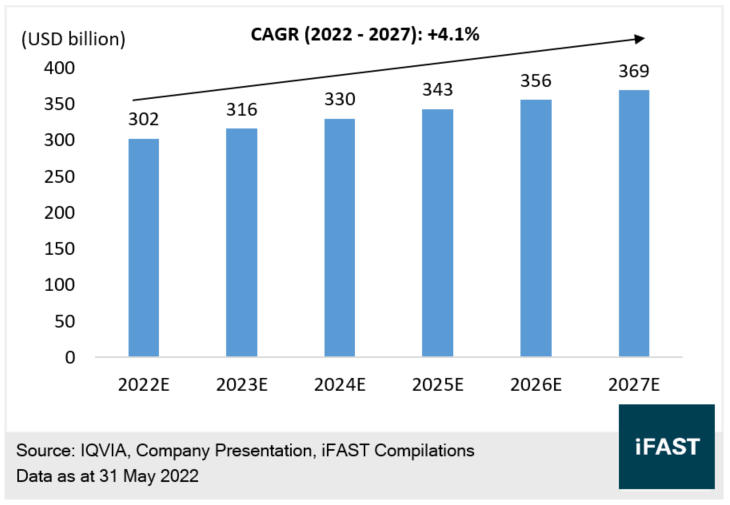
As shown in Chart 1, global generic drug sales are expected to reach $369 billion in 2027, with a compound annual growth rate (CAGR) of 4.1% between 2022 and 2027. There is still some room for growth in the industry.
Chart 1: Global Generic Drug Sales (Forecast)
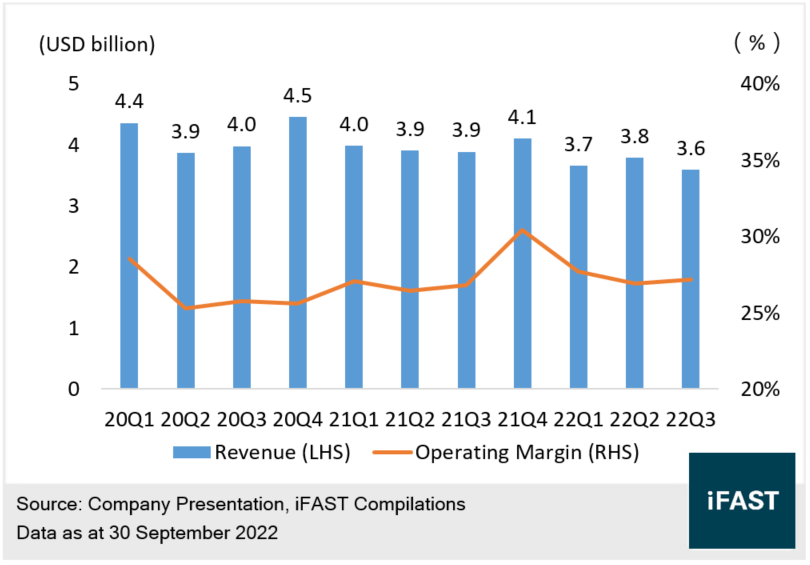
On the operational side, as shown in Chart 2, Teva's revenue showed a few signs of deterioration, with only $11 billion in the first three quarters of the year, down 6.2% YoY. This is mainly due to the more competitive generic drug market and the US government's continued encouragement to replace patented drugs with generics. The US government allowed more generic drugs to enter the market, resulting in weaker pricing power for these generic drugs.
However, due to the company's strong cost control and the ongoing introduction of new products, its operating margins have remained generally stable in the 25% to 30% range, even in the face of intense price competition. We expect its operating margins to remain in this range for some time to come and will not deteriorate significantly even if more peers enter the competition.
Chart 2: Teva’s Quarterly Revenue and Operating Margin
It is noted that the operating margin of normal generic companies is only 15% or below, which is much lower than the 25% to 35% level of patent drug companies. This is mainly due to the lack of pricing power and uniqueness of most generic drugs and the fierce competition. However, as the world's largest generic drug company, Teva enjoys the advantage of economies of scale and is able to produce, sell and research and develop at lower costs and with more mature technology. As a result, its operating margins are much better than those of its peers.
The Company Was Accused of Being Heavily Indebted, but Actively Reduced its Debts in Recent Years
In 2016, Teva acquired its peer Allergan for $40.5 billion, leading to its net debt to rise sharply from $3 billion at the end of 2015 to around $30 billion. After the acquisition, the company was accused of being heavily indebted and even the CEO, Erez Vigodman, who led the acquisition at the time, was dismissed from his position. The company's credit rating was downgraded from investment grade to non-investment grade level.
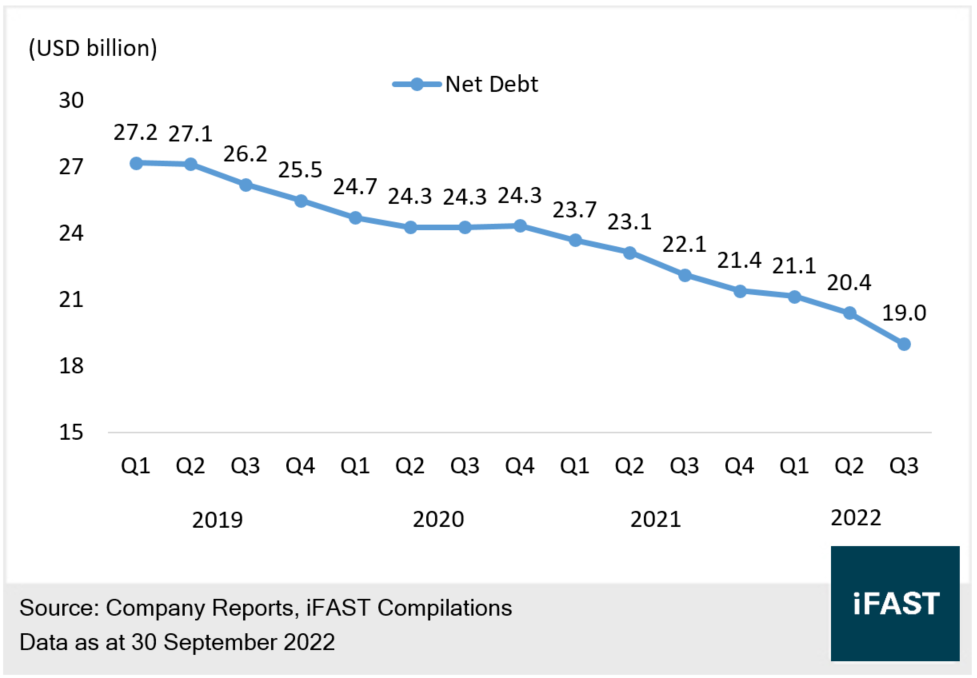
However, Teva has been actively reducing its debt in recent years. As shown in Chart 3, the company's net debt is gradually declining to $19 billion at the end of September 2022, down about 30% from the beginning of 2019, which is at good pace of debt reduction. The company would continue to seek debt reduction as their goal, which could improve its credit quality and benefit the bond investors.
Chart 3: Teva’s Net Debt in Recent Years
As of end-September 2022, the company’s
total debt to total capital fell slightly to 69% (Table), representing a stable
leverage level. Its current ratio and cash to short term debt ratio have
deteriorated slightly, mainly owing to an increase in its short term debt.
However, the company should be able to refinance a larger portion of its
short-term debt and convert it to long-term debt, so its liquidity pressure is
not significant.
On the other hand, the company’s cost of borrowing was low at 4.1% and the interest coverage ratio was 4.4 times. Both of them remain stable and represent sufficient room for the company to have new financing. Overall, the credit risk is manageable.
Table 2: Teva’s Credit Metrics
|
December 2021 |
June 2022 |
September 2022 |
|
|
Total Debt / Total Capital (%) |
70% |
71% |
69% |
|
Current Ratio (times) |
1.14 |
1.11 |
0.99 |
|
Cash to Short-term Debt (times) |
1.41 |
1.2 |
0.8 |
|
Cost of Borrowing (%) |
4.0% |
4.0% |
4.1% |
|
Interest Coverage Ratio (Trailing twelve months) (times) |
4.2 |
4.5 |
4.4 |
|
Source: Company Reports, IFAST compilations Data as of 30 September 2022 |
|||
Investors can Consider its Bonds Maturing in Two Years, with Net Yield to Maturity above 5.4%
Currently, Teva’s issuer credit rating is BB- (S&P / Fitch), and its bonds have the same rating, belonging to non-investment grade level.
Given the stable business model, higher-than-peers profit margin and active reduction in its debt in recent years, we believe that the company's short- to medium-term bond credit risk is low. Investors can consider its bonds maturing in two years (Table 3). Its bonds due in July 2023 and April 2024 have a yield to maturity of 5.4% and 6.3% respectively, which are a bit attractive.
Table 3: Teva’s Partial USD Bonds
|
Bond Name |
Bond Guarantor |
Years To Maturity |
Yield To Maturity (%) |
|
Teva Pharmaceutical Industries |
0.7 |
5.4% |
|
|
Teva Pharmaceutical Industries |
1.4 |
6.3% |
|
|
Source: Bondsupermart Data as of 11 November 2022 |
|||
Related Risks
The price competition in the generic drug market is intense. Its competitors may lower prices to take market share, resulting in more pressure on the company's profit margin. Moreover, some governments around the world more or less are approving more generic drug companies to produce generic drugs, which might be similar to the company's drugs. This might lead to lower prices of generic drugs.
In addition, the company's customers are concentrated on large retail drug chains, wholesalers and medical institutions. If these institutions no longer choose the company's drugs, or if they put pressure on the company to lower the prices, the company's revenue will be adversely affected.
The company's leverage is not decent and most of its debt bears interest at a fixed rate. In a rate hike cycle, the company might need to refinance at a higher rate. So the interest expense might rise gradually, which could affect its solvency.
Conclusion
Teva is the world’s largest generic drug supplier, considered as the top leader in generic drugs. It currently produces and sells around 550 generic prescription products, with a market share of 8.3% in the US.
Single-digit growth is expected in the global generic drug market. Teva’s margin should be stable. It enjoys the advantage of economies of scale. Though it was accused of being heavily indebted, it has been actively reducing its debts in the recent years. Overall, the credit risk is manageable.
Investors can consider its bonds maturing in two years. Its bonds due in July 2023 and April 2024 have a yield to maturity of 5.4% and 6.3% respectively, which are a bit attractive.
Declaration: For specific disclosure, at the time of publication of this report, IFPL (via its connected and associated entities) and the analyst who produced this report holds a NIL position in the abovementioned securities.