


Table 1: Bond Information
|
|
HYUELE 6.250% 17Jan2026 Corp (USD) |
VTLE 9.500% 15Jan2025 Corp (USD) |
|
Issuer |
SK Hynix |
Vital Energy |
|
Currency |
USD |
USD |
|
Years to Maturity |
2.3 |
1.9 |
|
Issuer Credit Rating (S&P) |
BBB- |
B |
|
Indicative Ask Price (Investor Buys) |
100.4 |
101.5 |
|
Yield to Maturity (Bond Express) |
6.2% |
8.7% |
|
Source: Bondsupermart Data as of 24 February 2023 |
||
SK Hynix
Introduction
SK Hynix (abbreviated as Hynix hereafter) is a Korea-based semiconductor company producing memory chips which are mainly divided into memory (SDRAM) and storage chips (NAND Flashing Memory). The company is the fourth-largest semiconductor company in the world in terms of total sales volume, trailing behind Samsung Electronics, Intel, and TSMC.
Hynix has been listed on the Korea Exchange since 1996 (stock code: 660.KS). Its current market capitalisation is close to KWR 67.0 trillion.
Operating and Credit Conditions
Owing to the rapid development of 5G devices, AI, as well as the Internet of Things (IoT), the demand for memory has witnessed exponential growth—Hynix’s revenue in 2021 rose by approximately 35% to KRW 43.0 trillion and its operating income reached KRW 12.4 trillion with the operating income margin of 28.8%.
On the other hand, the semiconductor industry, a typical cyclical sector, started to enter the down cycle in the second half of last year after a long boom period of about three years. The price of DDR4 memory with 4GB capacity has dropped by more than 17% to USD 29.1 from USD 35.4 in the second quarter of last year, while the price of NAND SSD with 256GB capacity has also dropped by nearly 30% last year.
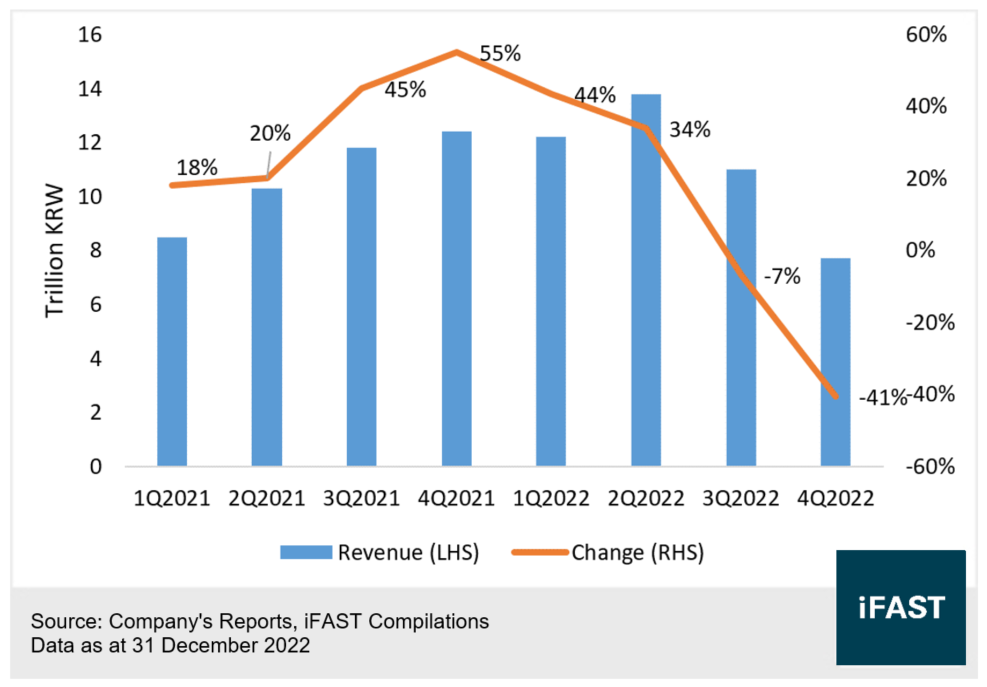
As such, Hynix's results are seeing a remarkable shrinkage (Chart 1), with its revenue slumping by 7% and 41% YoY respectively in the third and fourth quarters of 2022. Particularly, the company hit a record high of KRW 1.7 trillion on net loss for 4Q2022. Given that the down cycle is expected to persist in the coming one to two years, Hynix is facing a significant downside risk.
Chart 1: Hynix’s Revenue and YoY Change
In the long term, research from IC Insights illustrates that the global memory market is expected to grow at a CAGR of approximately 10% by 2030.
It is worth mentioning that ChatGPT, an artificial intelligence chatbot, is incredibly popular recently. Shortly after its rise in popularity, we saw a number of big techs announce that they would launch similar products soon. Such AI service requires faster processing power, driving a surge in the demand for high bandwidth memory (HBM). Hynix jointly developed the world's first HBM in 2013 with AMD and has a dominant position in this field. We believe that the current buzz for AI technology will likely propel the company’s development, and Hynix could be able to remain a stable growth after coming out of the down cycle.
As of the end of 2022, Hynix owned KRW 6.4 trillion worth of cash and cash equivalents. Its short-term and long-term debt is KRW 7.4 trillion and KRW 15.6 trillion respectively. It suggests that the company's cash to short-term debt ratio was 0.9x, and the liquidity weakened in comparison with that of 2021.
On the other hand, the company proposes to reduce about 50% of capital expenditure in 2023 in response to the deterioration of industry fundamentals, somewhat improving the company's liquidity. Furthermore, considering the fact that the company has ample room for an upside potential, with a relatively large asset base, the fundraising capability of Hynix is superior. To wrap up the points above, we believe that the liquidity of Hynix will be at a healthy level.
Looking into other credit metrics (Table 2), as of the end of 2022, the net gearing ratio marked a significant increase to 26.0% from 12.1% in 2021, but was still below the industry average, reflecting low leverage and pressure for debt repayment.
Table 2: Hynix’s Credit Metrics
|
Dec 20 |
Dec 21 |
Dec 22 |
|
|
Cash and Cash Equivalents (KRW trillion) |
3.0 |
5.1 |
6.4 |
|
Short-term Debt (KRW trillion) |
3.1 |
2.9 |
7.4 |
|
Long-term Debt (KRW trillion) |
8.1 |
14.7 |
15.6 |
|
Total Debt (KRW trillion) |
11.2 |
17.6 |
23.0 |
|
Cash to Short-term Debt Ratio (times) |
1.0x |
1.8x |
0.9x |
|
Net Gearing Ratio (%) |
14.4% |
12.1% |
26.0% |
|
Total Debt/EBITDA (times) |
2.6x |
1.5x |
1.1x |
|
Sources: Company’s Reports, iFAST Compilations Data as of 31 December 2022 |
|||
Bond Investment
The issuer and bond credit ratings for Hynix are BBB- from S&P, thus its bonds are considered investment grade. The deterioration of industry fundamentals results in an increased yield spread, and the bond due in 2026 is currently yielding at 6.2%, higher than most Asian investment-grade peers.
Based on its rather good credit metrics, we believe that its default risk remains manageable for its short- and mid-term bonds. Therefore, we have introduced HYUELE 6.250% 17Jan2026 Corp (USD) to Bond Express. Investors can buy this investment-grade bond at a lower cost.
Related Risk
The market anticipates that the industry down cycle will continue in the coming one to two years, but there are some uncertainties about the duration of the industry down cycle. If the down cycle lasts longer than expected, it would adversely affect the cash balance and credit profile.
Vital Energy
Introduction
Vital Energy is a small US oil and gas company with oil fields located in the Permian-Midland Basin and annual production of around 27 million barrel of oil equivalent.
The company is listed on New York Stock Exchange (Stock Code: VTLE.US), with a current market capitalisation of around USD 920 million (same currency below). This company has been discussed in the previous article.
Operating and Credit Conditions
The company's adjusted EBITDA and free cash flow for the first nine months of 2022 were $720 million and $180 million respectively, with a free cash flow exceeding $100 million or more for the first time in years.
Since the new CEO’s arrival in 2019, it is clear that the free cash flows, which had been negative for a long time in the past (2015-2018), gradually improved to a rough balance between operating cash flow and capital expenditures. The company started generating a decent cash flow last year under the environment of high oil prices. The company's reinvestment rate (capital expenditure / operating cash flow) is showing a downward trend, from 147% in 2017 to 71% in the first nine months of 2022. The operating performances gradually improved.
The company hedged 50% to 70% of its production ahead of time in the past. Yet the management indicated that they would reduce the hedging exposures in the future, in line with debt reduction. The hedging position might be reduced to around 32% in 2023 to take advantage of the high oil price environment. If the high oil price environment continues, this could significantly boost the company's profit and cash flow performance.
As shown in Table 3, the company’s total debt was $1.18 billion at the end of September 2022, a decrease of 18% from the end of 2021. The company's net debt / adjusted EBITDA and net debt / free cash flow were 1.4x and 5.9x, respectively. The leverage continues to improve.
Table 3: Vital Energy’s
Credit Metrics
|
Dec 21 |
Sep 22 |
|
|
Net Debts (USD million) |
1,430 |
1,150 |
|
Undrawn Credit Facility (USD million) |
580 |
960 |
|
Net Debt / Adjusted EBITDA (times) |
3.0x |
1.4x |
|
Net Debt / Free Cash Flow (times) |
-v.e FCF |
5.9x |
|
Net Debt / Market Capitalisation (%) |
146% |
115% |
|
Interest Coverage Ratio (times) |
4.5x |
7.1x |
|
Average Cost of Borrowings (%) |
8.6% |
9.8% |
|
Sources: Company’s Reports, iFAST compilations Data as at 30 September 2022 |
||
Along with the persistence of the high oil price environment (i.e. WTI oil price greater than $70 per barrel) and the company's intention to reduce the debt level and hedging position, we expect the company's balance sheet to improve significantly in the coming period. The company could accelerate its debt reduction pace.
Overall, while the company's credit indicators are not as decent as those of its peers, the company's short- to medium-term credit risk still remains manageable.
Bond Investment
Vital Energy’s issuer credit rating is B (S&P) and bond credit rating is B+ (S&P), both of which are non-investment grade.
Referring to its debt maturity profile, the next maturity is in January 2025, with a principal amount of around $460 million. The company has two years to prepare for repayment, including taking advantage of the free cash flow generated during the two-year period (estimated to be around $300-500 million in total), as well as issuing new bonds and placing shares to replenish the funds.
Investors looking for a high yield choice could consider the VTLE 9.500% 15Jan2025 Corp (USD), which carries a net yield to maturity of 8.7%. The bond is now available on Bond Express.
Related Risk
The company's revenues are primarily from the sale of crude oil and natural gas, which are highly volatile. This could cause its revenues to be volatile as well.
The company hedged heavily in the past when oil prices were low, resulting in low cash flows. In the future, the company may misjudge oil price trends again, implying a higher execution risk. As a result, the company's profit and cash flows might be weaker than its peers.
Declaration: For specific disclosure, at the time of publication of this report, IFPL (via its connected and associated entities) holds positions in HYUELE 6.250% 17Jan2026 Corp (USD) and VTLE 9.500% 15Jan2025 Corp (USD) and the analyst who produced this report holds a NIL position in the abovementioned securities.









