Trump Opens the Pandora's Box, Playing by Unconventional Rules
Recently, the global financial markets have experienced significant turbulence due to a new round of tariff wars initiated by the U.S. As the market anticipates a scenario of stagflation or recession in the U.S., combined with Trump’s "reciprocal tariffs" applied globally at rates far exceeding the 15% worst-case scenario envisioned by many analyses, policy uncertainty has surged dramatically. This explains why nearly all markets and risky assets have been caught up in the recent wave of sell-offs, without exceptions.
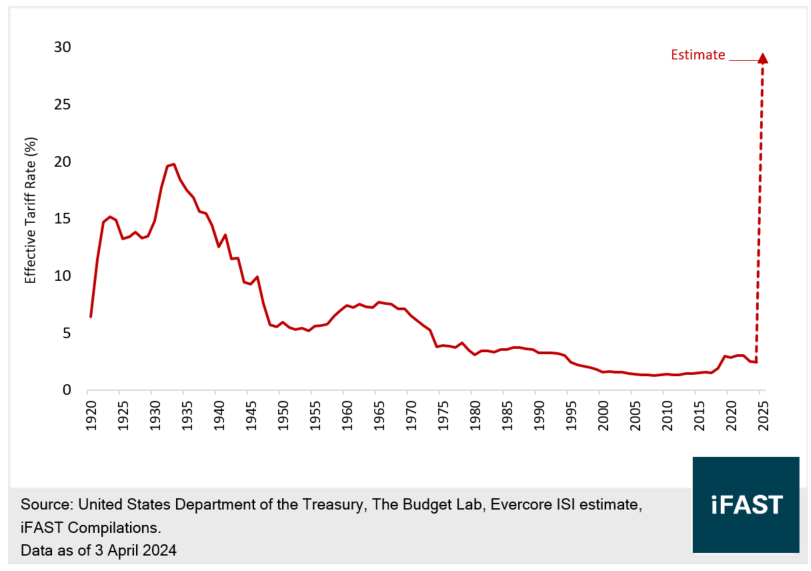
According to data from Evercore ISI, the U.S. weighted average tariff rate is expected to rise to 29% (see Chart 1), a sharp increase from last year’s roughly 2%, comparable to the levels seen during the Great Depression (1930-1935)—the highest in the 20th century.
Chart 1: U.S. Tariff Rates Reach the Highest Level since the 20th Century
What is even more concerning is that this deviates from the earlier market consensus of a uniform 10% tariff on all countries. The White House’s calculation of "tariffs charged by other countries on the U.S." is simply derived by dividing a country’s trade deficit with the U.S. by its total exports to the U.S., and "reciprocal tariffs" are computed by halving that figure. This bears no actual relation to the tariffs other countries impose on U.S. imports.
This is akin to opening Pandora’s box, reflecting how Trump and his policies defy conventional logic, making it more challenging to analyse the U.S. fiscal policy far and triggering a cascade of ripple effects. This includes potential retaliatory measures from China, the European Union and Canada (see Table 1).
Table 1: Major Countries’ Current Stances on Tariffs
|
Country/Region |
Stance |
Details |
|
China |
Retaliation |
China imposed 34% tariffs on imports originating from the U.S., while later China increased it to 84%. |
|
EU |
Ambiguous (Retaliation & Negotiation in Parallel) |
Plans retaliatory tariffs on certain U.S. goods while proposing a "zero-for-zero" tariff deal with the U.S. |
|
Canada |
Retaliation |
Imposes 25% tariffs on certain U.S. imports |
|
Japan, South Korea, Australia, New Zealand, UK, Singapore, Israel, India, Indonesia, Thailand, Vietnam, Malaysia, Taiwan, Sweden, Norway |
Moderate |
No retaliatory measures; some countries may negotiate to lower tariffs |
|
Source: Different Internet Resources, iFAST Compilations Data as of 9 April 2025 |
||
Besides, last weekend, the White House released the latest tariff revision, ANNEX III (details here), introducing a key provision, "9903.01.34", which is ambiguously worded and open to two interpretations:
- If a goods contains 20% U.S. components, the entire goods could be exempt from tariffs.
- If a goods contains 20% U.S. components, only that portion could be exempt from tariffs.
These two interpretations have vastly different implications for international trade markets. The first suggests exporters could gain tariff exemptions by incorporating more U.S. components into their final products, while the latter renders effective tax avoidance nearly impossible. The market remains divided on this issue and clarity may only emerge after the tariffs take effect and are observed over time.
What Can We Learn from the Great Depression?
Looking back on 1930, during the Herbert Hoover administration, in an effort to protect domestic industries, tariffs were sharply imposed. Following the enactment of the Smoot-Hawley Tariff Act, global retaliatory tariffs sparked a worldwide trade war. Between 1930 and 1933, global trade volumes plummeted by 60% to 70%, exacerbating the Great Depression. U.S. industrial production and real GDP fell by 47% and 30%, respectively, while prices dropped by 30%. This policy is widely regarded as a textbook example of disastrous economic policy in the U.S. history.
This indirectly suggests that aggressive tariffs could reduce trade volumes, harm economic growth and provoke retaliation from other nations, amplifying the policy’s negative effects.
However, it is worth noting that the global economic environment and international order of the 1930s bear little resemblance to today, so the Hoover-era tariff policy may not offer much direct relevance.
Instead, it serves as a reminder: every two years, the U.S. holds presidential or midterm elections. Hoover’s economic policy failures led to his defeat by Roosevelt in the 1932 presidential election. Even if a U.S. president implements exceptionally bad policies, the public can seek to reverse them within about two years through elections.
Tariff Wars Bring Tremendous Uncertainty
Undeniably, the new tariffs introduce immense uncertainty. If the U.S. persists with its hardline stance and nativism, it could signal the end of the era of globalization and free trade. Globalization and free trade have been key drivers of past economic prosperity and a major factor in keeping goods inflation low. As shown in Chart 2, the low inflation in the past was largely supported by near-zero goods inflation.
Chart 2: U.S. Goods Inflation, Services Inflation and Overall Inflation
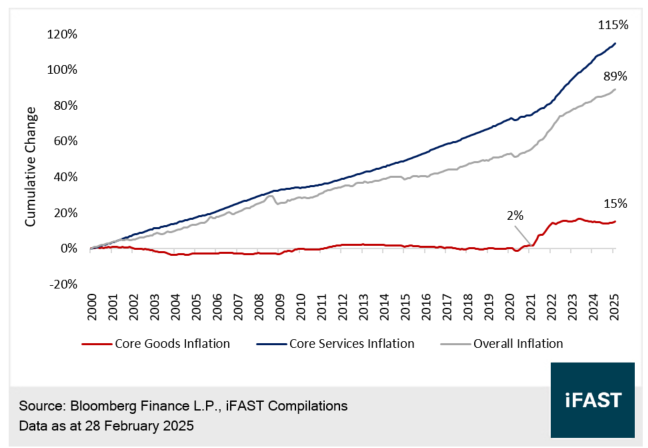
If this trend reverses and deglobalization accelerates, we believe it will lead to rising supply-side costs, potentially causing higher and more persistent inflation. The growth outlook for the U.S. and global would deteriorate significantly, increasing the likelihood of a stagflation scenario (negative or near-negative growth with high inflation).
This extends to a series of uncertainties:
- Will Trump implement significant domestic tax cuts (e.g., income tax, corporate tax) to offset some of the negative impacts of tariffs?
- Will industries currently exempt from tariffs (e.g., gold bars, copper, pharmaceuticals, semiconductors and timber products) be included in future tariff policies?
- How will the key provision "9903.01.34" ultimately be interpreted?
- Can the additional revenue from tariffs effectively alleviate the U.S. fiscal deficit?
- Given the unexpected tariff policies, will the Fed cut rates earlier, ignoring the risk of resurgence of inflation?
- Will mainstream countries lean toward negotiation or retaliation in response to U.S. tariffs? Will the U.S. negotiate with them to mitigate tariff impacts?
These uncertainties lack definitive answers at this stage, yet each outcome will significantly influence the macroeconomic environment (e.g., economic growth, inflation, interest rates, and bond yields) and in turn corporate fundamentals.
Now Is Not the Time to Buy Long-Term Bonds
The market currently views a recession as the base case, expecting the Federal Reserve to cut rates four more times this year (in May, June, September, October, or December) by 25 basis points each, bringing the benchmark rate to a range of 3.25% - 3.5% by year-end (see Chart 3).
Chart 3: U.S. Benchmark Interest Rates and Market Expectations
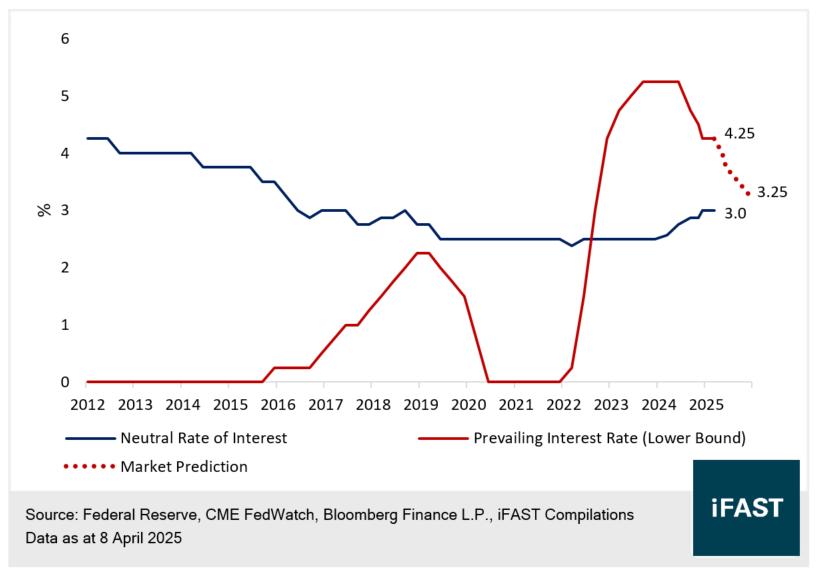
However, we have to emphasize that the Fed’s mandate is to balance the labour market and inflation control. If the tariff war ultimately results in stagflation (negative or near-negative growth with high inflation), the Fed’s rate cuts will be constrained. It may not deliver the four cuts anticipated by the market this year and could even enter a chaotic "cut-then-hike" cycle.
If market expectations falter and stagflation is confirmed, the long-term bond yields could face significant rebound risks. Therefore, we believe now is not the time to buy long-term U.S. treasuries.
The Only Certainty - More Investment Opportunities Emerge
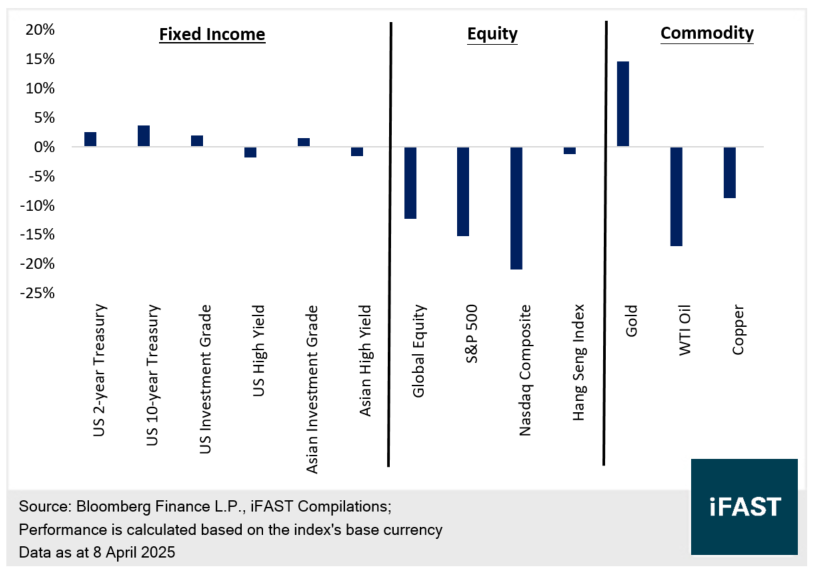
The abundance of uncertainty explains the heightened volatility in capital markets. Most asset classes (including corporate bonds) have recorded different degrees of declines, while U.S. treasuries, investment grade bonds (including coupon returns) and gold have posted positive year-to-date returns (see Chart 4).
Chart 4: YTD performance of Different Asset Classes
The one certainty is that the drop in asset prices has created more investment opportunities (some with significant potential risks). Valuations in certain asset classes or markets, such as corporate bonds, have become more attractive. Ultra-short-term U.S. treasuries, meanwhile, can serve as a defensive tool and a potential liquidity source for future investments in other markets.
Ultra Short-term U.S. Treasuries
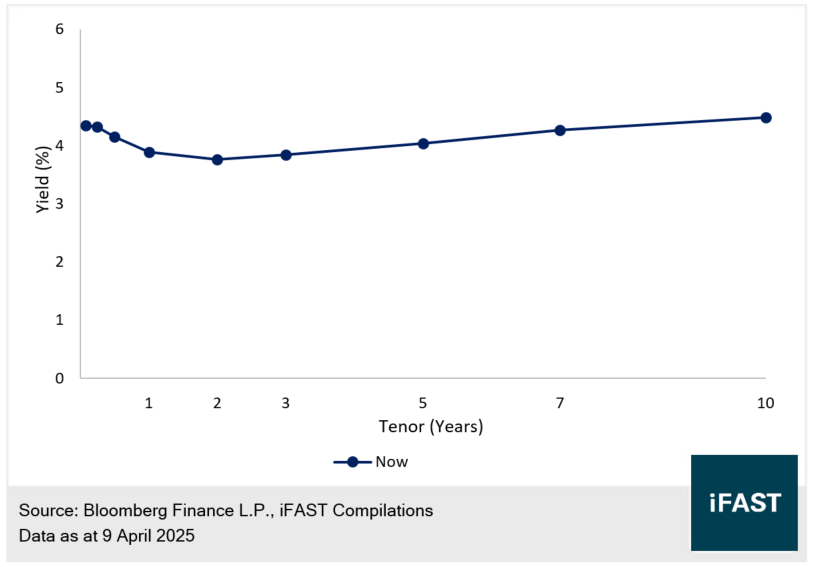
The front end of the yield curve remains inverted (see Chart 5), meaning ultra short-term U.S. Treasuries (with tenor less than one year) offer attractive yields above 4%.
This front end of the yield curve inversion stems from market expectations of two rate cuts within six months. However, as we emphasized, market expectations and the Fed’s actual actions are distinct. The Fed’s rate cuts could fall short of expectations if inflation rebounds, meaning ultra short-term treasuries do not necessarily carry high reinvestment risk. A 6-month treasury yielding around 4% offers both attractive returns and significant defensiveness for investors’ portfolios.
Chart 5: US Yield Curve
Corporate Bonds
Corporate bonds offer highly predictable returns (assuming timely repayment, the yield will be equal to the annualized return for investors who hold the bond to maturity). In the current sell-off environment, they present greater investment value, potentially locking in higher returns. On the credit front, even if corporate earnings outlooks weaken due to the tariff war, as long as the deterioration is not severe enough to cause deep losses, with continuing refinancing, the impact on debt repayment should be limited.
However, it is worth noting that as the global economy is likely to slip into a recession, the credit spreads of corporate bonds may widen further. The longer-term corporate bonds are more susceptible to being sold off for this reason, as they face a greater risk of credit spread widening and typically experience larger price declines. Therefore, we believe investors should first consider short- to medium-term corporate bonds (unless the credit spreads of certain longer-term bonds of individual companies have already fully priced in this risk).
We believe certain defensive corporate bonds deserve investors’ attention, particularly two types: (1) defensive corporate bonds and (2) banks and insurance companies.
(1) Defensive Corporate Bonds
- Non-US issuers that operate locally and are not dependent on global supply chains should be less impacted by the recent escalation in the trade war.
- Their operations, revenues and profit margins are likely to be less vulnerable to shocks from the reorganisation of the trade system and shifts in the global economic order, likely resulting in relatively stable credit profiles.
- These defensive corporate bonds should face lower risks of credit spread widening compared to others (Table 2 – our selected bonds).
Table 2: Our Selected Defensive Corporate Bonds
|
Country / Region |
Issuer / Guarantor |
Bond Name |
YTM |
|
Mainland China |
Meituan |
MEITUA 3.050% 28Oct2030 Corp (USD) |
5.3% |
|
Hong Kong |
CTF Services |
NWSZF 6.375% 22Aug2028 Corp (USD) |
8.9% |
|
Korea |
Mirae Asset Securities |
DAESEC 5.875% 26Jan2027 Corp (USD) |
5.2% |
|
India |
Muthoot Finance |
MUTHIN 7.125% 14Feb2028 Corp (USD) |
8.4% |
|
Japan |
Rakuten Group |
RAKUTN 11.250% 15Feb2027 Corp (USD) |
9.1% |
|
UK |
Just Group |
JUSTLN 8.125% 26Oct2029 Corp (GBP) |
6.1% |
|
Source: Bondsupermart Data as of 8 April 2025 |
|||
(2) Banks and Insurance Companies
- While banks and insurance companies could face some profit pressure from potentially aggressive rate cuts, this merely implies earn lesser rather than incurring losses.
- As service-oriented industries, they are less directly impacted by the tariffs.
- According to default rate statistics from S&P (see Table 3), the financial sector’s average default rate is far lower than other industries (even during recessions and financial crises), underscoring its defensiveness.
- Financial sector bond credit spreads have widened recently (see Chart 6), offering a higher investment value (Table 4 – our selected bonds). Investors could first consider FWD’s 2029 bond, which has been notably affected by the sell-off.
- However, investors have to be careful of loss absorption features embedded into most of financial corporate bonds, with possible lower seniority. Investors should understand these features and risks before purchasing.
Table 3: Default Rates for Financials vs. Non-Financials
|
|
2024 Default Rate |
Average Annual Default Rate (1981–2024) |
|
Financial Institutions |
0.53% |
0.62% |
|
Insurance |
0% |
0.43% |
|
All Financials |
0.33% |
0.52% |
|
Non-financials |
2.61% |
1.87% |
|
Source: S&P, iFAST Compilations Data as of 31 December 2024 |
||
Chart 6: Credit Spread of Financial Sector and CoCo Bonds
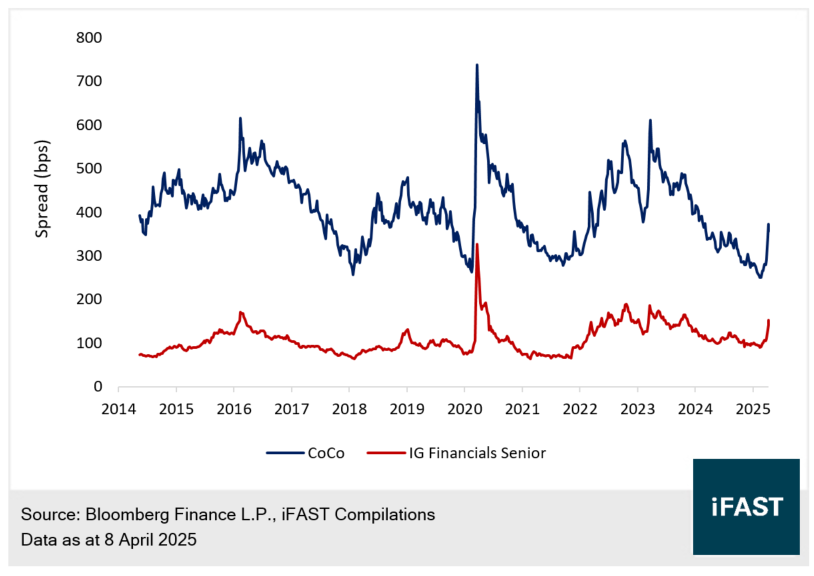
Table 4: Selected Bonds – Banks and Insurance Companies
|
Issuer / Guarantor |
Bond Name |
YTM |
Net Yield to Call |
Seniority |
|
FWD Group |
FWDGHD 8.400% 05Apr2029 Corp (USD) |
8.9% |
/ |
Subordinated |
|
The Bank of East Asia |
BNKEA 6.750% 27Jun2034 Corp (USD) |
6.7% |
6.3% (June 2029) |
Tier 2 |
|
Standard Chartered PLC |
STANLN 7.767% 16Nov2028 Corp (USD) |
5.7% |
/ |
Senior Unsecured |
|
STANLN 7.875% Perpetual Corp (USD) |
7.9% (Current Yield) |
7.9% (September 2030) |
Additional Tier 1 |
|
|
HSBC |
HSBC 8.113% 03Nov2033 Corp (USD) |
6.6% |
6.3% (November 2032) |
Tier 2 |
|
HSBC 8.000% Perpetual Corp (USD) |
7.7% (Current Yield) |
6.7% (March 2028) |
Additional Tier 1 |
|
|
Source: Bondsupermart Data as of 8 April 2025 |
|
|||
Declaration: For specific disclosure, at the time of publication of this report, IFPL (via its connected and associated entities) holds positions in FWDGHD 8.400% 05Apr2029 Corp (USD), MUTHIN 7.125% 14Feb2028 Corp (USD), MEITUA 2.125% 28Oct2025 Corp (USD), RAKUTN 11.250% 15Feb2027 Corp (USD), HSBC 4.375% 23Nov2026 Corp (USD), HSBC 5.546% 04Mar2030 Corp (USD), STANLN 4.300% 19Feb2027 Corp (USD), HSBC 5.300% 14Mar2033 Corp (SGD) and JUSTLN 8.125% 26Oct2029 Corp (GBP) and the analyst who produced this report holds a NIL position in the abovementioned securities.
Our podcast series, Yield Hunters, is available on Spotify, iTunes Podcasts and Google Podcasts. We share our thoughts on new bond issues and hold discussions on the fixed income space. Listen to our latest episode below and follow us!