Just a year ago, investors saw one of the wildest sell-offs in the history of financial markets. Although wealth was lost (and regained), the events spawned a new class of investors. Armed with a motto of “buy the dip”, these investors search for profits using derivatives to multiply gains (and sometimes, losses).
Brokerages
and banks that offer such products and services gained from much higher trading
volume and Julius Baer Group Ltd. (“Julius Baer”) is no exception. Its net
profit increased by 50.2% YoY to CHF 698.6m for the financial year ended 31 Dec
20 (“FY20”).
The bank’s operating income increased by 5.9% YoY to CHF 3.58b with net income from financial instruments contributing the most to the gain, increasing by 52.6% YoY to CHF 943.5m. Its strong performance was driven by high market volatility, which spurred client activity in currencies, derivatives and precious metals trading, and higher income from structured products. The increase in securities underwriting activities also contributed to a 4.8% YoY growth in net commission/fee income, totalling CHF 2015.0m in FY20.
However, net interest income decreased strongly by 21.5% YoY to CHF 622m, mainly due to a decrease in US interest rates, which led to a lower interest income in Julius Baer’s treasury portfolio. On the other hand, net interest income did not constitute a large portion of their operating income, as it made up 23.4% and 17.4% of operating income in FY19 and FY20 respectively.
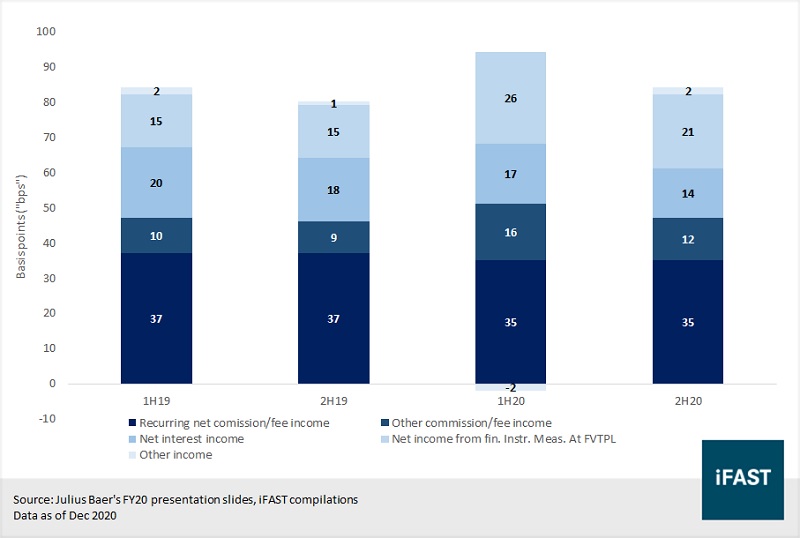
Even if transaction volumes were to decline, most of Julius Baer’s net commission/fee income is recurring. As their gross margins are calculated by dividing operating income with average asset under management (“AuM”), it can be seen from Figure 1 that a good portion of Julius Baer’s operating income is recurring.
Figure 1: Julius Baer’s gross margin by segment
Looking at adjusted operating expenses (excludes expenses related to acquisitions or divestments and their taxes), it remained relatively stable but if we exclude a CHF 73m provision related to the FIFA matter, adjusted expenses decreased by 2.8% to CHF 2.47b. Julius Baer was investigated for money laundering and corruption practices involving officials and affiliates of world soccer federation FIFA. Regulatory proceedings in Switzerland against the bank were concluded in February 2020 and in September 2020, Julius Baer also reached an in-principle agreement with the US Department of Justice, resolving the investigation of the lender’s role in the corruption events.
Personnel expenses decreased by 1.3% on the back of cost reduction measures due to higher performance-related remuneration and severance costs. Overall, adjusted net profit increased by 24.0% YoY to CHF 957m in FY20.
Julius Baer’s capital adequacy ratios continued to strengthen despite higher dividend payouts for FY20. CET1 capital ratio increased by 90 bps from end-2019 driven by a CHF 0.28b gain in CET1 capital despite CHF 163m of negative currency translation differences and CHF 77m worth of share buy-backs in 2020. Risk-weighted assets (“RWA”) improved by CHF 0.63b due to higher market volatility, partly drive by an increase of CHF 0.45b in market RWA.
Table 1: Breakdown of Julius Baer’s capital and RWA
|
BIS approach/CHF m |
Dec-19 |
Jun-20 |
Dec-20 |
|
Credit risk |
13,749 |
14,194 |
13,755 |
|
Non-counterparty-related risk |
613 |
576 |
581 |
|
Market risk |
671 |
903 |
1,117 |
|
Operational risk |
5,462 |
5,612 |
5,668 |
|
Total risk-weighted positions |
20,495 |
21,285 |
21,121 |
|
CET1 capital |
2,877 |
2,950 |
3,157 |
|
Tier 1 capital |
4,421 |
4,119 |
4,296 |
|
- of which hybrid tier 1 capital instruments |
1,544 |
1,168 |
1,139 |
|
Total capital |
4,522 |
4,250 |
4,430 |
|
Leverage exposure |
101,002 |
106,078 |
107,194 |
|
CET1 capital ratio |
14.0% |
13.9% |
14.9% |
|
BIS total capital ratio |
22.1% |
20.0% |
21.0% |
|
Tier 1 leverage ratio |
4.4% |
3.9% |
4.0% |
Source: Company's FY20 presentation slides, iFAST compilations
Relative valuation
We compare Julius Baer against two other Swiss banks – UBS and Credit Suisse (“CS”). Julius Baer may be the smallest bank but its credit profile is still relatively strong. Credit Suisse is also having trouble of its own with it being involved with the collapse of Greensill Capital and Archegos Capital Management. Regarding the latter, Credit Suisse stated that the loss “could be highly significant and material to [their] first quarter results”.
Table 2: Comparing the 3 Swiss banks
|
CHF millions |
Julius Baer Group |
UBS Group |
Credit Suisse Group |
|
CET1 capital |
2,877 |
39,890 |
35,351 |
|
Total capital |
4,522 |
61,226 |
52,426 |
|
Risk-weighted assets |
20,495 |
289,101 |
275,576 |
|
CET1 ratio (%) |
14.9 |
13.8 |
12.8 |
|
Total capital ratio (%) |
21.0 |
21.2 |
19.0 |
Source: Respective companies, iFAST compilations
Data as of 31 Dec 2020
Looking at credit ratings, UBS has the highest issuer credit rating, followed by Julius Baer and Credit Suisse. Both the perpetuals issued by Julius Baer and UBS are borderline investment grade (“IG”), with S&P considering the UBS 5% Perpetual Corp (USD) as a speculative-grade bond (“HY”). However, the CS 5.625% Perpetual Corp (SGD) is rated as a speculative-grade bond by both S&P and Fitch.
Table 3: Credit ratings across the 3 issuers
|
Bond credit rating (S&P/Fitch) |
Issuer credit rating (S&P/Fitch) |
|
|
Baa3* |
Baa1* |
|
|
BB/BBB |
A-/A+ |
|
|
BB-/BB+ |
BBB+/A- |
Source: Bloomberg Finance L.P., iFAST compilations. *Rated by Moody's
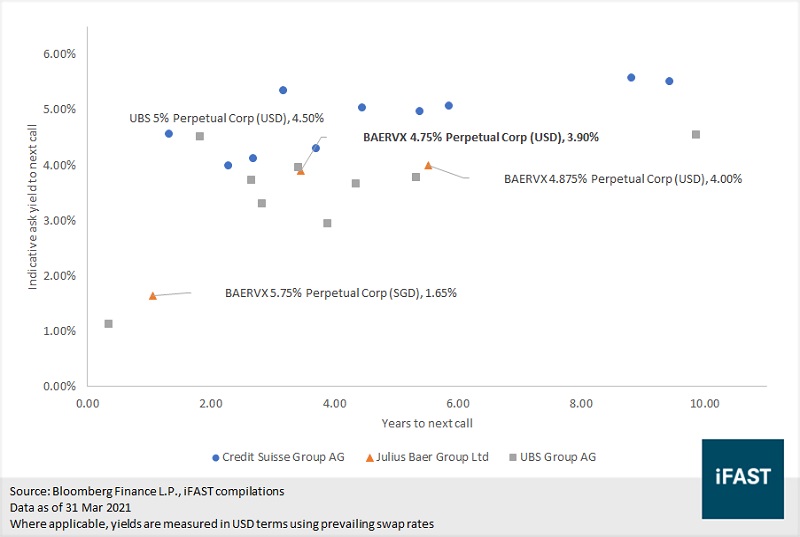
Looking at relative valuations among additional tier-1 instruments (“AT1s”), the BAERVX 4.750% Perpetual Corp (USD) looks attractive, considering that Credit Suisse notes have potentially higher downside risks and lower capital ratios. The perp’s next call date is on 12 Sep 2024 and has an indicative ask yield to call of 3.93%. It will reset to the sum of the prevailing 5Y USD Treasury rate and 2.844%.
Using forward rate expectations, the distribution rate will reset to about 5.29%, which will be higher than its current coupon rate. Assuming that 5Y Treasury rates will continue trending higher in 2024, we think that Julius Baer should call back its perp. The bank also has a history of calling back their perps.
The UBS 5.000% Perpetual Corp (USD) also looks interesting, having one of the highest yield to call out of all the UBS perps, despite it having a nearer call date compared to other perpetual notes. However, this perp also has a lower initial spread of 243.2 bps as compared to the initial spread of 459bps for the UBS 6.875% Perpetual Corp (USD).
Figure 2: Relative valuation of AT1s across the 3 banks
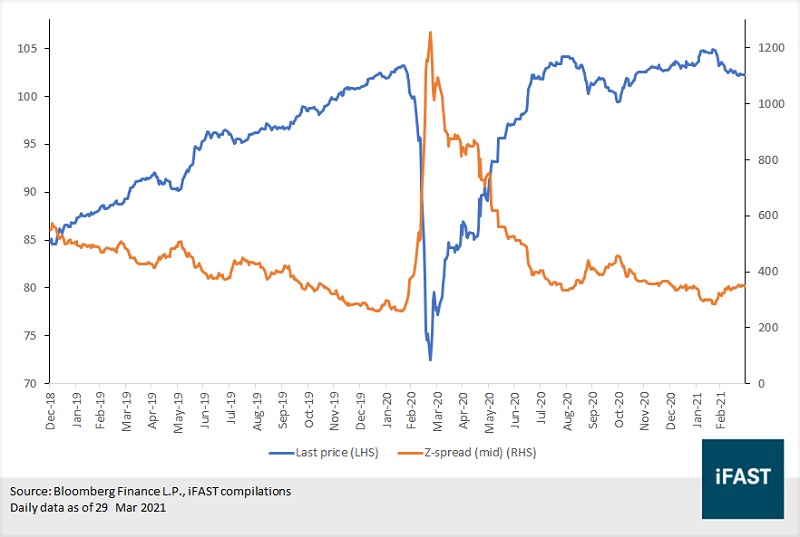
To add on to our earlier point on the Julius Baer security, the recent decline in the price of the BAERVX 4.750% Perpetual Corp (USD) has also made it more attractive (Figure 3). Although credit spreads are still relatively low, its current yield to call still looks decent in this environment.
Figure 3: Price and z-spread of the BAERVX 4.75% PERP (USD)
Declaration: For specific disclosure, at the time of publication of this report, IFPL (via its connected and associated entities) holds a position in the UBS 5.875% Perpetual Corp (SGD) and the analyst who produced this report hold a NIL position in the abovementioned securities.