


The Chinese government unveiled the roadmap for the development of the Greater Bay Area (“GBA”) in February last year. Following that, regulators in China have recently revealed plans to facilitate cross-border transactions between Hong Kong, Southern China and Macau. Under the new plan, residents of the designated territories are allowed to buy wealth management products in each other’s markets, a move that will increase capital flows within the region.
This is a progressive step towards boosting infrastructure connectivity between the cities and a plan to attract more talent to the GBA. According to the Hong Kong General Chamber of Commerce, the idea of allowing Hong Kong firms to set up shops in the mainland will help businesses recover from the ongoing recession. As more companies set up businesses in the Greater Bay Area, cross-border activity will grow, creating a demand for real estate that will benefit property developers in the long term.
With RMB 685 billion of real estate in the GBA – which constitutes 82% of total saleable resources – Logan Group Company Limited (“Logan”; formerly known as Logan Property Holdings Company Limited) has an outsized exposure to cities within the region. Further to our earlier report, we maintain our positive outlook on Logan, a listed entity on the Hong Kong Stock Exchange (3380:HK) with a total land bank of 36.6m square meters (“sqm”).
Latest corporate structure
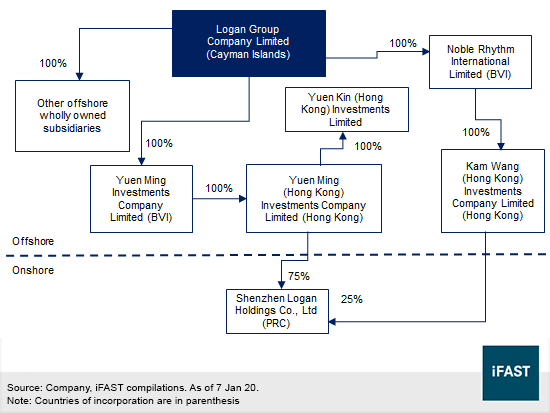
Certain unsecured bonds of Logan are guaranteed by offshore subsidiaries (outside China), namely Yuen Ming Investments Company Limited, Yuen Ming (Hong Kong) Investments Company Limited, Noble Rhythm International Limited and Kam Wang (Hong Kong) Investments Company Limited (Figure 1). These are initial subsidiary guarantors of the Logan group that are holding companies with no significant operations. RMB-denominated corporate bonds of the group are issued by Shenzhen Logan Holding Co., Ltd, an onshore entity within the group structure.
Figure 1: Corporate structure (simplified)
Land bank and saleable resources
Besides providing good earnings visibility, Logan has reportedly locked in 80% of its expected revenue for 2020. The company’s existing land bank is sufficient to sustain its targeted sales growth for the next three years.
As of its latest update, the property developer recorded RMB 832.0m of saleable resources. This included urban renewal projects (48.1% of total saleable resources) and land bank developments (51.9%). Additionally, there were some RMB 431.4 billion of saleable resources in its land bank, with properties situated in Shenzhen, Guangzhou, Hong Kong and Singapore (Table 1).
Table 1: Land bank
|
Regions |
GFA (millions of sqm) |
Saleable resources (RMB billions) |
|
Shenzhen |
1.1 |
80.8 |
|
Huizhou / Dongguan |
7.4 |
76.1 |
|
Guangzhou / Foshan / Zhaoqing |
6.9 |
65.9 |
|
Zhuhai / Zhongshan |
3.5 |
46.1 |
|
Hong Kong |
0.1 |
13.4 |
|
Other cities |
3.3 |
23.3 |
|
GBA subtotal |
22.3 |
305.6 |
|
Southwest region |
9.1 |
71.7 |
|
Yangtze River Delta |
0.8 |
9.9 |
|
Singapore |
0.2 |
11 |
|
Other regions |
4.2 |
33.2 |
|
Total |
36.6 |
431.4 |
|
Source: Company, iFAST compilations |
||
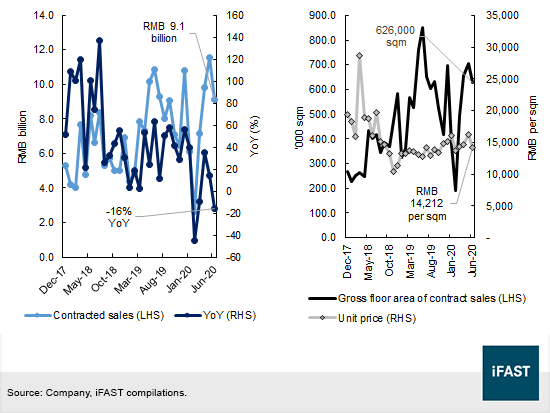
Monthly contracted sales fell from the high of RMB 11.56 billion in May to RMB 9.1 billion in June. However, sales remained higher than the low of RMB 2.65 billion reached in February (Figure 2). Gross floor area from contracted sales climbed to 626,000 sqm last month, representing an overall upward trend since December 2017.
After a nationwide shutdown earlier in the year from the impact of COVID-19, Logan posted a 16% YoY decrease in attributable contracted sales for the month ending June. Remarkably, attributable contracted sales still added to RMB 46.4 billion for the first six months of the year, up from RMB 45.3 billion in the same period last year. The property developer also sold properties at an average selling price (“ASP”) of RMB 14,212 per sqm in June, surpassing the ASP of RMB 13,635 per sqm recorded for full-year 2019.
Last year, operating results likewise exceeded expectations as the group achieved RMB 91.5 billion in attributable contracted sales, representing a 31% gain from 2018 and beating its sales target by 8%. With regard to 2020, the group expects to launch RMB 180 billion of projects, 60% of which (amounting to RMB 108 billion) will stem from developments within the Greater Bay Area.
Figure 2: Monthly contracted sales
Residential prices in land bank cities
General residential prices in some cities have declined in year-to-date June (Table 2). On a GFA-weighted basis and using Logan’s land bank exposures as of 1H19, we estimated that the group’s portfolio property prices could decreased by 0.7% in the first six months of this year. Huizhou, for instance, has witnessed a 1.2% drop in prices YTD. It was reported last year that the closure of a large South Korean smartphone factory had left the city in a downturn.
While this may not be indicative of Logan’s individual property prices, they provide a signal of macro trends within the cities. In the long term, real estate demand in the GBA will improve as urbanization rates continue to rise. However, in the near term, there may be some signs of weakness as macroeconomic conditions in a number of cities have softened.
As an example, the nominal GDP growth rate of Guangzhou, the capital of Guangdong, dropped from 6.3% in 2018 to 3.4% in 2019. Zhongshan, which relies heavily on the textile and hardware trade, has also seen a 14.6% drop in nominal GDP during 2019.
Table 2: Change in general housing prices
|
City |
Land bank gross floor area as at 30 Jun 19 (sqm) |
2018 Change |
2019 Change |
Jun YTD change |
|
Nanning |
5,868,044 |
10.1% |
4.2% |
0.0% |
|
Huizhou |
5,215,596 |
-2.5% |
-0.6% |
-1.2% |
|
Foshan |
3,465,192 |
6.8% |
16.0% |
2.9% |
|
Zhaoqing |
3,346,504 |
1.6% |
0.0% |
-2.6% |
|
Heyuan |
2,617,295 |
0.3% |
-0.6% |
0.2% |
|
Shantou |
2,468,018 |
4.6% |
9.3% |
-0.4% |
|
Zhongshan |
2,383,374 |
2.8% |
-4.6% |
-2.5% |
|
Shenzhen |
1,933,202 |
2.8% |
3.0% |
1.7% |
|
Chaozhou |
1,498,450 |
20.7% |
-19.4% |
-9.4% |
|
Zhuhai |
1,333,074 |
1.4% |
-1.7% |
0.5% |
|
Fang Chenggang |
843,414 |
43.1% |
-12.8% |
-0.6% |
|
Liuzhou |
751,465 |
12.0% |
6.5% |
-1.3% |
|
Yangjiang |
632,959 |
9.0% |
6.4% |
-3.3% |
|
Chengdu |
573,486 |
6.4% |
-0.3% |
1.6% |
|
Guilin |
445,856 |
4.7% |
1.9% |
0.5% |
|
Dongguan |
443,342 |
6.2% |
8.7% |
0.1% |
|
Lingshui |
426,142 |
N.A |
N.A |
1.8% |
|
Meishan. |
411,210 |
38.1% |
-2.8% |
0.4% |
|
Jiaxing. |
301,241 |
5.5% |
8.2% |
-0.5% |
|
Beihai |
228,900 |
19.1% |
0.0% |
-3.3% |
|
Shanwei. |
199,352 |
-9.2% |
5.5% |
0.0% |
|
Guangzhou |
176,626 |
12.2% |
-1.2% |
-3.5% |
|
Singapore |
146,467 |
-2.4% |
18.2% |
0.4% |
|
Qingyuan |
106,770 |
4.3% |
2.7% |
-0.9% |
|
Hong Kong |
35,303 |
0.2% |
14.3% |
5.3% |
|
Suzhou |
33,494 |
10.7% |
15.5% |
5.1% |
|
Haikou |
27,751 |
24.1% |
-0.1% |
-2.7% |
|
Source: Anjuke.com, Fang.com, ura.gov.sg, company, iFAST compilations |
||||
2019 financials and credit highlights
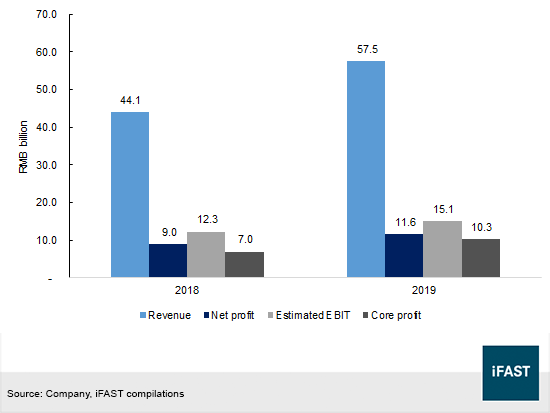
Logan delivered healthy top- and bottom-line results last year. Group revenue and core profit witnessed year-on-year growth rates of 30% and 43%, reaching RMB 57.5 billion and RMB 10.3 billion respectively (Figure 3). Net profit was up 29% YoY to RMB 11.6 billion. Estimated EBIT, which excluded other income, other expenses, fair value changes in derivatives and investment properties, increased from RMB 12.3 billion in 2018 to RMB 15.1 billion in 2019.
Figure 3: Earnings highlights
Logan’s reported net gearing ratio (net debt over equity) rose slightly from 63.2% in 2018 to 67.4% in 2019, in line with an 18.2% increase in total borrowings to RMB 72.0 billion. When expressed as a percentage of total assets and including the value of its perpetual securities, we estimated Logan’s aggregate leverage ratio at 35.0% (Table 3), down from 38.9% the previous year.
Logan’s asset coverage ratio is high. Total financial obligations, including the value of guarantees and liabilities under its cross-border guarantee arrangements, added to RMB 118.3 billion, which remained lower than its tangible assets of RMB 158.1 billion.
The company’s annual land acquisitions are likely to constrain improvements in its leverage ratios. On the other hand, Logan has ample liquidity with RMB 34.8 billion of unrestricted cash, which is 1.2 times its short-term borrowings, providing an adequate buffer against coronavirus headwinds and the associated economic slowdown. In addition, the group has a good interest coverage ratio with an estimated EBIT-to-interest expense multiple of 3.2x.
Table 3: Credit metrics
|
|
2018 |
2019 |
|
|
Reported net gearing ratio |
63.2% |
67.4% |
|
|
Total debt (including perpetual securities) |
RMB 66.2 billion |
RMB 72.0 billion |
|
|
Total debt over total assets |
38.9% |
35.0% |
|
|
Financial obligations (including guarantees, cross border arrangements) |
RMB 112.0 billion |
RMB 118.3 billion |
|
|
Tangible assets |
RMB 110.9 billion |
RMB 158.1 billion |
|
|
Cash position (RMB billion) |
28.4 |
34.8 |
|
|
Short-term borrowings (RMB billion) |
22.1 |
29.6 |
|
|
Estimated EBIT over interest expense |
3.7x |
3.2x |
|
|
Source: Company, iFAST estimates |
|||
Relative valuation
Admittedly, with the tightening of credit spreads in recent months, bond valuations within the Logan curve may not be the most attractive within the sector. However, the credit profile of the issuer is healthy and its credit metrics remained in acceptable range. With Logan’s bonds trading at a credit spread of more than 400 basis points over US Treasuries (“G-spread”), we think that investors may still consider the LOGPH notes.
Figure 4: Relative valuation among comparable BB developer credits
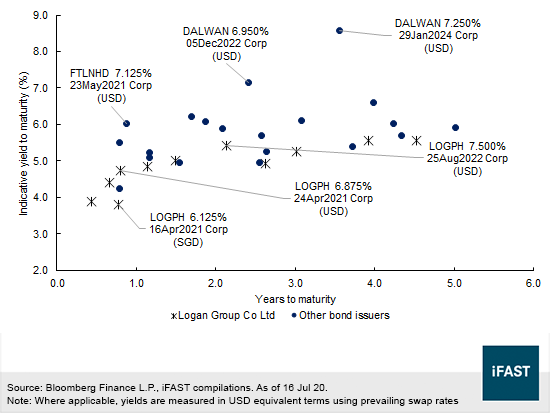
We continue to like the LOGPH 6.125% 16Apr2021 Corp (SGD), which is currently trading at an indicative ask yield to maturity (“YTM”) of 4.1% (Figure 4). Nonetheless, we note that Logan’s USD notes seem to be more attractively priced, such as the LOGPH 6.875% 24Apr2021 Corp (USD), a senior unsecured note that is callable on or after 24 Apr 20 at 102.
From a historical viewpoint, the LOGPH 6.875% ‘21s may not be comparatively cheap when benchmarked against the average spread of comparable credits. After reaching the peak of 1,288bps on Mar 24, the average spread of comparable bonds declined to around 548bps (Figure 5). Meanwhile, the LOGPH 6.875% ‘21s tightened from 1,275bps to 499bps in the same period.
Figure 5: Credit spreads of LOGPH 6.875% ‘21s vs peers
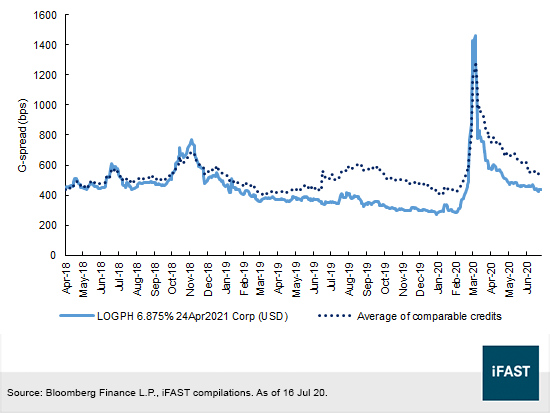
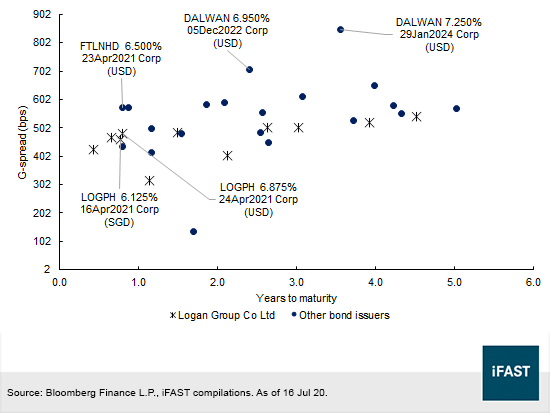
Both the LOGPH 6.875% ‘21s and the benchmark average have widened by 136bps and 80bps respectively in YTD 15 Jul 20. At current prices, the LOGPH 6.875% ‘21s provide a decent yield to maturity of 4.7%, which is reasonable within the LOGPH curve (Figure 6).
Investors seeking for higher yields with a similar credit rating may consider the FTLNHD 7.125% 23May2021 Corp (USD), a USD 300m bond of Seazen Holdings. On a side note, Fitch Ratings has a BB rating on the FTLNHD 7.125% ‘21s, which is identical to Logan’s issuer rating by the same rating agency.
The DALWAN 6.950% 05Dec2022 Corp (USD) and DALWAN 7.250% 29Jan2024 Corp (USD) have YTMs north of 7% (Figure 4) but this is likely reflective of the obligor’s higher credit risk. The DALWAN notes are issued by entities under Dalian Wanda Commercial Management Group Co., Ltd, a private company and the commercial property platform of Dalian Wanda Group.
Figure 6: Relative valuation
Declaration:
For specific disclosure, at the time of publication of this report, IFPL (via its connected and associated entities) holds principal positions in LOGPH 6.125% 16Apr2021 Corp (SGD) and FUTLAN 6.450% 11Jun2022 Corp (USD). The analyst who produced this report hold a NIL position in the abovementioned securities.


