Key Points
- Standard Chartered’s earnings stayed strong: non-interest segments carried profits amid a softer rates backdrop.
- Its Fit-For-Growth programme continued to deliver efficiency savings, with greater long-term benefits expected from FY27 onwards.
- Asset quality remains steady with adequate provisioning.
- Liquidity and funding remain clear strengths for the company, helped by its strong domestic franchise and investment-grade rating.
- We provide multiple SGD and USD recommendations for investors to consider.
Standard Chartered plc (StanChart) recently released its FY25 results, delivering another strong annual performance. We review its FY25 performance in greater detail, discuss its outlook, and conclude with our top recommendations.
Healthy profit growth, with non-rates segments doing the heavy lifting
(Unless otherwise stated, results are in USD [$] terms as of FY25 [31 December 2025], growth rates are year-on-year [YoY].)
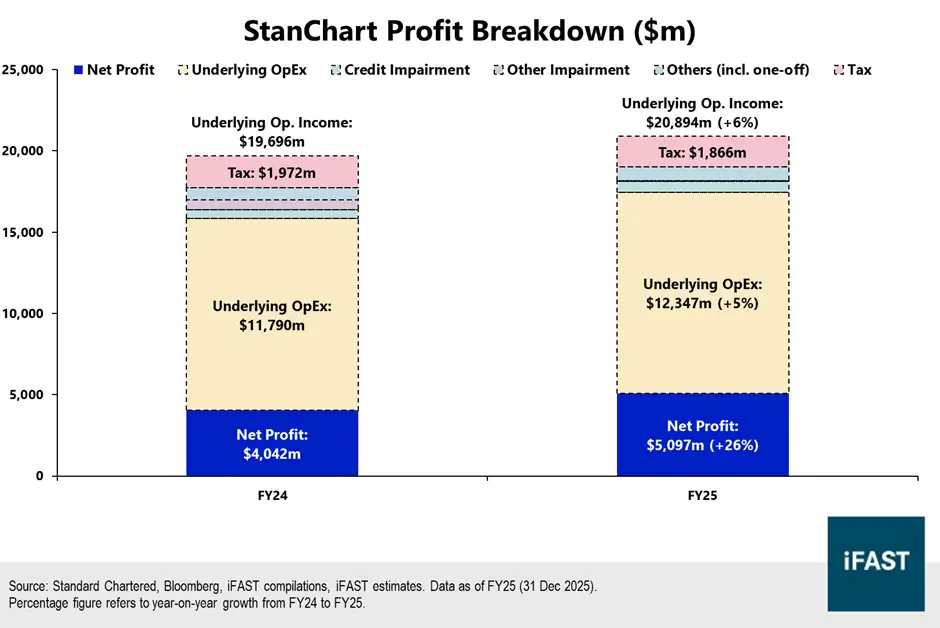
StanChart reported underlying operating income of $20.9b (+6%). Costs increased but remained controlled: efficiency savings helped offset ‘one-off’ restructuring charges ($320m) and Fit-For-Growth costs ($531m). Underlying operating expenses (excluding one-off items) rose just +4%, supporting a modest improvement in its cost-to-income ratio in FY25.
(Note: Fit-For-Growth is StanChart’s three-year plan to rationalise its costs, now entering its final year in 2026.)
On the revenue front, underlying net interest income (NII) grew just +1% to $11.2b, as StanChart navigated interest rate headwinds (net interest margins - FY24: 2.06% / FY25: 2.03%) by optimising loan volume and mix. 4Q25 NII was temporarily boosted from an 86 basis points (bps) increase in HIBOR, though this was not fully structural as HIBOR began falling again in early 2026 (Chart 1). Overall, this muted performance was unsurprising in a global rate-cut environment.
By contrast, non-NII grew a much stronger +13% to $9.7b, reflecting broad-based momentum across fee-led and client-driven franchises. The strongest growth areas were Wealth Solutions (e.g. wealth management) (+24%), Global Banking (corporate and institutional banking) (+15%), and Global Markets (trading and hedging activity) (+12%) (Chart 2). These tend to benefit from higher client activity, stronger net inflows, and recurring fee generation. Overall, the decent +13% growth shows the successful execution of StanChart’s strategy to expand non-interest revenue streams as rate tailwinds fade.
Meanwhile, credit impairment charges increased to $676m (FY24: $557m), though this does not appear to reflect a structural deterioration in asset quality. The increase was mainly driven by Corporate & Investment Banking, where FY24 benefited from impairment releases that did not recur in FY25 (i.e. a normalisation effect). Overall, StanChart delivered another year of profit growth, driven by the combination of top-line growth and managed expenses, with reported profits rising +26% to $5.1b (Chart 3).
Chart 1: Net interest income grew only marginally in FY25 (+1%)

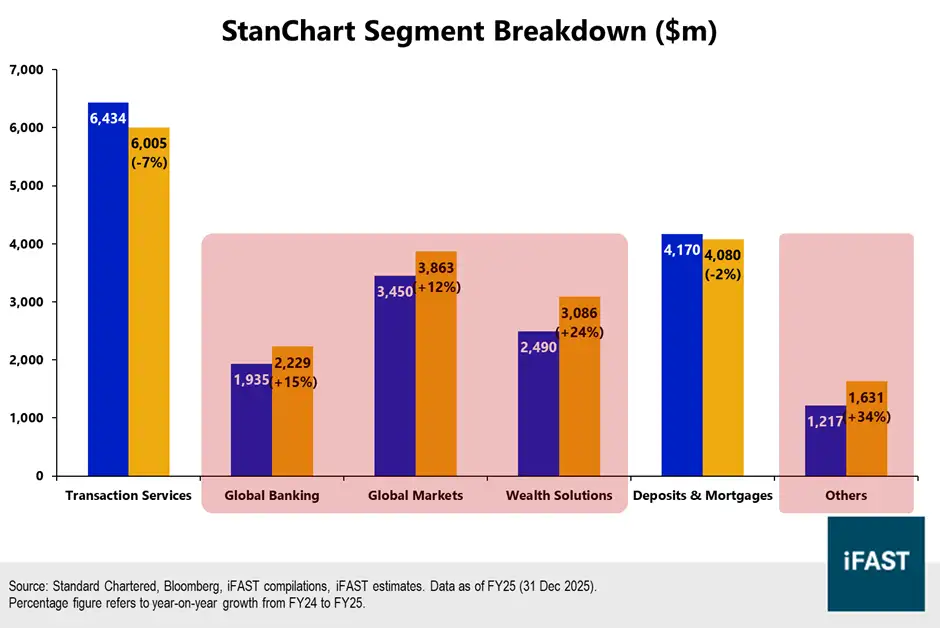
Chart 3: Net profit grew strongly (+26%) due to a combination of top-line growth and managed expenses
Outlook: Expect steady performance in the years ahead
Management is targeting reported operating income growth around the bottom end of the 5% - 7% range in FY26, after achieving its previous 2023 – 2026 three-year target ahead of schedule. Within this, it expects NII to be broadly flat year-on-year amidst ongoing margin headwinds (currency weighted average rates forecast to decline by 44 bps). This effectively implies an 11% - 15% forecast for non-NII growth in FY26.
We think operating income growth in the single-digit percentage region remains achievable in FY26. StanChart continues to do well in both NII and non-NII segments, with non-NII segments benefiting from continued momentum in net new money inflows and AUM growth. Nonetheless, high-base effects may make it harder for StanChart to consistently deliver strong double-digit growth, while macroeconomic and geopolitical risks remain in the background. Our outlook, therefore, assumes moderate but positive growth, balancing continued momentum with lingering headwinds.
On costs and margins, we expect cost-to-income jaws to improve in FY26 and FY27. Management is guiding for broadly flat reported costs in FY26, despite higher FY26 Fit-For-Growth implementation costs ($0.4b in expected cost savings versus $0.6b cost to achieve). With income growth moderating, we expect modest jaws improvement in FY26, with scope for greater improvements from FY27 as Fit-For-Growth savings become more visible (FY27: $0.3b in expected cost savings).
Overall, we expect StanChart to deliver gradually improving profits in FY26 (single-digit growth) despite interest rate and various macroeconomic headwinds.
Stable asset quality with adequate provisioning
StanChart’s asset quality remains stable with adequate provisioning. Stage 3 loans remain a small proportion of its overall loan portfolio (around 2%); if we include CG12 loans (Stage 2 loans close to distress), this proportion rises to 2.4%, still modest compared to 1 – 2 years back (Chart 4). Furthermore, as stated above, credit impairments rose primarily due to normalisation effects from FY24, rather than a deterioration; there was no repeat of major impairments seen in prior years (e.g. Bohai Bank in 2023 / software in 2024).
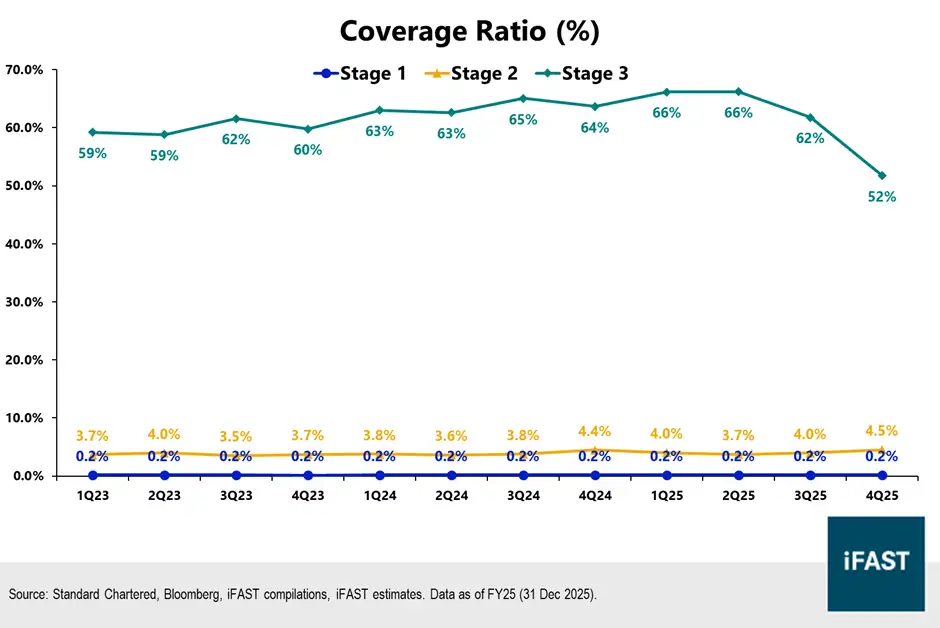
Its coverage ratio (provisions divided by gross loans outstanding) was broadly stable for Stage 1 (0.2%) and Stage 2 (4% - 5%) but dropped significantly for Stage 3 loans to 52% pre-collateral and 68% post-collateral (FY24: 64% & 78%) (Chart 5). StanChart attributed part of the decline to portfolio restructuring and sovereign downgrade effects.
StanChart also has some exposure to the Middle East – UAE accounts for about 6% of its operating income, or about 2% - 3% of its total assets and customer deposits. It also has exposures to other Middle Eastern countries (e.g. Bahrain), though the exact breakdown is not disclosed. If geopolitical risks continue to build, StanChart may take incremental pre-emptive provisioning – this would likely evolve over a few quarters, depending on how the US-Iran conflict develops.
Overall, StanChart’s FY25 provisioning still looks adequate considering its stable loan book. We do not rule out a rebuild of provisioning in FY26 if the global macroeconomic and/or geopolitical situation worsens – this would pressure near-term earnings, though StanChart has historically maintained a prudent provisioning stance.
Chart 4: Stage 3 + CG12 loans still account for a small percentage of the portfolio
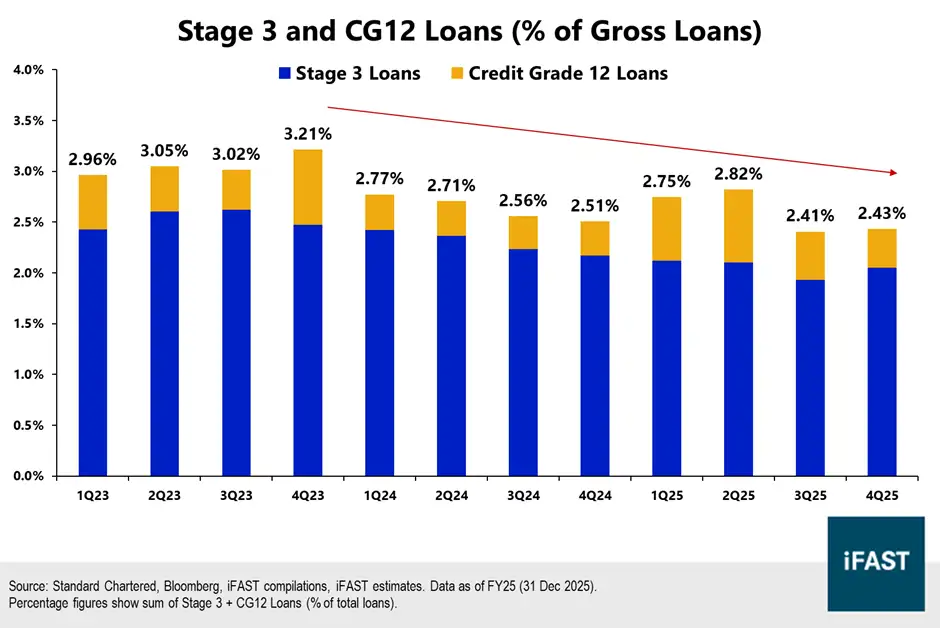
Chart 5: Coverage ratio recently dipped in Stage 3 loans
Liquidity and funding pose very few issues for StanChart
StanChart’s funding strength is primarily supported by its large customer deposit base across multiple regions, particularly Asia. This includes core franchises in Hong Kong & Singapore, where StanChart is a domestic SIB. As a result, it does not need to rely on wholesale funding, though it should retain strong market access given its strong investment-grade rating and established issuance track record across currencies.
StanChart’s liquidity remained strong with a liquidity coverage ratio (LCR) of 155% (requirement: 100%). Together with a low advances-to-deposits ratio (51%), the high LCR suggests that StanChart is well-positioned to withstand near-term liquidity shocks without needing to aggressively shrink its balance sheet.
Strong capital buffers as usual
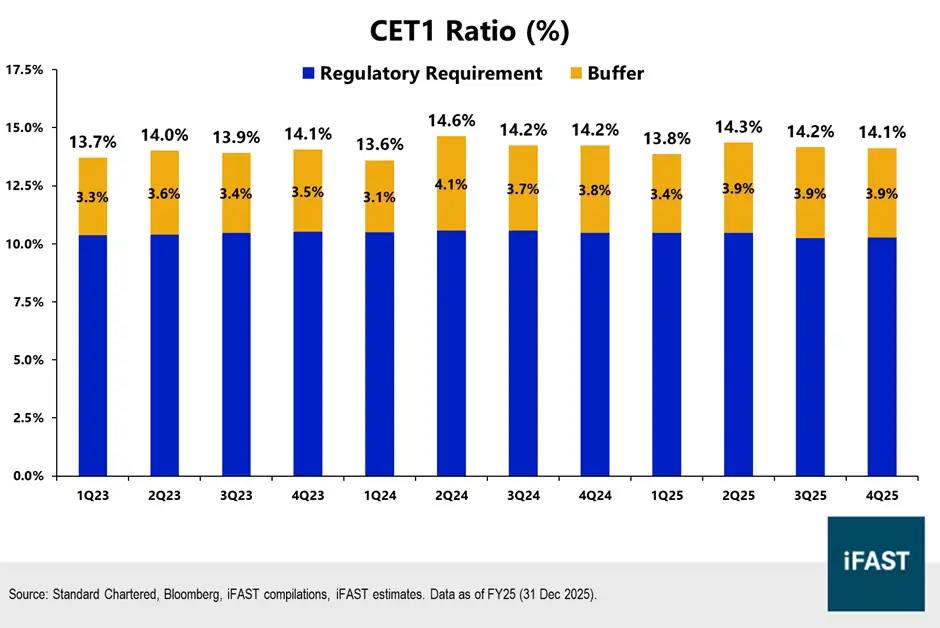
StanChart reported a CET1 ratio of 14.1% in FY25, well above its requirements of 10.3% and also slightly above management’s 13% - 14% operating range (Chart 6). This 14.1% figure was technically lower than FY24’s 14.2%, which we attribute mainly to substantial shareholder distributions (dividends and buybacks) offsetting profit growth. Looking ahead, management guided that its newly-announced $1.5b buyback would reduce CET1 by 58 bps, bringing it to 13.5%, still leaving comfortable headroom.
Its other ratios remained decent as well, including a 4.7% leverage ratio (requirement: 3.7%) and 33.5% MREL ratio (requirement: 28.4%). Its MREL ratio dipped slightly from FY24 (34.2%), though this mainly reflects management’s choice to optimise its capital stack rather than a deterioration in solvency.
(Note: MREL ratio includes StanChart’s entire capital stack and is more comprehensive than the total capital ratio as it also includes senior bail-in debt).
Over time, we expect StanChart’s capital ratios to hold steady. Management appears comfortable operating around current capital levels – as StanChart earns more profits in future, we expect them to distribute it gradually to its shareholders via continued dividends and buybacks.
Chart 6: Decent CET1 buffer over regulatory requirements
Bond recommendations
StanChart clearly delivered a solid performance in FY25, while its credit profile remains strong. This makes its bonds suitable for many investors, especially conservative ones looking for a stable source of income.
- Within the SGD non-perpetuals space, we find StanChart’s senior unsecured bonds (2030 and 2033) fairly priced relative to other bank papers (Table 1). We generally prefer Tier 2 papers over senior unsecured bonds for the slight yield pickup, and StanChart does not have any Tier 2 bonds outstanding.
- For SGD perpetuals, investors comfortable with perpetuals-related risks (especially non-call and loss-absorption risks) can expect yields of around 4+% for StanChart’s bonds. The highest-yielding bonds in this table include Barclays perpetuals. Non-call risks are higher for issuances with lower reset spreads – some newer issuances today are priced to perpetuity rather than to reset (Table 2).
(Note: Higher spreads are better as they incentivise an eventual call (issuers can refinance by re-issuing fresh perpetuals at lower rates). Even in a non-call scenario, higher spreads result in higher reset rates.)
Table 1: SGD bond comparison (non-perpetuals)
| Bond Name | Reset / Maturity Date (Years to Reset / Maturity) |
Ask Price | Yield to Worst (%) | Credit Rating (S&P / Moody's / Fitch) |
| STANLN 4.000% 19Jan2030 Corp (SGD) | 19 Jan 2029 / 19 Jan 2030 (2.8 / 3.8) |
105.267 | 2.08% | BBB+ / A3 / A |
| STANLN 4.500% 14Jun2033 Corp (SGD) | 14 Jun
2032 / 14 Jun 2033 (6.2 / 7.2) |
111.300 | 2.53% | BBB+ / A3 / A |
| HSBC 4.500% 07Jun2029 Corp (SGD) | 07 Jun 2028 / 07 Jun 2029 (2.2 / 3.2) |
105.091 | 2.14% | A- / A3 / A+ |
| SANTAN 3.600% 23Oct2030 Corp (SGD) | 23 Oct
2029 / 23 Oct 2030 (3.6 / 4.6) |
104.417 | 2.31% | A- / Baa1 / A |
| SANTAN 2.350% 13Nov2031 Corp (SGD) | 13 Nov 2030 / 13 Nov 2031 (4.7 / 5.7) |
99.517 | 2.40% | A- / Baa1 / A |
| ACAFP 2.750% 15Jan2032 Corp (SGD) | 15 Jan
2031 / 15 Jan 2032 (4.8 / 5.8) |
100.383 | 2.58% | A- / A3 / A+ |
| HSBC 3.400% 28May2033 Corp (SGD) | 28 May 2032 / 28 May 2033 (6.2 / 7.2) |
104.183 | 2.66% | A- / A3 / A+ |
| Source: Bloomberg, Bondsupermart, iFAST compilations. Data as of 16 Mar 2026. | ||||
Table 2: SGD bond comparison (perpetuals)
| Bond Name | Call / Reset Date (Years to Call / Reset) |
Ask Price | Yield to Worst (%) | Credit Rating (S&P / Moody's / Fitch) | Reset Rate |
| STANLN 5.300% Perpetual Corp (SGD) | Call: 19 Sep 2029 (3.5) Reset: 19 Mar 2030 (4.0) |
103.400 | 4.25% (call) | BB+ / Ba1 / BBB- | 5y SORA + 3.077% |
| STANLN 4.300% Perpetual Corp (SGD) | Call: 15
Jul 2031 (5.3) Reset: 15 Jan 2032 (5.8) |
100.350 | 4.11% (perpetuity) | BB+ / Ba1 / BBB- | 5y SORA + 2.263% |
| HSBC 5.250% Perpetual Corp (SGD) | Call: 14 Jun 2029 (3.7) Reset: 14 Dec 2029 (4.2) |
102.883 | 4.14% (perpetuity) | - / Baa3 / BBB | 5y SORA + 2.237% |
| TD 5.700% Perpetual Corp (SGD) | Call &
Reset: 31 Jul 2029 (3.4) |
105.153 | 4.05% (call) | BBB- / Baa2 / BBB+ | 5y SORA + 2.652% |
| UBS 5.750% Perpetual Corp (SGD) | Call & Reset: 21 Aug 2029 (3.4) |
104.800 | 4.23% (call) | - / Baa3 / BBB- | 5y SORA + 2.776% |
| UBS 5.600% Perpetual Corp (SGD) | Call &
Reset: 21 Dec 2029 (3.8) |
104.667 | 4.24% (call) | - / Baa3 / BBB- | 5y SORA + 2.634% |
| BACR 5.400% Perpetual Corp (SGD) | Call: 15 Mar 2030 (4.0) Reset: 15 Jun 2030 (4.2) |
102.300 | 4.70% (perpetuity) | - / Ba1 / BBB- | 5y SORA + 2.788% |
| HSBC 5.000% Perpetual Corp (SGD) | Call: 24
Mar 2030 (4.5) Reset: 24 Sep 2030 (5.0) |
102.867 | 4.22% (call) | - / Baa3 / BBB | 5y SORA + 2.705% |
| BACR 4.650% Perpetual Corp (SGD) | Call: 15 Dec 2031 (5.8) Reset: 15 Mar 2032 (6.0) |
100.550 | 4.57% (call) | - / Ba1 / BBB- | 5y SORA + 3.083% |
| Source: Bloomberg, Bondsupermart, iFAST compilations. Data as of
16 Mar 2026. Yield to Worst takes the lowest of (i) yield to next call (ii) yield to next reset (iii) yield to perpetuity. |
|||||
- For USD non-perpetuals, senior unsecured bonds are better-suited for more conservative investors wanting stable income (Table 3), while Tier 2 bonds provide decent yield pickup for those comfortable with some subordination risks (Table 4).
- We think medium-tenor bonds offer more compelling risk-reward ratios today, particularly those around the 5y – 10y range (bolded in Tables 3 & 4 below).
- Finally, for USD perpetuals, investors comfortable with perpetuals-related risks (especially non-call and loss-absorption risks) can expect yields of around 5% to 7% for StanChart’s bonds. As with SGD, non-call risks would be higher for issuances with lower reset spreads (i.e. lower risks for higher reset spreads). We list some examples below, with those with higher reset spreads bolded (Table 5).
Table 3: USD bond comparison – senior unsecured (medium-tenor bonds bolded)
| Bond Name | Reset / Maturity Date (Years to Reset / Maturity) |
Ask Price | Yield to Worst (%) | Credit Rating (S&P / Moody's / Fitch) |
| STANLN 7.767% 16Nov2028 Corp (USD) | 16 Nov 2027 / 16 Nov 2028 (1.7 / 2.7) |
105.08 | 4.55% | BBB+ / A3 / A |
| STANLN 7.018% 08Feb2030 Corp (USD) | 08 Feb
2029 / 08 Feb 2030 (2.9 / 3.9) |
106.603 | 4.55% | BBB+ / A3 / A |
| STANLN 5.005% 15Oct2030 Corp (USD) | 15 Oct 2029 / 15 Oct 2030 (3.6 / 4.6) |
101.284 | 4.61% | BBB+ / A3 / A |
| STANLN 4.529% 05Jun2032 Corp (USD) | 05 Jun
2031 / 05 Jun 2032 (5.2 / 6.2) |
98.304 | 4.84% | BBB+ / A3 / A |
| STANLN 6.296% 06Jul2034 Corp (USD) | 06 Jul 2033 / 06 Jul 2034 (7.3 / 8.3) |
106.463 | 5.22% | BBB+ / A3 / A |
| STANLN 6.097% 11Jan2035 Corp (USD) | 11 Jan
2034 / 11 Jan 2035 (7.8 / 8.8) |
105.465 | 5.23% | BBB+ / A3 / A |
| STANLN 5.400% 12Aug2036 Corp (USD) | 12 Aug 2035 / 12 Aug 2036 (9.4 / 10.4) |
99.846 | 5.38% | BBB+ / A3 / A |
| STANLN 5.706% 05Mar2047 Corp (USD) | 05 Mar
2046 / 05 Mar 2047 (20.0 / 21.0) |
94.885 | 6.12% | BBB+ / A3 / A |
| Source: Bloomberg, Bondsupermart, iFAST compilations. Data as of 16 Mar 2026. | ||||
Table 4: USD bond comparison – Tier 2 (medium-tenor bonds bolded)
| Bond Name | Reset / Maturity Date (Years to Reset / Maturity) |
Ask Price | Yield to Worst (%) | Credit Rating (S&P / Moody's / Fitch) |
| STANLN 4.300% 19Feb2027 Corp (USD) | - / 19 Feb 2027 (- / 0.9) |
100.038 | 4.25% | BBB / Baa2 / BBB+ |
| STANLN 3.265% 18Feb2036 Corp (USD) | 18 Nov
2030 / 18 Feb 2036 (4.7 / 9.9) |
92.424 | 5.02% | BBB / Baa2 / BBB+ |
| STANLN 5.300% 09Jan2043 Corp (USD) | - / 09 Jan 2043 (- / 16.8) |
93.417 | 5.92% | BBB / Baa2 / BBB+ |
| STANLN 5.700% 26Mar2044 Corp (USD) | - / 26 Mar
2044 (- / 18.0) |
95.759 | 6.09% | BBB / Baa2 / BBB+ |
| Source: Bloomberg, Bondsupermart, iFAST compilations. Data as of 16 Mar 2026. | ||||
Table 5: USD bond comparison (perpetuals)
| Bond Name | Call / Reset Date (Years to Call / Reset) |
Ask Price | Yield to Worst (%) | Credit Rating (S&P / Moody's / Fitch) | Reset Rate |
| STANLN 7.750% Perpetual Corp (USD) | Call: 15 Aug 2027 (1.4) Reset: 15 Feb 2028 (1.9) |
102.800 | 5.65% (call) | BB+ / Ba1 / BBB- | 5y UST + 4.976% |
| STANLN 4.300% Perpetual Corp (USD) | Call: 19
Aug 2028 (2.4) Reset: 19 Feb 2029 (2.9) |
95.771 | 5.90% (reset) | BB+ / Ba1 / BBB- | 5y UST + 3.135% |
| STANLN 7.875% Perpetual Corp (USD) | Call: 08 Mar 2030 (4.0) Reset: 08 Sep 2030 (4.5) |
105.313 | 6.33% (call) | BB+ / Ba1 / BBB- | 5y UST + 3.574% |
| STANLN 4.750% Perpetual Corp (USD) | Call: 14
Jan 2031 (4.8) Reset: 14 Jul 2031 (5.3) |
93.437 | 6.22% (reset) | BB+ / Ba1 / BBB- | 5y UST + 3.805% |
| STANLN 7.625% Perpetual Corp (USD) | Call: 16 Jan 2032 (5.8) Reset: 16 Jul 2032 (6.3) |
104.705 | 6.64% (call) | BB+ / Ba1 / BBB- | 5y UST + 3.023% |
| STANLN 7.000% Perpetual Corp (USD) | Call: 14
Nov 2035 (9.7) Reset: 14 May 2036 (10.2) |
100.192 | 6.83% (perpetuity) | BB+ / Ba1 / BBB- | 5y UST + 2.873% |
| Source: Bloomberg, Bondsupermart, iFAST compilations. Data as of
16 Mar 2026. Yield to Worst takes the lowest of (i) yield to next call (ii) yield to next reset (iii) yield to perpetuity. |
|||||
Declaration: For specific disclosure, at the time of publication of this report, IFPL (via its connected and associated entities) holds positions in STANLN 4.300% Perpetual Corp (SGD), BACR 4.650% Perpetual Corp (SGD), STANLN 5.400% 12Aug2036 Corp (USD), and STANLN 4.300% 19Feb2027 Corp (USD). The analyst who produced this report holds NIL positions in the abovementioned securities. This research report was prepared with the assistance of artificial intelligence (AI) tools. iFAST Financial Pte Ltd does not rely exclusively on AI for content generation; the content of this report – including all investment theses, ratings, price targets and conclusions – has been independently reviewed and verified by the research analyst(s) to ensure accuracy and professional integrity.