- FWD delivered another strong year in FY25, with new business growth remaining strong, led by Hong Kong & Macau.
- FWD’s profitability improved as higher contractual service margin (CSM) release lifted insurance earnings. Cost discipline supported earnings quality, with FWD’s expense ratio improving (falling) to 14.3% from 15.3%.
- Management’s outlook remains constructive, with mid-teens OPAT growth still the broad goal, supported by a larger CSM base and tighter cost control.
- FWD’s credit metrics strengthened post-IPO, with leverage falling to 21.3%, solvency staying strong, and free-surplus generation improving in FY25.
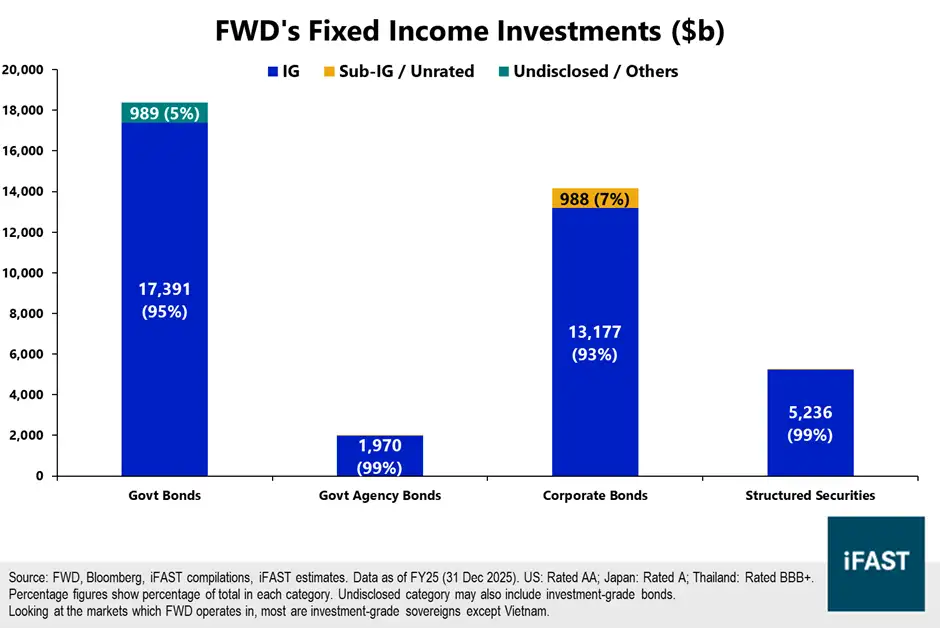
- FWD’s investment book remains fairly solid, with most assets in fixed income, high investment-grade exposure, and limited China property or LGFV risk.
- We remain confident of FWD’s credit profile, and primarily recommend its 2030, 2031, and 2033 bonds.
FWD delivered yet another set of good results in FY25, with net profits continuing to improve alongside healthy business growth and a stronger credit profile. Read on for our thoughts on its FY25 results, and some interesting bonds to consider!
FWD continued to deliver double-digit business growth
(Unless otherwise stated, US Dollar figures are represented with $ or USD, percentage growth rates are year-on-year [y/y] and in actual currency terms.)
FWD continued to deliver strong business growth in FY25. Annualised premium equivalents (APE) rose +25% to $2,446m, Value of New Business (VNB) grew +11% to $945m, while new business contractual service margins (CSM) increased +18% to $1,476m (Chart 1).
(APE, VNB, and new business CSM all measure new business performance. APE measures revenues, while VNB and new business CSM measure profitability. CSM refers to the portion of profit that is deferred at the start and recognised over time because insurance contracts are usually long-term.)
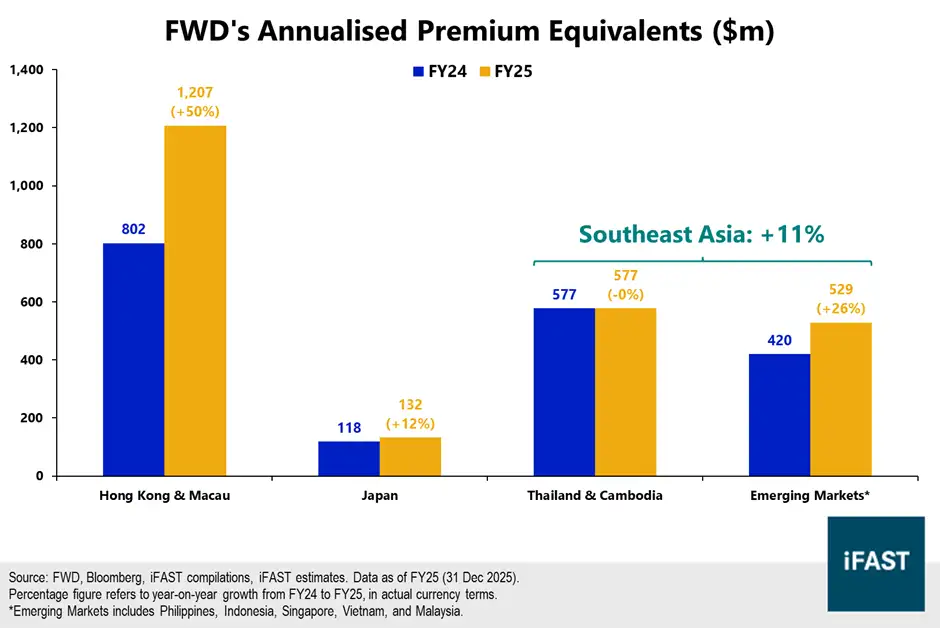
The strong growth was driven mainly by the ‘Hong Kong & Macau’ segment (as in FY24), with APE (+51%) and VNB (+44%) both rising by strong double-digit percentages. Management described demand as broad-based across both onshore and offshore businesses, including a recent push to high-net-worth clients via FWD Private. Growth elsewhere was decent, including Japan (+11% APE) and Southeast Asia (SEA) (also +11% APE). However, performance within SEA itself was mixed, with flattish APE growth in Thailand and Cambodia contrasting with stronger growth in ‘Emerging Markets*’ (Chart 2).
(*FWD’s Emerging Markets segment comprises the Philippines, Indonesia, Singapore, Vietnam, and Malaysia.)
Chart 1: FWD continued to grow its business at a fast pace
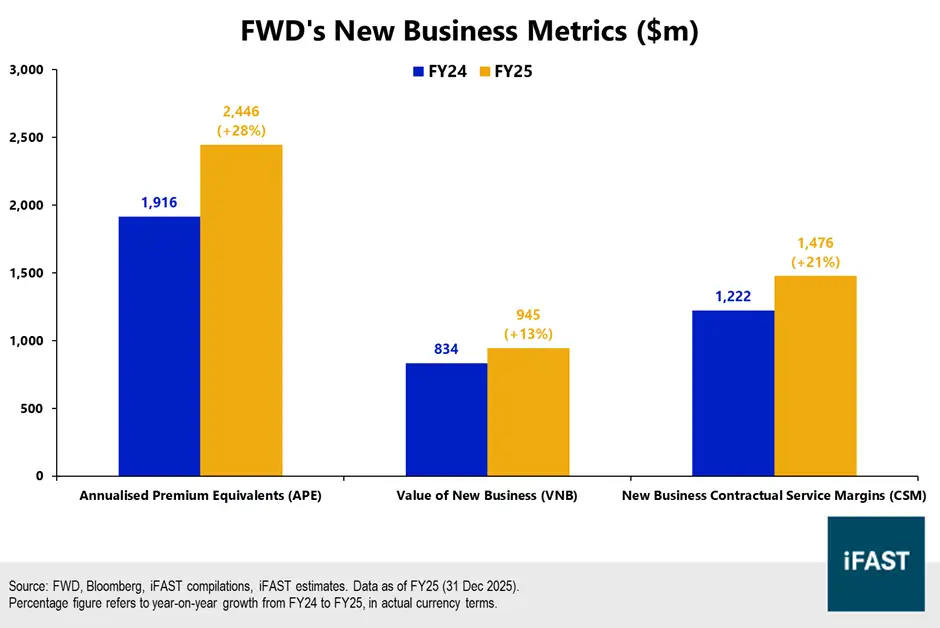
Chart 2: Growth was strongest in HK & Macau, and uneven within Southeast Asia
Profitability improved (again), building on FY24 momentum
Higher CSM releases helped drive FWD’s stronger performance in FY25. FWD’s net insurance and investment result rose +13% from $911m in FY24 to $1,025m in FY25; insurance service result was the bigger driver, increasing +25% to $835m, whereas investment result was weaker y/y. This was not surprising given FWD’s growing business and therefore larger CSM balance, which stood at $5,174m at start-2025, and ended at $6,562m (+27%) in end-2025 (Chart 3).
Cost management supported the quality of FWD’s profitability. General and other expenses dipped -12% from $550m to $486m in FWD’s statutory P&L, suggesting that management’s group-wide focus on expense discipline (highlighted over a year ago) continued to pay off. Management also said in its earnings call that most markets (excluding Emerging Markets) were already in aggregate expense-underrun territory.
FWD’s operating efficiency improved, with its expense ratio improving (falling) from 15.3% to 14.3%. Although operating expenses grew +8% from $1,051m to $1,112m, cost growth lagged overall business growth, suggesting improving operating leverage.
(Note: Expense ratio is calculated as operating expenses divided by total weighted premium income, or TWPI, which is used as a proxy for total premiums.)
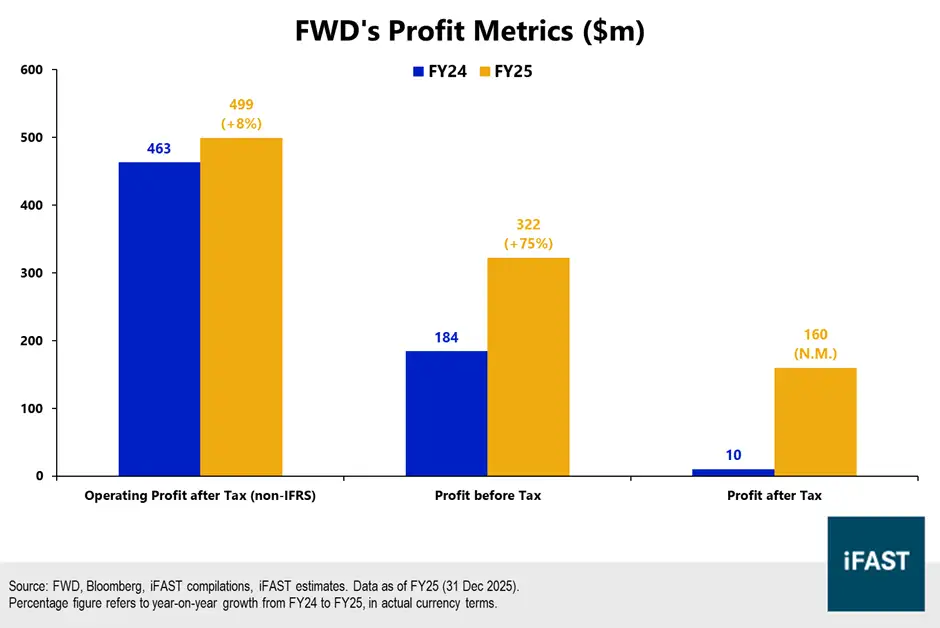
Overall, FWD’s earnings momentum improved markedly from FY23 to FY25, with core profitability rising steadily and statutory earnings catching up. Operating profit after tax (OPAT) rose from $372m in FY23 to $463m in FY24 and $499m in FY25, while statutory PAT moved from a -$717m loss in FY23 to a modest $10m profit in FY24, before rising more clearly to $160m in FY25 (Chart 4). This suggests that the underlying business had already been improving since FY23, with accounting results taking longer to catch up due to some non-operating and market-related items.
(Note: OPAT is non-IFRS but is the main metric management looks at in evaluating profitability.)
Chart 3: CSM balance grew significantly in FY25
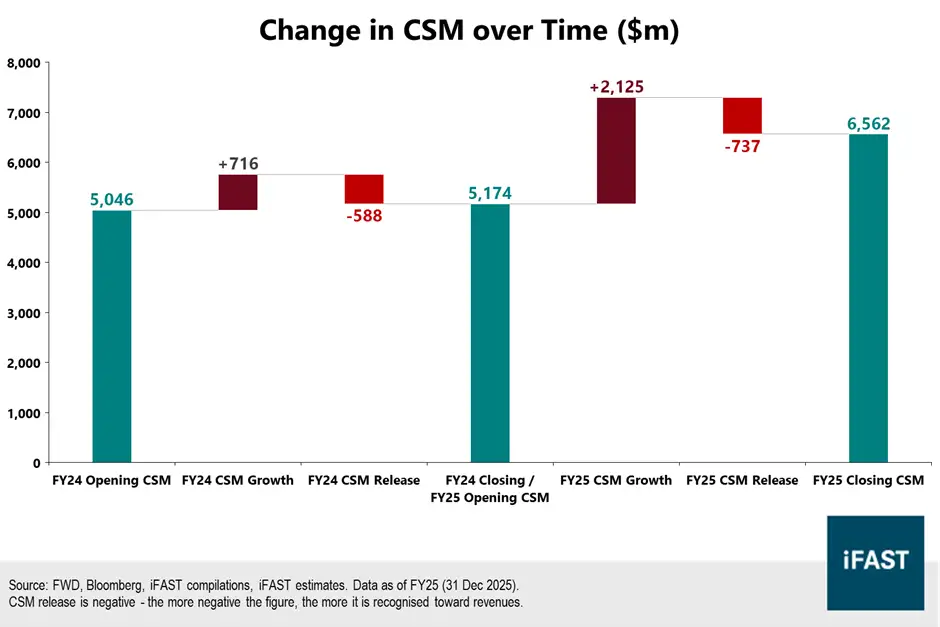
Table 1: Expense ratio improved in FY25
| Metric | FY24 | FY25 | % Change (y/y, actual) |
| IFRS - General & Other Expenses | 550 | 486 | -12% |
| Operating Expenses [A] | 1,016 | 1,112 | +9% |
| Total Weighted Premium Income [B] | 6,632 | 7,783 | +17% |
| Expense Ratio [A / B] | 15.3% | 14.3% | -1.0 pp (improvement) |
| Source: FWD, Bloomberg, iFAST compilations, iFAST estimates. Data as of FY25 (31 Dec 2025). | |||
Chart 4: FWD’s profitability improved across different metrics in FY25
Outlook remains constructive on sustained growth momentum
Management is guiding for continued growth across the group, including reiterating its mid-teens OPAT growth guidance over future years. This is supported by a larger CSM balance today, achieved from the past few years of strong organic growth, which should support stronger profit release over time. Management also said that net underlying free surplus generation (UFSG) should broadly grow with earnings over time, which supports future financial performance.
(Note: Free surplus represents the excess of adjusted net asset value over required capital. UFSG hence refers to the free surplus generated over the period.)
This positive group-level outlook could still come with some divergence between segments. In Hong Kong, growth is expected to remain healthy and margins sustainable, but management expects normalisation from a high base effect. Both the Emerging Market and Japan segments are also expected to continue performing reasonably well. On the other hand, the Thailand segment may continue to face margin pressures in 2026 from lower rates, though management still expects a return to growth later in 2026. Overall, while some segments may perform better / worse than others, the broader Group-level trajectory remains very much positive.
More generally, management appears increasingly focused on margins and earnings quality, which helps in the sustainability of longer-term profits. Most of its segments are already in an expense-underrun situation; we expect cost-management and efficiency initiatives (e.g. AI call centres) to contribute to recurring cost improvements. While it may be difficult to replicate FY25’s explosive top-line growth due to high base effects, management remains on track to grow the bottom line through a combination of revenue growth and tighter cost control.
Steady capital generation with strong asset quality
FWD continued to generate capital in FY25, supporting its future cashflow potential. Reported net UFSG improved meaningfully (+21%) from $709m in FY24 to $857m in FY25, pushing the year-end free surplus balance to $1,369m. This was driven by stronger business performance in the form of improved operating variances (e.g. difference between actual and expected performance), as well as management actions in the form of reinsurance transactions.
(Note: As a recap, UFSG is a measure of free surplus or capital generation. Net UFSG specifically also deducts free surplus used to fund new business.)
Its underlying asset quality remains fairly solid (Chart 5). About 81% of its investment portfolio was in fixed income, of which FWD management stated 96% was investment-grade. In addition, over half of its debt securities holdings were government bonds, particularly those where FWD has significant operations (e.g. Thailand, which is also investment-grade). Management also shared that it had a minuscule exposure to Chinese real estate and also zero LGFV exposure. Finally, FWD expressed confidence in its conservative approach to private credit, with most of its exposures here in collateralised loan obligations and mortgage-backed securities (implying little to no direct lending).
Leverage profile improved significantly post-IPO
FWD’s credit profile improved significantly in FY25, with the biggest change coming in its lower leverage ratio (i.e. stronger balance sheet). Its leverage ratio fell from 25.5% in end-FY24 to 21.3% in end-FY25, primarily due to higher equity levels, as FWD utilised its IPO proceeds to refinance some of its existing perpetuals. Looking ahead, management continues to target a leverage range of 15% - 20%, which we think is achievable so long as earnings and free surplus generation persist in the coming years.
(Note: Leverage ratio = total borrowings / [total borrowings + total equity to shareholders and non-controlling interests + CSM])
FWD’s solvency ratio was 265% as of end-FY25, representing a 5 percentage points (pp) increase from FY24. Importantly, with FWD adopting updated solvency ratio rules in Japan, its Group-level solvency ratio is expected to drop from 265% to 210% on a Group level (pro-forma), though we are not overly concerned as it reflects a change in regulatory calculation methodologies rather than a deterioration in its balance sheet. There could also be a short-term headwind of up to $50m - $100m on free-surplus generation, but ultimately FWD’s solvency profile remains strong and well above requirements.
Chart 5: FWD’s fixed income portfolio is concentrated into (i) government bonds, and (ii) investment-grade bonds
Bond comparison (USD)
Overall, FWD continues to deliver strong growth, and importantly, looks to be moving into a healthier phase where strong business growth translates into accounting earnings and a stronger credit profile. Management’s target of improving (lowering) leverage further to 15% - 20% is also a good sign for bondholders.
We provide a bond comparison in Table 2 below.
First, FWD itself has multiple bonds outstanding, of which we primarily recommend its 2030, 2031, and 2033 bonds.
- Their 2033 senior unsecured bonds stand out as a high-coupon option for those who do not want subordination risks.
- Between their subordinated bonds (non-perpetuals), we primarily recommend the 2030 and 2031 bonds for decent 5+% yields without taking on too much duration risk.
- The 2035 bonds are better suited for those who are looking at a duration play to capture price fluctuations, though the absolute yield pickup looks fairly small versus the 2030 and 2031 bonds.
Compared to peers, FWD’s bonds provide decent yield pickups. Its peer bonds from Ping An Insurance, AIA, and Prudential are generally trading at yields of under 5% (excluding long tenors). We remain confident of FWD’s credit profile and think the yield pickup justifies the lower rating (versus AIA and Prudential).
Table 2: Bond comparison (FWD recommendations bolded)
| Bond Name | Reset / Maturity Date (Years to Reset / Maturity) |
Ask Price | Yield to Worst (%) | Credit Rating (S&P / Moody's / Fitch) | Seniority |
| FWDGHD 5.252% 22Sep2030 Corp (USD) | - / 22 Sept 2030 (- / 4.4) |
100.464 | 5.13% | - / Baa2 / BBB- | Subordinated |
| FWDGHD 7.635% 02Jul2031 Corp (USD) | - / 02 Jul
2031 (- / 5.2) |
110.080 | 5.38% | - / Baa2 / BBB- | Subordinated |
| FWDGHD 7.784% 06Dec2033 Corp (USD) | - / 06 Dec 2033 (- / 7.6) |
114.968 | 5.36% | - / Baa1 / BBB | Senior Unsecured |
| FWDGHD 5.836% 22Sep2035 Corp (USD) | - / 22
Sept 2035 (- / 9.4) |
101.169 | 5.67% | - / Baa2 / BBB- | Subordinated |
| FWDGHD 6.675% Perpetual Corp (USD) | 01 Feb 2028 / - (1.8 / -) |
100.250 | 5.59% | - / Baa3 / BBB- | Junior Subordinated |
| PINGIN 4.250% 28May2029 Corp (USD) | - / 28 May
2029 (- / 3.1) |
99.610 | 4.39% | - / Baa2 / - | Senior Unsecured |
| PINGIN 2.950% 25Feb2031 Corp (USD) | - / 25 Feb 2031 (- / 4.8) |
92.926 | 4.60% | - / Baa2 / - | Senior Unsecured |
| PINGIN 2.850% 12Aug2031 Corp (USD) | - / 12 Aug
2031 (- / 5.3) |
91.832 | 4.61% | - / Baa2 / - | Senior Unsecured |
| PINGIN 6.125% 16May2034 Corp (USD) | - / 16 May 2034 (- / 8.1) |
106.899 | 5.07% | - / Baa2 / - | Senior Unsecured |
| PINGIN 5.000% 08Oct2035 Corp (USD) | 08 Jul
2035 / 08 Oct 2035 (9.2 / 9.5) |
99.184 | 5.11% | - / Baa2 / - | Senior Unsecured |
| AIA 5.625% 25Oct2027 Corp (USD) | 25 Sept 2027 / 25 Oct 2027 (1.4 / 1.5) |
102.185 | 4.01% | AA- / A1 / A+ | Senior Unsecured |
| AIA 3.900% 06Apr2028 Corp (USD) | 06 Jan
2028 / 06 Apr 2028 (1.7 / 1.9) |
99.741 | 4.04% | AA- / A1 / - | Senior Unsecured |
| AIA 3.600% 09Apr2029 Corp (USD) | 09 Jan 2029 / 09 Apr 2029 (2.7 / 3.0) |
98.644 | 4.09% | AA- / A1 / - | Senior Unsecured |
| AIA 3.375% 07Apr2030 Corp (USD) | 07 Jan
2030 / 07 Apr 2030 (3.7 / 3.9) |
97.167 | 4.16% | AA- / A1 / A+ | Senior Unsecured |
| AIA 4.950% 04Apr2033 Corp (USD) | 04 Jan 2033 / 04 Apr 2033 (6.7 / 6.9) |
102.694 | 4.48% | AA- / A1 / A+ | Senior Unsecured |
| AIA 5.375% 05Apr2034 Corp (USD) | 05 Jan
2034 / 05 Apr 2034 (7.7 / 7.9) |
102.909 | 4.92% | A / A2 / A | Subordinated |
| AIA 4.950% 30Mar2035 Corp (USD) | 30 Dec 2034 / 30 Mar 2035 (8.7 / 8.9) |
99.999 | 4.95% | A / A2 / A | Subordinated |
| PRUFIN 2.950% 03Nov2033 Corp (USD) | 03 Nov
2028 / 03 Nov 2033 (2.5 / 7.5) |
96.191 | 4.57% | A / A3 / - | Subordinated |
| PRUFIN 4.875% Perpetual Corp (USD) | - / - (- / -) |
91.707 | 5.32% | A- / A3 / A- | Subordinated |
| Source: Bloomberg, Bondsupermart, iFAST compilations. Data as of 24 Apr 2026. | |||||
Declaration: For specific disclosure, at the time of publication of this report, IFPL (via its connected and associated entities) holds positions in FWDGHD 5.252% 22Sep2030 Corp (USD), and the analyst who produced this report holds NIL positions in the abovementioned securities. This research report was prepared with the assistance of artificial intelligence (AI) tools. iFAST Financial Pte Ltd does not rely exclusively on AI for content generation; the content of this report – including all investment theses, ratings, price targets and conclusions – has been independently reviewed and verified by the research analyst(s) to ensure accuracy and professional integrity.