About Alibaba
Alibaba is one of China’s largest technology conglomerates, operating across e-commerce, cloud computing, digital media, logistics, and international commerce. The group has four main operating segments. The China E-commerce Group – comprising Taobao, Tmall, and the newly launched Taobao Instant Commerce – is the group’s core cash generator. The International Digital Commerce Group (AIDC) covers AliExpress, Lazada, and Trendyol (the leading e-commerce platform in Turkey). Cloud Intelligence houses Alibaba Cloud and the Qwen AI model family. All Others includes logistics (Cainiao), digital entertainment (Hujing DME), health (Alibaba Health), and local services (Amap).
9M26 financials largely impacted by intense price wars
Alibaba’s 9MFY26 (April to December 2025) financials tell a tale of two forces: a resilient top line and a deliberately compressed bottom line. Group revenue rose a modest 2.7% year-on-year (YoY) to RMB 780.3b. However, adjusting for the disposal of Sun Art and Intime in early 2025, we estimate underlying revenue growth for continuing operations to be closer to 10-11%, indicating a meaningfully stronger organic performance.
Profitability, however, declined sharply. Group adjusted EBITA* fell 49.2% YoY to RMB 71.3b in 9MFY26, with margins contracting from 18.5% (9MFY25) to 9.1%. We highlight that this compression is almost entirely attributable to two discrete investment decisions (mentioned below) rather than structural business deterioration.
*EBITA is a derivation of EBITDA that still reflects depreciation, given the capital-intensive nature of its cloud and logistics businesses
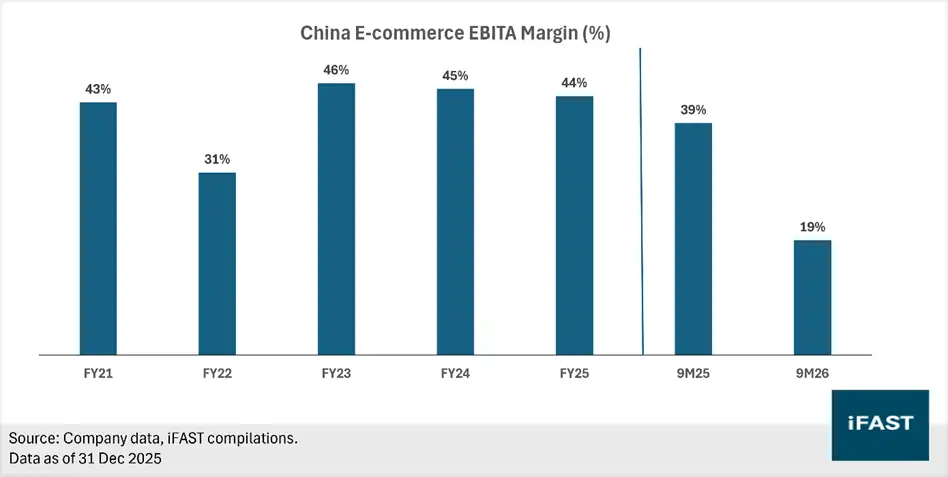
First, the April 2025 launch of Taobao Instant Commerce led to an aggressive expansion into quick commerce, alongside heavy subsidies to build consumer mindshare. As a result, selling and marketing expenses rose 77.7% YoY to RMB 191.6b, materially weighing on earnings. Consequently, China E-commerce Group’s adjusted EBITA fell 45.6% YoY to RMB 83.5b in 9MFY26 (9MFY25: RMB 153.5b), while margins compressed from 39.1% to 19.3%. This is the most significant driver of Alibaba’s earnings compression. Second, adjusted EBITA losses in the “All others” segment more than doubled to RMB -14.6b (9MFY25: RMB -6.1b), reflecting continued investment in newer initiatives such as AI foundation models and related ecosystem development. In contrast, the Cloud Intelligence segment remained a bright spot, with adjusted EBITA rising 28.7% YoY to RMB 10.5b, underscoring improving profitability in a key growth driver.
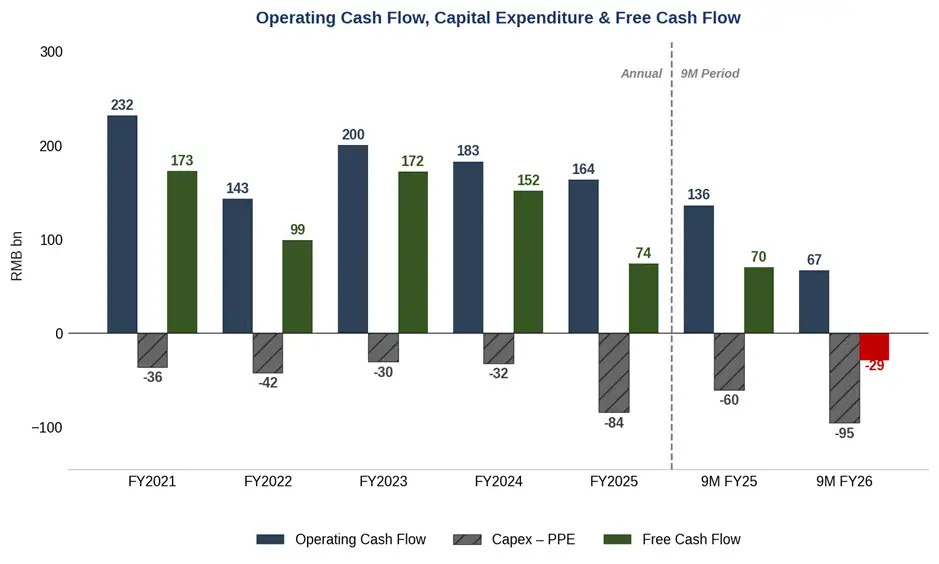
Cash flow generation also weakened during the period. Operating cash flow (OCF) fell 51% YoY to RMB 66.8b, while capital expenditure increased 58% YoY to RMB 96.1b, driven by continued investment in cloud infrastructure and in the quick commerce rollout. Consequently, free cash flow (FCF) swung negative to an outflow of RMB 29.3b.
Overall, Alibaba’s 9MFY26 performance was largely negatively impacted by the intense price competition seen in China’s e-commerce sector, particularly from peers such as Meituan and JD, prompting elevated subsidies to retain market share. Looking ahead, we think 9MFY26 could mark a trough in adjusted EBITA for the Chinese E-commerce segment. Regulatory measures aimed at curbing unsustainable price competition should support a gradual normalisation in profitability, particularly within the core China E-commerce segment.
Dominant local e-commerce business anchors Alibaba’s earnings
Over the past five years, Alibaba has derived the bulk of its core profits from the China E-commerce Group (see table 1 below). On a trailing twelve-month basis (TTM), this segment generated RMB 125.2b in adjusted EBITA at a 23.5% margin – representing roughly 121% of the total group adjusted EBITA of RMB 103.9b. Aside from the Cloud Intelligence segment, which has only recently become a consistent positive contributor, the China E-commerce business is effectively subsidising the rest of the group.
We note the durability of this dominance; annual adjusted EBITA from this segment has held between RMB 182b and RMB 214b over the past five fiscal years, despite intensifying competition from players such as PDD holdings and ByteDance’s Douyin, both of which have scaled aggressively across e-commerce and livestreaming. As seen in chart 2 below, the TTM adjusted EBITA margin of 23.5% is significantly lower than the high 30s – mid 40+% range seen in the past five years. However, we do not view this margin compression as reflective of a structurally weaker business – rather, it reflects Alibaba’s ongoing investment cycle in quick commerce, alongside elevated subsidy spending to defend market share during the intense price war.
Looking ahead, regulatory measures aimed at curbing unsustainable price competition should alleviate subsidy pressures. In our view, this shift is likely to disproportionately benefit Alibaba, given its position as the market leader in China’s local e-commerce landscape. As competitive subsidy intensity moderates, we expect China E-commerce EBITA margins to recover toward the 30% range–still below historical peaks, but more reflective of a steady-state that incorporates continued investment in quick commerce. We also note management’s commentary that, despite near-term earnings volatility, the unit economics of the quick commerce segment have shown month-on-month improvement, suggesting a gradual path toward profitability (by FY29, or 3 years away, according to management).
Table 1: Historical EBITA contribution from Alibaba’s 4 operating segments
|
Contribution Mix to EBITA (%) |
FY21 |
FY22 |
FY23 |
FY24 |
FY25 |
9MFY25 |
9MFY26 |
|
China E-commerce |
125% |
140% |
128% |
118% |
113% |
109% |
117% |
|
International Digital Commerce |
-3% |
-7% |
-3% |
-5% |
-9% |
-8% |
-3% |
|
Cloud Intelligence |
-1% |
1% |
3% |
4% |
6% |
6% |
15% |
|
All Others (excluding unallocated / inter-segment eliminations) |
-17% |
-27% |
-17% |
-12% |
-7% |
-4% |
-20% |
|
Note: Alibaba’s fiscal year ends 31 March (FY21: year ending 31 March 2021) Data as of 31 December 2025 Source: Company data, iFAST compilations. |
|||||||
Chart 2: Historical EBITA margin for the China E-commerce segment
Increasing monetisation of Cloud/AI businesses strengthens earnings resilience
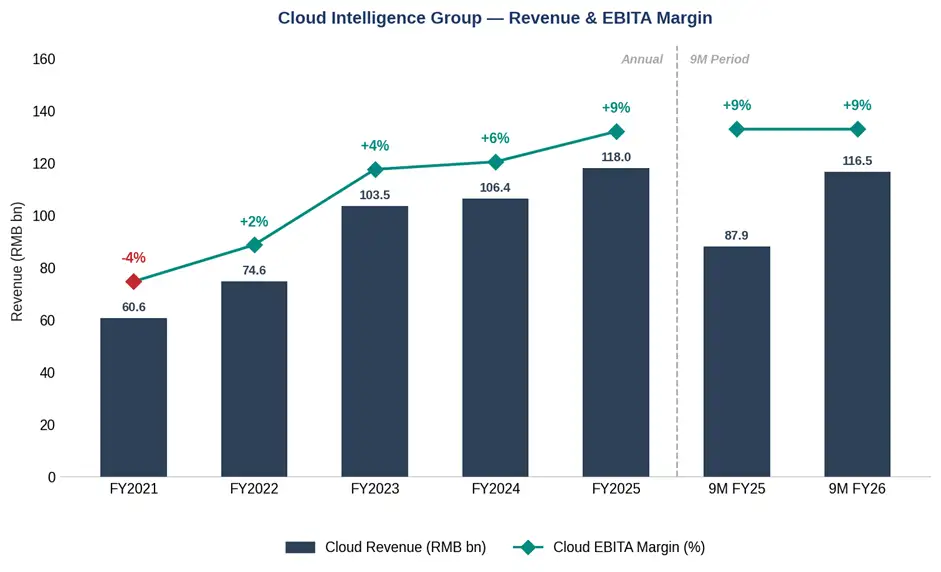
While China E-commerce provides the earnings floor, the Cloud Intelligence segment is emerging as the key driver of incremental growth. Revenue grew 32.5% YoY to RMB 116.5b in 9MFY26, with growth accelerating sequentially from 26% in 1QFY26 to 34% in 2Q and 36% in 3Q – an uncommon trajectory for a business of this scale. Notably, AI-related product revenue has delivered triple-digit YoY growth for 10 consecutive quarters and now contributes more than 20% of external cloud revenues.
Crucially for bondholders, this growth is translating into earnings. Adjusted EBITA increased 28.7% YoY to RMB 10.5b in 9MFY26, with margins holding steady at roughly 9%. The ability to scale while maintaining margin discipline underscores the segment’s potential to become a consistent and meaningful earnings contributor alongside China E-commerce.
Adoption metrics further reinforce this trajectory. The Qwen family of models surpassed 1 billion cumulative downloads as of January 2026, while the Qwen consumer app exceeded 300 million monthly active users by February 2026. Despite this traction, we believe the monetisation cycle remains in its early stages. As usage scales, inference-related revenue should grow faster than the underlying infrastructure cost curve, supporting gradual margin expansion. Alibaba Cloud’s market-leading position also provides structural support. Its full-stack AI ecosystem– spanning foundation models (Qwen), inference infrastructure, and enterprise deployment platforms (Model Studio, Platform for AI)–creates meaningful switching costs, strengthening customer retention while supporting both revenue and margin expansion.
Looking ahead, we expect Cloud Intelligence to become the group’s primary EBITA growth driver. Management has guided for sustained cloud revenue momentum, supported by increasing demand for model services, token consumption, and application-layer usage. Pricing is also expected to trend upward gradually through contract renewals and new customer wins. Taken together, we see scope for EBITA margins to expand from the current ~9% toward the low-teens, setting the stage for a structurally stronger and more diversified earnings profile.
Chart 3: Historical revenue growth for Cloud EBITA + increase in Cloud EBITA margin
Source: Company data, iFAST compilations.
Data as of 31 December 2025
Fortress balance sheet with ample liquidity and decent coverage
On the liquidity front, as of 31 December 2025, Alibaba holds RMB 128.2b in cash and RMB 180.0 b in short-term investments, amounting to a total available liquidity of RMB 308.2 billion. Against total borrowings of RMB 262.7b (including RMB 24.7b in short-term borrowings), this translates into a net cash position of RMB 45.5b, providing a meaningful buffer to support its ongoing investment cycle. As seen in Table 2 below, while the group’s net cash position has moderated in recent years due to rising capex, it remains firmly positive.
In terms of coverage, TTM interest coverage (adjusted EBITA / gross interest expense) stands at 10.3x (see table 2 below), indicating ample capacity to service its interest obligations. Notably, this level of coverage likely reflects a trough of the group’s adjusted EBITA, given the temporary pressure from elevated subsidy spending during the recent price war. As profitability in the China E-commerce segment normalises, we expect coverage to improve correspondingly.
On the cash flow front, TTM OCF came in at RMB 94.3b (9.3% margin), below historical averages (see chart 4 below). Looking ahead, we expect OCF to recover, supported by a reduction in subsidy intensity and stabilisation in core China e-commerce profitability.
Capex, however, has trended sharply higher, driven by investments in both quick commerce infrastructure and cloud capacity. While we expect capex to remain elevated–and potentially increase further in the near term–we believe Alibaba’s normalised OCF generation, together with its strong liquidity position, is sufficient to absorb these outlays. Government support, including subsidies covering up to 50% of qualifying data centre costs, should also help offset part of the investment burden.
Consequently, FCF is likely to remain under pressure in the near to intermediate term. Although FCF swung to an outflow of RMB 29.3b in 9MFY26, we expect this to be cyclical rather than structural. As OCF recovers, FCF should gradually revert to positive territory over the medium term. Our base case does not assume a sustained period of negative FCF, but rather a cyclical dip driven by capex investments.
Chart 4: Increasing capex pressuring Alibaba’s free cash flow generation
Source: Company data, iFAST compilations.
Data as of 31 December 2025
Table 2: Leverage & Credit metrics have moderated, but remain solid
|
Credit Metrics |
FY21 |
FY22 |
FY23 |
FY24 |
FY25 |
9MFY26 |
|
31 Mar 2021 |
31 Mar 2022 |
31 Mar 2023 |
31 Mar 2024 |
31 Mar 2025 |
31 Dec 2025 |
|
|
Interest Coverage Ratio (Adjusted EBITA / Gross Interest Cost) |
38x |
27x |
25x |
21x |
18x |
10.3x* |
|
Net Debt / EBITA |
NM** |
NM** |
NM** |
NM** |
NM** |
NM** |
|
* Figure is derived using TTM figures **NM: not material as Alibaba holds a net cash position Data as of 31 December 2025 Source: Company data, iFAST compilations. |
||||||
Bond recommendations
Table 3: About Alibaba's bonds
|
Issue |
Issuer |
Ask Price |
Yield to Worst (%) |
Years to Maturity |
Credit Rating (S&P / Moody’s / Fitch) |
|
Alibaba Group Holding Limited |
98.99 |
4.07% |
1.58 |
A+ / A1 / A |
|
|
Alibaba Group Holding Limited |
101.54 |
4.45% |
4.05 |
A+ / A1 / A |
|
|
Alibaba Group Holding Limited |
90.69 |
4.31% |
4.76 |
A+ / A1 / A |
|
|
Alibaba Group Holding Limited |
98.34 |
4.74% |
8.57 |
A+ / A1 / A |
|
|
Alibaba Group Holding Limited |
102.74 |
4.86% |
9.06 |
A+ / A1 / A |
|
|
Baidu Inc |
100.25 |
4.22% |
1.90 |
- / A3 / A |
|
|
Baidu Inc |
96.96 |
4.28% |
3.92 |
- / A3 / A |
|
|
JD.com, Inc. |
97.27 |
4.18% |
3.70 |
A- / A3 / - |
|
|
Kuaishou Technology |
98.77 |
4.42% |
4.71 |
A- / A3 / A- |
|
|
Kuaishou Technology |
97.36 |
5.10% |
9.72 |
A- / A3 / A- |
|
|
Meituan |
99.87 |
4.57% |
1.91 |
BBB+ / Baa1 / BBB+ |
|
|
Meituan |
92.55 |
4.93% |
4.48 |
BBB+ / Baa1 / BBB+ |
|
|
Meituan |
97.77 |
5.01% |
5.00 |
BBB+ / Baa1 / BBB+ |
|
|
Meituan |
97.91 |
5.41% |
9.50 |
BBB+ / Baa1 / BBB+ |
|
|
Tencent Holdings Limited |
99.24 |
4.06% |
1.70 |
A+ / A1 / A |
|
|
Tencent Holdings Limited |
93.32 |
4.19% |
4.08 |
A+ / A1 / A |
|
|
Tencent Holdings Limited |
94.16 |
4.20% |
4.96 |
A+ / A1 / A |
|
|
Weibo Corporation |
94.33 |
4.90% |
4.17 |
BBB / Baa2 / - |
|
|
Xiaomi Best Time International Limited |
96.02 |
4.48% |
3.98 |
BBB / Baa1 / BBB+ |
|
|
Xiaomi Best Time International Limited |
92.35 |
4.55% |
5.19 |
BBB / Baa1 / BBB+ |
|
|
Data as of 07 May 2026. Source: Bloomberg, Bondsupermart, iFAST compilations. |
|||||
Overall, Alibaba’s credit profile has softened because of the intense price war and increasing capex spend to grow its cloud and quick commerce segments. Looking ahead, regulatory relief should support a normalisation of China's e-commerce profitability, while increasing AI monetisation provides an additional tailwind – together, these factors should stabilise the group’s credit profile. That said, we emphasise that the planned increase in Capex spend should continue pressuring FCF. Overall, our base case for Alibaba’s credit profile is to stabilise moving forward.
As seen in Table 3 above, we compare Alibaba’s outstanding bonds against the comparable outstanding issues of its Chinese tech peers. In general, we find Alibaba’s bonds to be fairly priced. Against comparable US sovereigns of similar tenors, we highlight a decent 25-50+bps yield spread, given the strong A rating of both Alibaba and its bonds.
For investors looking for an alternative to US sovereigns, Alibaba’s outstanding bonds are a worthwhile consideration, given the improving operating outlook.
Declaration: For specific disclosure, at the time of publication of this report, IFPL (via its connected and associated entities) holds NIL positions, and the analyst who produced this report holds NIL positions in the abovementioned securities. This research report was prepared with the assistance of artificial intelligence (AI) tools. iFAST Financial Pte Ltd does not rely exclusively on AI for content generation; the content of this report – including all investment theses, ratings, price targets and conclusions – has been independently reviewed and verified by the research analyst(s) to ensure accuracy and professional integrity.