- Keppel Corporation showed a decent financial performance in 1H23. The Infrastructure segment was the key driver, helped by higher net generation and improved margins.
- We remain cautiously optimistic about Keppel’s “Vision 2030” plans. While it could give Keppel greater earnings visibility over the near term, it could also come with some near-term uncertainty involved with execution.
- While some of its credit metrics have weakened recently, we think its risk of default remains relatively low with its decent cash position and potential cashflows from ongoing asset monetisation initiatives.
- Within the SGD space, we prefer Keppel’s 2026 bonds for their relatively shorter tenor. Within the USD space, we think their 2025 bonds look fairly decent.
About Keppel Corporation Limited
Keppel Corporation Limited (KCL) is a conglomerate headquartered in Singapore, and operating in over 20 countries globally. It specialises in the real estate and infrastructure sectors, and operates three platforms under its horizontally-integrated model: fund management platform, investment platform, and operating platform.
Financial highlights (as of 1H23)
KCL reported its results for the first half ending in 30 Jun 2023 (1H23) a few months back, and provided a voluntary update for the nine months ending in 30 Sep 2023 (9M23) recently. These figures were reported under the company’s new horizontally-integrated model with four segments: Infrastructure, Real Estate, Connectivity, and Corporate Activities. (Note: Figures below are generally as of 1H23 unless otherwise stated.)
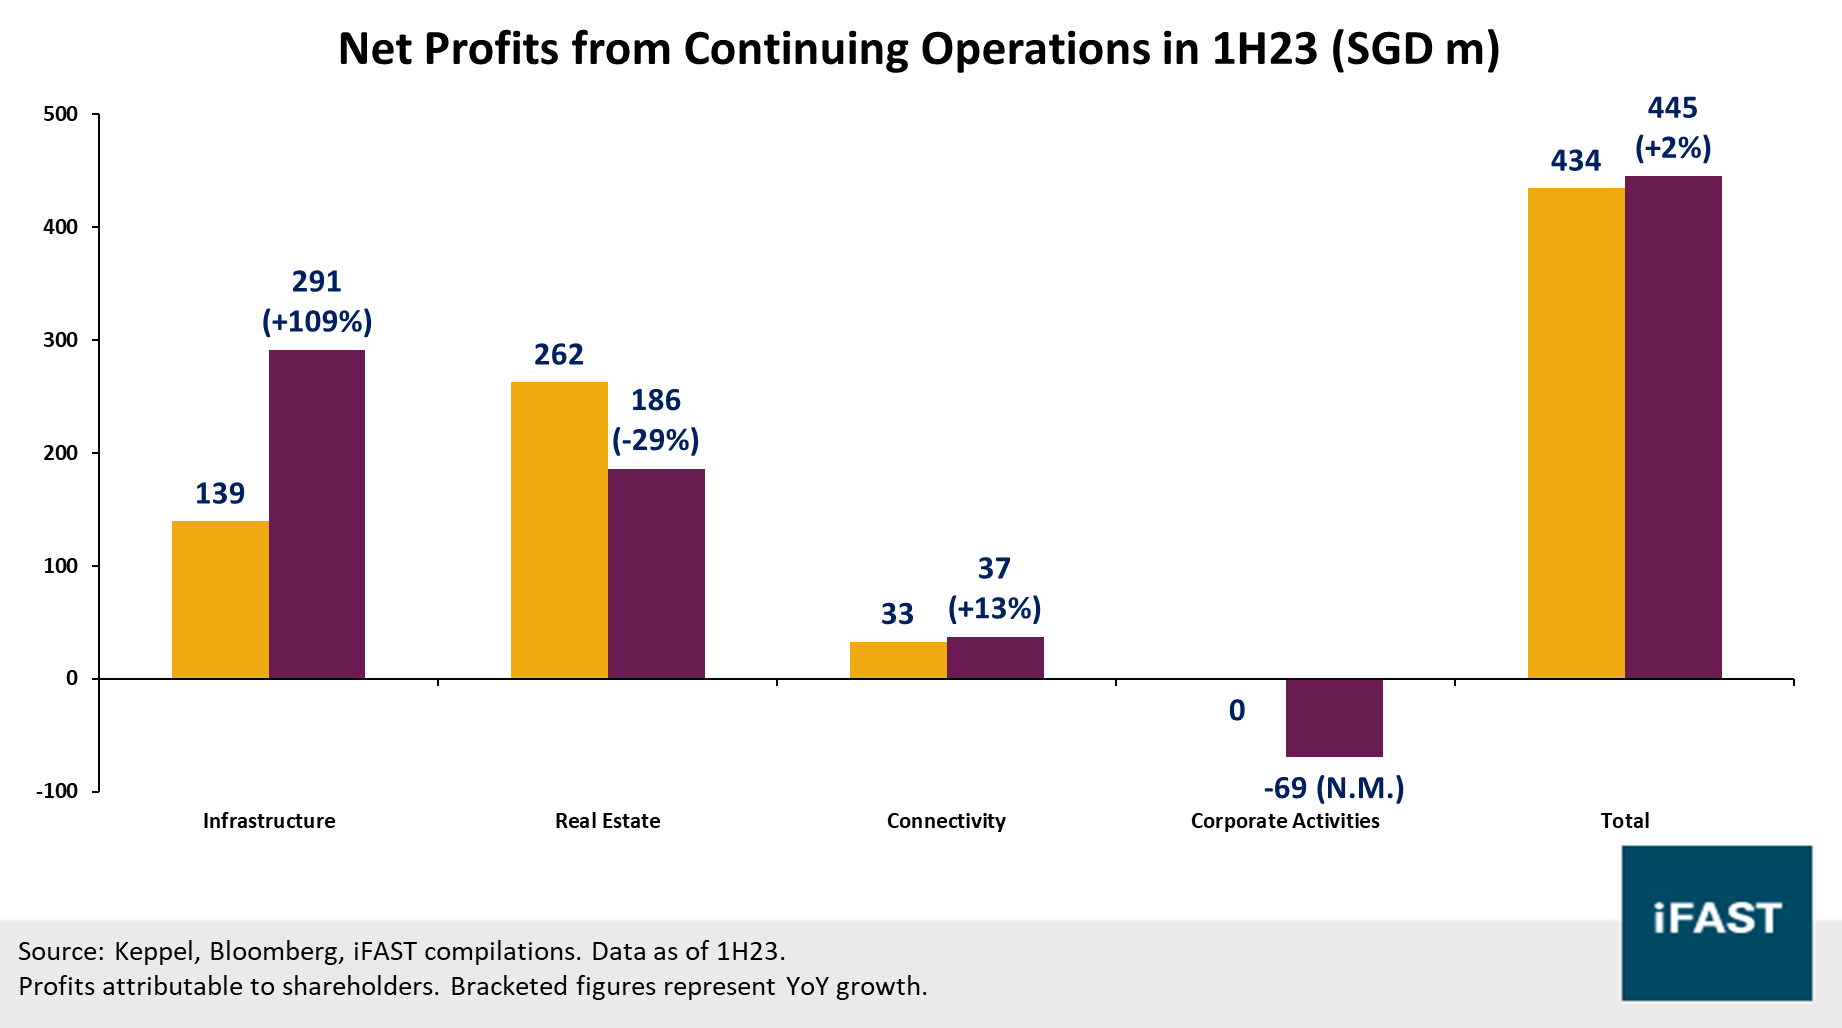
Looking at performance from continuing operations (i.e. excluding discontinued operations from Keppel O&M following its recent disposal), total revenues climbed by +11% YoY in 1H23, and by +5% YoY in 9M23 (Chart 1). While operating profits increased by a sizeable +61% YoY in 1H23, net profits attributable to shareholders rose by a much smaller extent (+2% YoY) in 1H23, weighed down by higher interest expenses as well as weaker results from associated companies and joint ventures (Chart 2). Generally speaking, the Infrastructure and Connectivity segments both saw decent growth, though this was offset by negative growth in the Real Estate segment.
We quickly summarise the key drivers of performance for KCL’s three key segments below (as of 1H23):
- Infrastructure: The Infrastructure segment saw higher revenues arising from higher electricity sales, and higher net profits from higher net generation and improved margins within its integrated power business. Operating income in this segment climbed from SGD 107m in 1H22 to SGD 303m in 1H23 (+183%), driving a similarly large increase in net profits (+109%).
- Real Estate: The Real Estate segment saw lower operating income primarily due to lower contributions from property trading projects in China and higher interest expenses, coupled with lower fair value gains on investment properties. As a whole, net profits fell by -29% YoY in 1H23 from SGD 262m to SGD 186m, representing a significant drag on KCL’s overall performance.
- Connectivity: Performance within the Connectivity segment was fairly stable, with the stronger performance from M1 offset by lower contributions from data centre and networks due to costs for new markets and initiatives. Net profits for this segment were reported at SGD 37m in 1H23, a slight increase from SGD 33m in 1H22.
As a whole, we find that its performance has remained fairly resilient despite headwinds from the Real Estate segment.
Chart 1: Revenues saw solid growth of +11%, led by Infrastructure and Connectivity
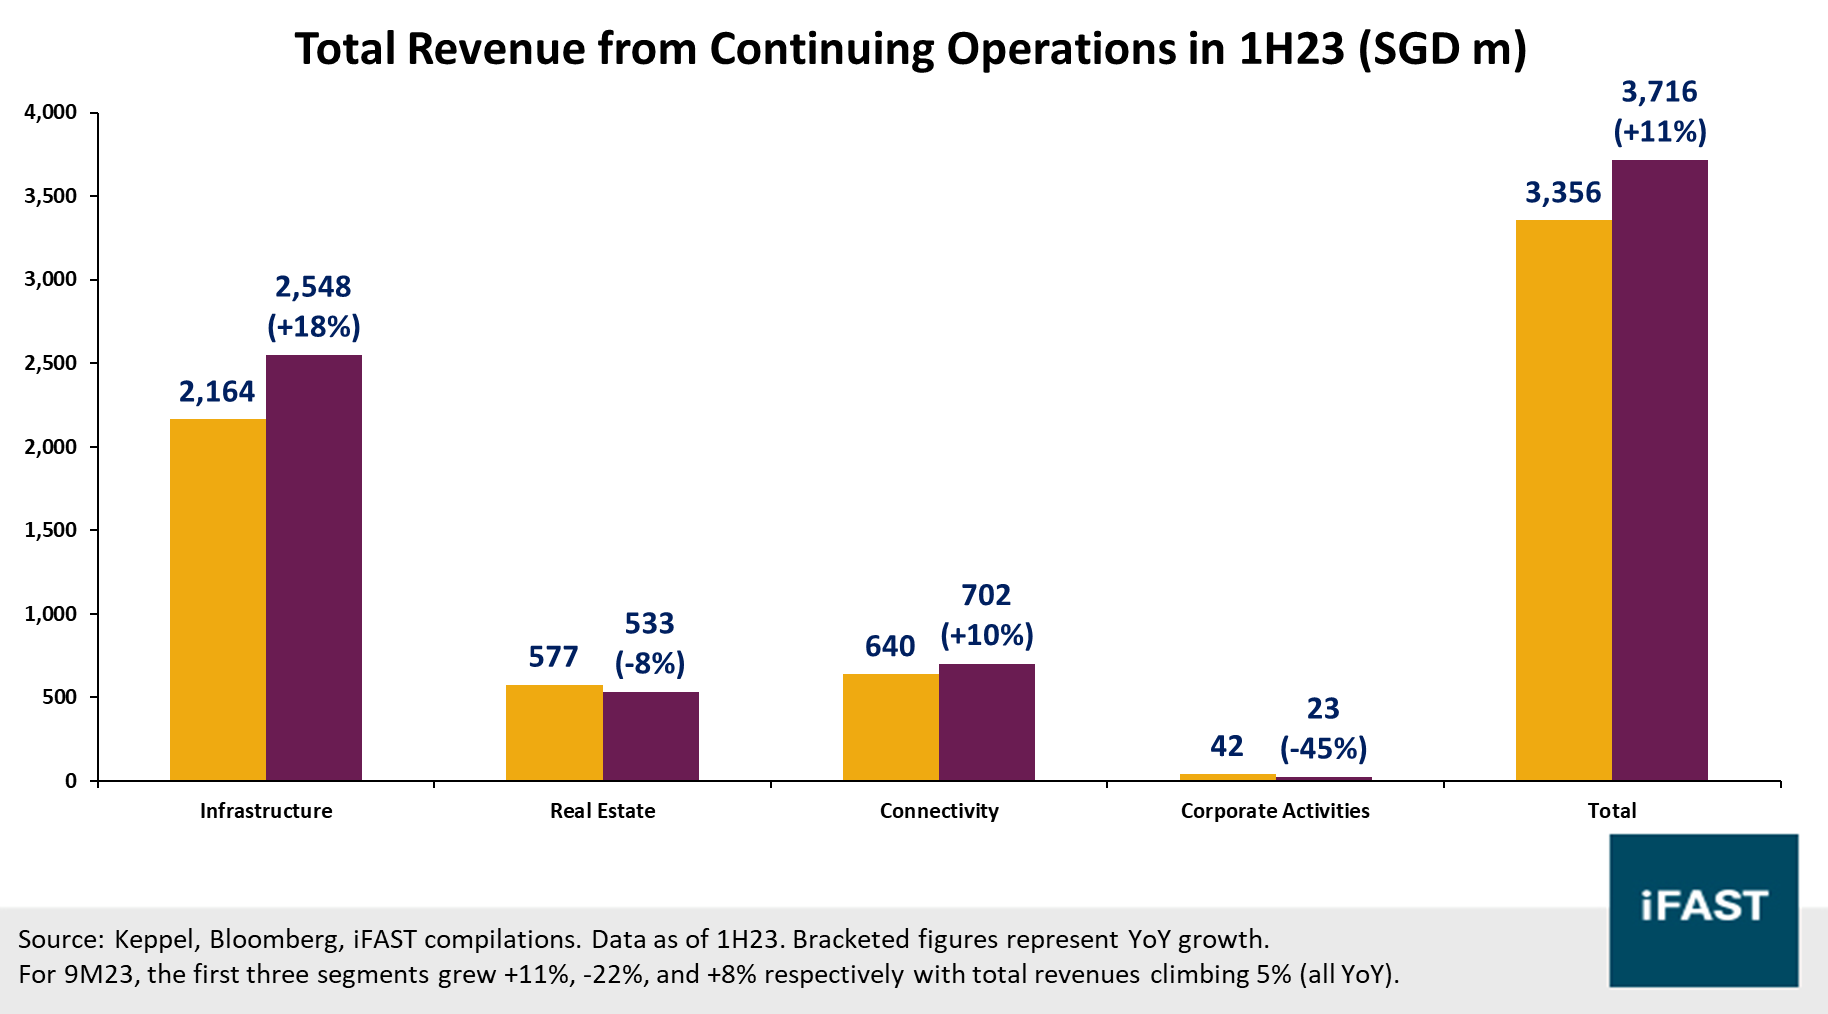
Chart 2: Net profits grew slightly, helped by strong performance in Infrastructure
“Vision 2030” – Keppel’s plans for the future
KCL recently announced in May 2023 that it would begin the next phase of its “Vision 2030” plan, turning the company from a conglomerate to become one horizontally-integrated company, and transforming into a global alternative real asset manager and operator.
One key theme across KCL’s recent sharings has been its growing focus on recurring income. Its recurring income was reported at SGD 340m in 1H23 (Chart 3), representing a large increase of +62% YoY (from SGD 210m in 1H22), most evident within the Infrastructure segment. In this segment, KCL has stated that 100% of its customers were locked in on fixed or indexed electricity price plans for the next two years and that it also had about SGD 4.1b in contract backlogs over the next 10-15 years (as of 30 Sep).
Another parallel theme has been its ongoing transition to a more asset-light model. On this front, KCL previously declared a target of SGD 10b to SGD 12b in asset monetisation by end-2026 (from Oct 2020) – nearing the halfway mark, KCL remains on track with about SGD 5.3b in monetisations as of 30 Sep 2023 (Table 1). This is particularly relevant for the Real Estate segment which traditionally tends to have more lumpy revenues; KCL reported that they have monetised about SGD 3b worth of Chinese real estate since 2017 (as of 1H23). Looking ahead, management has said they will look towards an increasingly asset-light model with recurring income such as Real Estate-as-a-Service solutions.
Despite the potential positives arising from this “Vision 2030” plan, we note that the execution of such a plan is subject to execution risks. For instance, its asset monetisation plans will be heavily dependent on the market environment and market demand for its assets. In addition, their long-term transition to new growth areas may involve additional capex and investments. As a whole, we are cautiously optimistic about this plan as it could potentially give KCL significantly more earnings stability and visibility over the long term, with the downside of some near-term uncertainty as KCL executes this plan.
Chart 3: KCL continues to grow its focus on recurring income, which grew substantially in 1H23
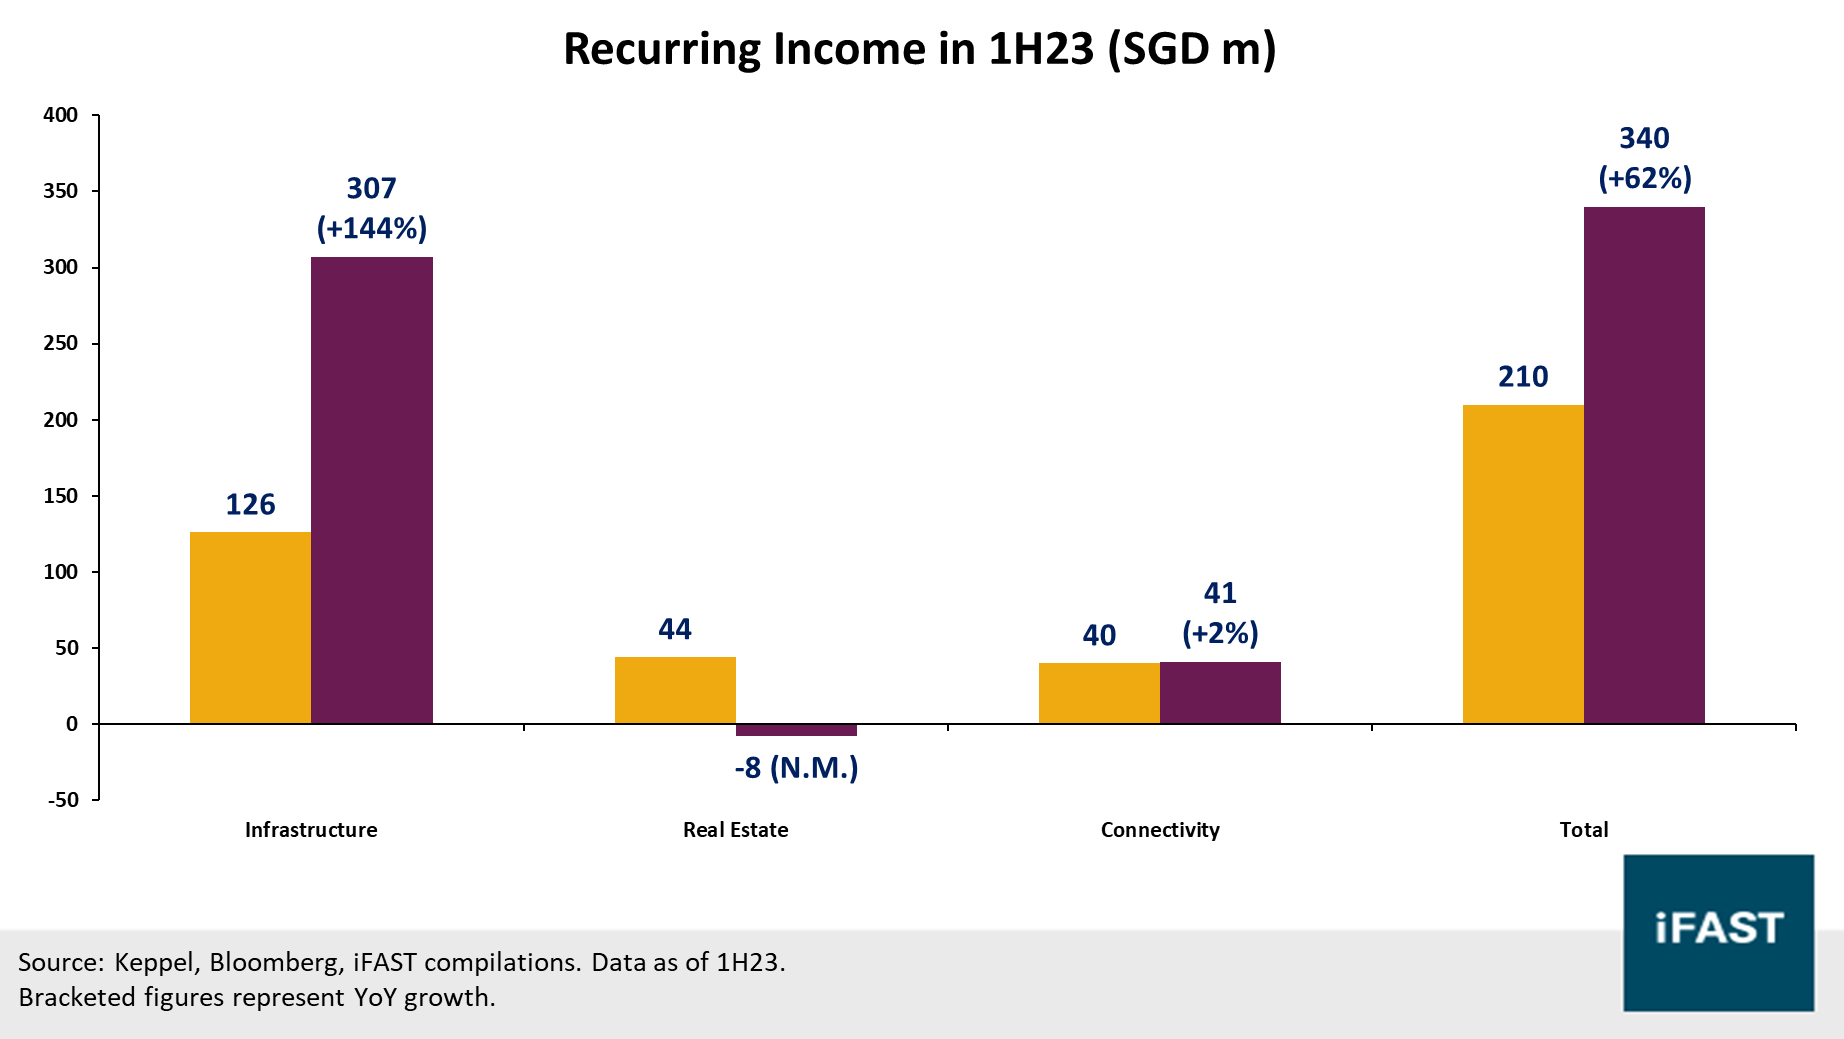
Table 1: KCL remains on track with its end-2026 asset monetisation target
| Keppel | Amount Monetised (SGD m) | Cumulative Amount (SGD m) | Percentage of Lower Bound Target of SGD 10b (%) |
| FY20 | 1,238.4 | 1,238.4 | 12% |
| FY21 | 1,666.2 | 2,904.6 | 29% |
| FY22 | 1,514.9 | 4,419.5 | 44% |
| 9M23 | 864.7 | 5,284.2 | 53% |
| Target | 10,000 - 12,000 | 100% | |
| Source: Keppel, Bloomberg, iFAST compilations. Data as of 9M23. | |||
Credit highlights
Looking at KCL’s various credit metrics as of 1H23 (Table 2), we find that both net-debt-to-total-assets and net-debt-to-equity (net gearing) have both increased to 35.7% and 85.8% respectively in 1H23, partly due to an increase in net debt levels, but also partly to the reduction in total assets and total equity following said disposal. For net gearing, management has further guided that it has increased to 89% as of 3Q23, though they will actively monitor to keep it below 100%.
On the other hand, we observe that a sizeable HoH growth in LTM (last twelve months) EBITDA has helped the company improve its net-debt-to-EBITDA ratio in 1H23, which is management’s preferred metric given its increasing focus on recurring earnings in its “Vision 2030” plan. Despite this increase in EBITDA, KCL’s interest coverage has nonetheless worsened to 4.6X due to the sharp increase in interest expenses amidst the rising-rates environment, though this ratio remains fairly decent and we do not foresee KCL having issues servicing its interest payments.
In terms of its debt profile (as of 1H23), management has guided that 65% of its borrowings are on fixed rates, with its borrowings having a weighted tenor of about 3 years (SGD 2.4b [22%] due within 1 year). Management has also disclosed its average interest cost at about 3.53% - given the rising-rates environment, we expect this to continue increasing over time as KCL gradually refinances its ongoing borrowings.
As a whole, we acknowledge KCL’s credit metrics appear to have weakened over time partially due to some distortion from the disposal of Keppel O&M, and also due to rising interest expenses. Nonetheless, its decent cash position (SGD 1.3b) relative to its near-term borrowings (SGD 2.4b as above), coupled with potential cashflows from the ongoing asset monetisation initiative in “Vision 2030”, should mean that Keppel’s risk of default remains relatively low.
Table 2: KCL’s credit metrics have worsened slightly from FY22 to 1H23
| Keppel's Credit Metrics | FY22 | 1H23 |
| Net Debt (SGD m) [A] | 9,237.6 | 9,848.2 |
| Total Assets (SGD m) [B] | 31,065.0 | 27,621.7 |
| Net Debt / Total Assets (%) [A/B] | 29.7% | 35.7% |
| Total Equity (SGD m) [C] | 11,913.3 | 11,483.7 |
| Gearing, or Net Debt / Equity (%) [A/C]* | 77.5% | 85.8% |
| LTM EBITDA (SGD m) [D]** | 772.0 | 987.5 |
| Net Debt / LTM EBITDA (X) [A/D]** | 11.97 | 9.97 |
| LTM Interest Expense (SGD m) [E] | 146.2 | 216.0 |
| Interest Coverage Ratio (X) [D/E]** | 5.28 | 4.57 |
| Source: Keppel, Bloomberg, iFAST compilations,
iFAST estimates. Data as of 1H23. *Net gearing ratio was 89% as of 3Q23 (30 Sep). Management is actively monitoring to keep it below 100%. **From continuing operations. 1H23 figure is our estimate based on reported operating profits. For illustration only as "continuing operations" may change over time. |
||
Our view on KEPSP bonds
To summarise, we are cautiously optimistic about KCL’s profitability outlook, with “Vision 2030” potentially giving the company new growth engines over the long term (despite near-term uncertainty over its execution). We also think KCL should have no issue refinancing its debt even in a rising-rates environment, especially if ongoing asset monetisation schemes help to bolster cash flows in the coming years.
We look at several bonds issued by KCL (Table 3) – our preference among these is for their KEPSP 3.000% 01Oct2026 Corp (SGD) and KEPSP 2.459% 04Jun2025 Corp (USD) bonds (depending on your preferred currency).
- While KCL has multiple SGD bonds outstanding, we prefer their 2026 bonds over the 2029 and 2042 bonds for their relatively shorter tenor; we think the 2029 and 2042 bonds provide relatively meagre yield pickups for their substantially larger maturity and duration risks.
- We also highlight that KCL has 2.9% perpetuals outstanding as well, with the next reset in about 3 years (their call date is earlier [about 1 year] but we don’t expect them to call immediately on their call date given the likely higher refinancing rate). Similarly, we prefer the 2026 bonds over the 2.9% perpetuals given the non-call risks embedded in these perpetuals.
Table 3: List of Keppel Corporation Limited bonds (recommendations bolded)
| Bond Name | Call / Maturity Date (Years to Call / Maturity) |
Ask Price | Current Yield (%) | Yield to Call / Maturity (%) |
| KEPSP 3.000% 01Oct2026 Corp (SGD) |
01 Oct 2026 (2.9) |
97.094 | 3.09% | 4.07% |
| KEPSP 3.660% 07May2029 Corp (SGD) |
07 May 2029 (5.5) |
97.753 | 3.74% | 4.12% |
| KEPSP 4.000% 07Sep2042 Corp (SGD) |
07 Sep 2032 / 07 Sep 2042 (8.9 / 18.9) |
98.653 | 4.05% | 4.35% / 4.20% |
| KEPSP 2.459% 04Jun2025 Corp (USD) |
04 Jun 2025 (1.6) |
95.048 | 2.59% | 5.76% |
| Source: Bloomberg, Bondsupermart, iFAST compilations. Data as of 30 Oct 2023. | ||||
Declaration: For specific disclosure, at the time of publication of this report, IFPL (via its connected and associated entities) holds a position in KEPSP 2.900% Perpetual Corp (SGD). The analyst who produced this report holds a NIL position in the abovementioned securities.
Our podcast series, Yield Hunters, is available on Spotify, iTunes Podcasts and Google Podcasts. We share our thoughts on new bond issues and hold discussions on the fixed income space. Listen to our latest episode below and follow us!