• Core franchise still strong, headline profit misleading: Revenue rose 26% YoY to USD 64.6 billion. Reported operating income fell 37% YoY after a USD 9.9 billion legal settlement charge. Excluding it, operating income grew 11% YoY to USD 22.9 billion.
• Free cash flow has turned negative: Capex of USD 35.0 billion exceeded operating cash flow of USD 32.8 billion, leaving free cash flow of USD (2.2) billion (3Q25: USD 9.9 billion). Guidance implies a fourth-quarter capex bill of USD 49.2 billion to USD 59.2 billion.
• Equity raise is the bondholder’s friend: USD 37.5 billion of common and preferred stock is priced, with up to USD 60.0 billion more planned. This provides fresh funding for its AI build-out without further straining the balance sheet.
• Off-balance-sheet stack is the key watch point: Signed leases and contractual commitments rose 28% in one quarter to about USD 825.0 billion.
• About the bonds: We maintain our decent credit view and continue to like META’s 2035 USD issue.
After its 2Q26 (ending 30 June 2026) results, we flagged that Meta’s capital expenditure (capex) ramp was squeezing free cash flow (FCF). Meta has since reported results for the quarter ending 30 September 2026 (3Q26) and, days later, launched one of the largest equity raises on record. We examine what both mean for bondholders.
Related articles:
Credit Update: META offers 5+% to 6+% yields (USD) while it ramps up its AI monetisation.
Credit Update: META’s capex ramp accelerates, cash flow compresses
A USD 9.9 billion legal charge hides an advertising engine that is still running hot
Meta saw topline growth of +26% year on year (YoY) to USD 64.6 billion for 3Q26. However, operating income fell 37% YoY to USD 13.0 billion (3Q25: USD 20.5 billion), halving operating margin to 20% (3Q25: 40%). That said, we would not take this at face value. Costs included a USD 9.9 billion charge for Meta’s settlement with US state attorneys general over teen mental health litigation. Excluding it, operating income rose 11% YoY to USD 22.9 billion, a 35% margin. EBITDA (operating income before depreciation and amortisation) tells a similar story. Reported EBITDA fell 21% YoY to USD 20.1 billion (3Q25: USD 25.5 billion) but excluding the charge it rose 18% YoY to USD 30.0 billion, a 46% margin (3Q25: 50%). While margins are a few percentage points below last year’s, we remain comfortable with the profitability of Meta’s core business. Net income, meanwhile, is distorted in the opposite direction. Its 264% YoY jump to USD 9.9 billion largely reflects a low base: 3Q25 profit was weighed down by a one-off USD 15.9 billion tax charge.
Underneath, the Family of Apps (FoA) segment remains in excellent health. FoA revenue grew 26% YoY to USD 64.2 billion, as ad impressions rose 10% and the average price per ad rose 14%. Daily active people (DAP) reached 3.64 billion (3Q25: 3.54 billion), and average revenue per person rose 23% YoY to USD 17.72. Building on this, non-advertising revenue, mainly WhatsApp paid messaging and subscriptions, grew 59% YoY to USD 1.1 billion. Crucially for bondholders, this FoA segment is the engine that services Meta’s debt, and we are encouraged that it remains robust.
That said, costs are still outpacing revenue. Excluding the legal charge, expenses rose 36% YoY to USD 41.7 billion, driven by depreciation, cloud spend and AI token costs, while Reality Labs (RL) lost a further USD 4.1 billion. Encouragingly, management expects those RL losses to narrow to around USD 15 billion in 2027 (FY26 guidance: USD 18 billion to USD 19 billion).
Looking ahead, management remains upbeat. According to them, AI is “already delivering substantial incremental advertising revenue” and expects “strong overall revenue growth throughout 2027” as new AI products such as Meta One subscriptions and the Muse personal agent begin to contribute. Overall, management still expects FY26 operating income, excluding the charge, to beat FY25’s USD 83.3 billion. We would caution, however, that this assumes no further legal charges. The settlement allows for payments of up to USD 18.6 billion, of which only USD 9.9 billion has been expensed so far, and more youth-related trials are scheduled.
Free cash flow turned negative for the first time in over a decade
Operating cash flow (OCF) rose 9% YoY to USD 32.8 billion, but capex (including finance lease payments and acquisitions) jumped 74% YoY to USD 35.0 billion. As seen in Chart 1 below, free cash flow (FCF) fell to USD (2.2) billion (3Q25: USD 9.9 billion).
Moving forward, we expect FCF to turn materially more negative in 4Q26. Management raised the lower end of its FY26 capex guidance to USD 135 billion, from USD 130 billion at 2Q26, while keeping the upper end at USD 145 billion. This signals that spending is tracking towards the top of the range rather than easing. With USD 85.8 billion already spent in the first nine months of 2026, the guidance implies USD 49.2 billion to USD 59.2 billion in 4Q26 alone. This represents a 41% to 70% sequential increase over 3Q26’s USD 34.9 billion. We think this trend of negative FCF is likely to persist over the foreseeable future as Meta continues to invest in its AI capabilities.
Chart 1: OCF has plateaued while capex keeps climbing, pushing FCF below zero
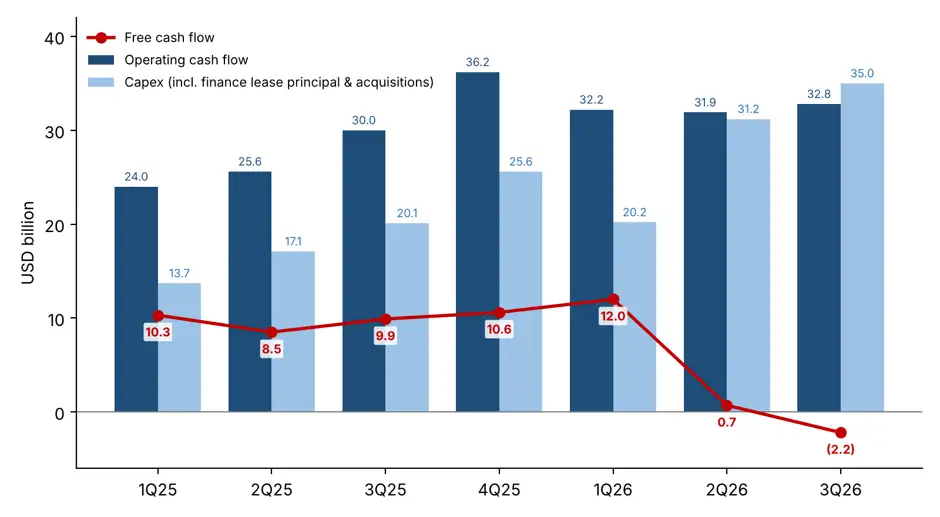
Data as of 30 September 2026. FCF = OCF less purchases of property and equipment, acquisitions of businesses and intangibles, and finance lease principal payments.
Source: Company data, iFAST compilations.
Liquidity is ample and near-term maturities are small, so refinancing is not the issue
With FCF negative, the question for bondholders becomes how the build-out is funded. In 3Q26, the answer was the cash pile: cash and short-term marketable securities fell to USD 82.4 billion (2Q26: USD 90.3 billion).
Against this, debt maturities are small. Of USD 83.7 billion of total bonds outstanding, only about USD 2.8 billion is due within the next 12 months, with the rest staggered over roughly 40 years. As a result, we see minimal near-term refinancing risk. The real funding gap is 4Q26 capex, which is where the equity raise comes in.
The equity raise of up to USD 97.5 billion is a credit-positive way to fund the gap.
On 26 October 2026, Meta launched an equity raise of up to USD 95 billion, upsized at pricing to up to USD 97.5 billion, in three parts. First, USD 12.5 billion of 6.50% mandatory convertible preferred stock, which converts into shares in August 2029, with cash on closing on 29 October. Second, USD 25.0 billion of common stock at USD 625.00 per share sold through forward agreements. Think of this as locking in today’s price but collecting the money later, by 19 November 2027 at the latest. Third, an at-the-market programme of up to USD 60.0 billion, selling shares gradually from 1Q27 once the new non-voting Class C shares trade.
Crucially, the committed USD 37.5 billion should substantially help to finance Meta’s AI build-out without further straining its balance sheet. Investor demand was also strong: both offerings were oversubscribed, and the common stock tranche was upsized to USD 25.0 billion from USD 22.5 billion. Crucially for bondholders, this shows Meta can tap the equity market at scale, giving it a second funding source beyond bonds and reducing the need to borrow for future capex. We would qualify this, however: only the preferred cash of USD 12.5 billion arrives now. The USD 25.0 billion of common stock will be received when Meta settles the forward sale, by November 2027 at the latest, and the USD 60.0 billion at-the-market programme depends on market conditions in 2027.
Leverage is still low with comfortable coverage, but the off-balance-sheet stack keeps growing
Leverage remains modest. Net debt (total debt including operating leases, less cash and marketable securities) rose to USD 32.4 billion. As seen in Table 1 below, net debt/total equity edged up to 11.9% (2Q26: 8.4%) and net debt/ TTM EBITDA (trailing twelve months) to 0.31x (2Q26: 0.20x). Likewise, although softening from 2Q26, interest coverage (TTM EBITDA / interest expense) remains comfortable at 38.9x.
Table 1: Leverage and coverage have softened but remain comfortable
|
Key Credit Metrics |
2Q26 (30 June 2026) |
3Q26 (30 September 2026) |
|
Net debt / total equity |
8.4% |
11.9% |
|
Net debt / TTM EBITDA |
0.20x |
0.31x |
|
Interest coverage ratio (TTM EBITDA / TTM interest expense) |
54.1x |
38.9x |
|
Data as of 30 September 2026. Source: Company data, iFAST Compilations. |
||
The bigger picture sits off the balance sheet. As Table 2 below shows, Meta’s total commitments reached about USD 825.0 billion at 3Q26 (2Q26: USD 643.0 billion), up 28% in a single quarter, although part of the increase may reflect reclassification. The bulk comes from signed data centre leases yet to start at USD 355.7 billion (2Q26: USD 279.0 billion), and non-cancellable commitments, mainly cloud capacity, servers and energy contracts, at USD 454.5 billion (2Q26: USD 349.3 billion). The remaining USD 14.7 billion is contingent cloud purchases, unchanged from 2Q26. Separately, Meta’s maximum exposure to its data centre joint ventures rose 49% to USD 68.4 billion (2Q26: USD 46.0 billion), as a second venture in Texas joined Hyperion in Louisiana. This includes a USD 41.5 billion residual value guarantee, which Meta currently judges unlikely to be called.
These are not debt in accounting terms, but they are real cash obligations, and they are front-loaded. About USD 45.9 billion of the non-cancellable commitments fall due in the rest of 2026 and a further USD 121.4 billion in 2027. Put differently, even the full USD 97.5 billion equity raise would cover only part of what Meta has already signed up to pay over the next 15 months. That said, these payments will largely be met from operating cash flow, which totalled about USD 133 billion over the past year. As bondholders, we therefore read the raise as a valuable cushion rather than a solution, and the pace at which these commitments keep growing remains our key watch point.
Table 2: Off-balance-sheet commitments rose 28.3% from 2Q26 to 3Q26
|
Item (USD billion) |
30 June 2026 (2Q26) |
30 September 2026 (3Q26) |
QoQ change |
|
Leases not yet commenced |
279.0 |
355.7 |
+27.5% |
|
Non-cancellable contractual commitments |
349.3 |
454.5 |
+30.1% |
|
Contingent cloud purchases |
14.7 |
14.7 |
- |
|
Total Commitments |
643.0 |
825.0 |
+28.3% |
|
Non-cancellable commitments due in 2027 |
81.7 |
121.4 |
+48.7% |
|
Maximum exposure to data centre joint ventures (JVs) |
46.0 |
68.4 |
+48.6% |
|
Data as of 30 September 2026. Source: Company data, iFAST Compilations. |
|||
Overall, Meta’s credit profile softened further this quarter. That said, its advertising business remains one of the strongest cash generators around and funding the build-out with equity rather than bonds is exactly what bondholders want to see. We therefore maintain our view of a decent credit profile.
Meta’s USD bonds yield 5.48% to 7.02% across the 2031s to the 2045s. Compared with higher-rated technology peers (see Table 3 below), they offer a yield pickup of 10+bp to 90+bp, with the pickup widening at longer tenors. Oracle’s bonds yield more, but this reflects its softer BBB-range credit profile. Against comparable US Treasuries, these issues offer a yield spread ranging from 65 bp to 188 bp.
We continue to prefer META 4.875% 15Nov2035 Corp (USD), which yields 6.12% with about 9.1 years to maturity, a spread of 115 bp over comparable US Treasuries and a pickup of 30+bp to 90+bp over Amazon, Alphabet and Microsoft.
Investors can also access META 4.550% 15May2031 Corp (USD) and META 5.500% 15Nov2045 Corp (USD) on Bondsupermart Live, from a minimum of US$1,000 in increments of US$1,000. The 2031s yield 5.48% with far less sensitivity to interest-rate moves, suiting more conservative investors. The 2045s offer a higher 7.02% yield but carry significant duration risk, as their price can fall sharply if interest rates rise, a risk that Meta’s credit strength cannot offset.
Investors who want income from a household name and accept that Meta’s commitments will keep growing can consider the 2035s, which we think offer an attractive pickup for an AI-related name.
Table 3: Meta’s bonds against comparable-tenor US tech peers
|
Issue |
Issuer |
Ask Price |
Yield to Worst |
Years to Maturity |
Rating (S&P / Moody’s / Fitch) |
|
Meta Platforms, Inc. |
96.30 |
5.48% |
4.55 |
AA- / Aa3 / - |
|
|
Meta Platforms, Inc. |
91.46 |
6.12% |
9.05 |
AA- / Aa3 / - |
|
|
Meta Platforms, Inc. |
84.14 |
7.02% |
19.06 |
AA- / Aa3 / - |
|
|
Amazon.com, Inc. |
91.87 |
5.34% |
5.46 |
AA / A1 / AA- |
|
|
AMZN 4.650% 20Nov2035 Corp (USD) |
Amazon.com, Inc. |
92.22 |
5.76% |
9.06 |
AA / A1 / AA- |
|
Alphabet Inc. |
97.93 |
5.37% |
4.80 |
AA+ / Aa2 / - |
|
|
Alphabet Inc. |
93.07 |
5.53% |
8.55 |
AA+ / Aa2 / - |
|
|
Microsoft Corp |
93.18 |
5.16% |
9.02 |
AAA / Aaa / - |
|
|
Oracle Corp |
91.98 |
7.16% |
4.27 |
BBB- / Baa2 / BBB |
|
|
Oracle Corp |
84.64 |
7.60% |
8.92 |
BBB- / Baa2 / BBB |
|
|
Data as of 28 October 2026. Source: Bloomberg, Bondsupermart, iFAST Compilations. |
|||||
Declaration: For specific disclosure, at the time of publication of this report, IFPL (via its connected and associated entities) holds positions in META 5.500% 15Nov2045 Corp (USD), GOOGL 4.500% 15May2035 Corp (USD), ORCL 4.950% 04Feb2031 Corp (USD), and the analyst who produced this report holds NIL positions in the abovementioned securities. This research report was prepared with the assistance of artificial intelligence (AI) tools. iFAST Financial Pte Ltd does not rely exclusively on AI for content generation; the content of this report – including all investment theses, ratings, price targets and conclusions – has been independently reviewed and verified by the research analyst(s) to ensure accuracy and professional integrity.