• Steady earnings recovery since FY2022 trough: Group EBITDA has turned positive and consistently trended higher, reaching JPY 464.7b on a TTM basis as of 1Q2026.
• Diversified interconnected ecosystem: Earnings stability has historically been anchored by e-commerce and FinTech, contributing an average of JPY 121.5b and JPY 190.1b over the past 5 years, respectively.
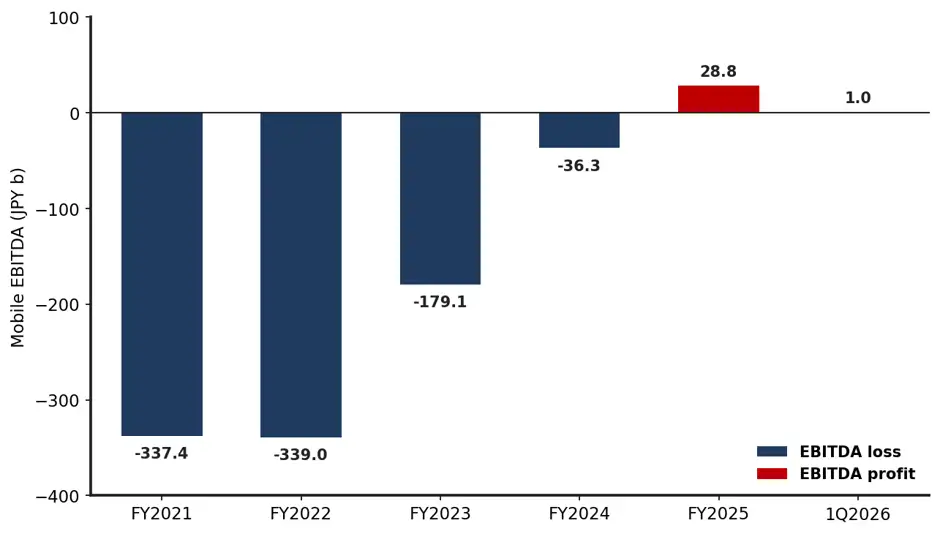
• Mobile segment has been the single largest driver of earnings recovery: EBITDA moved from a loss of JPY 339.0b in FY2022 to a positive JPY 36.3b on a TTM basis as of 1Q2026.
• Credit Profile has strengthened with interest coverage steadily improving since FY2023, alongside a healthy decline in leverage.
• About the outstanding bonds: Rakuten’s short-dated bonds (0.5y – 2.7y) present attractive income for a sub-investment grade issuer who has seen an improvement in its credit profile.
Group Profile
Rakuten Group, Inc. is a Japan-based internet conglomerate operating across three segments: Internet Services, FinTech and Mobile. Internet Services centres on Rakuten Ichiba, Japan's largest e-commerce marketplace, alongside Rakuten Travel and a broader portfolio of digital services. FinTech comprises Rakuten Card, Rakuten Bank, Rakuten Securities, Rakuten Payment and Rakuten Insurance — together Japan's largest online financial ecosystem. Mobile houses Rakuten Mobile, the Group's mobile network operator, and Rakuten Symphony, its telecom infrastructure and software business. All three segments are bound together by a shared Rakuten ID and points programme: as of March 2026, Rakuten counted 45.88 million monthly active users in Japan, with 77.1% of members using two or more Rakuten services.
1Q2026 results highlight Rakuten’s resilient earnings trajectory
For the quarter ending 31 March 2026 (1Q2026), Rakuten saw a 14.4% increase in topline to JPY 643.6b, on the back of broad-based growth across all three segments — Internet Services (+4.0% YoY), FinTech (+23.1% YoY), and Mobile (+18.5% YoY). This flowed through to profitability: Group EBITDA rose 36.2% YoY to JPY108.8b, the strongest first-quarter result since Rakuten's full-scale entry into the mobile network business, while the net loss attributable to owners narrowed to JPY18.6b, an improvement of JPY54.8b YoY.
Operating cash flow (OCF) was an outflow of JPY487.1b, an improvement JPY250.7b YoY. Capital expenditure (capex) rose to JPY71.1b (+29.6% YoY), largely reflecting Mobile's network build-out. Free cash flow (FCF) was an outflow of JPY558.2b, JPY234.4b better than a year earlier.
We caution against reading the headline OCF outflow as operational weakness. Rakuten’s consolidated OCF is heavily distorted by balance-sheet movements within its banking and finance businesses – Rakuten Bank’s deposit-taking and lending, and Rakuten Securities’ client asset flows, which can swing the headline figure significantly without reflecting the health of the underlying business. Stripping these items out, 1Q2026 adjusted OCF (before working capital) of JPY84.7b presents a cleaner read on the group’s core cash generation.
Segment Highlights
By segment, Internet Services' revenue grew on resilient demand from Rakuten Ichiba and Travel, up 4.0% YoY to JPY 317.6b, while EBITDA grew faster (+28.1% YoY) to JPY 29.5b on cost discipline, logistics profitability gains, and the exit of a loss-making streaming service, rather than on pricing, since take rate actually dipped slightly as Rakuten Mart withdrew from the Kansai region.
FinTech's revenue grew 23.1% YoY to JPY 275.3b, in part due to macro and partly due to structural: Bank of Japan rate hikes lifted interest income at Rakuten Bank and Rakuten Securities, the latter also boosted by NISA-driven account growth to a record quarter, while Rakuten Card grew through a larger cardholder base and higher spend per customer, taking segment EBITDA up 26.9% YoY to JPY 76.1b.
Mobile's revenue growth (up 18.5% to JPY 131.2b) came from subscriber additions during the peak spring sales season and improved churn following new anti-fraud and activation-fee measures rather than from average price per user (ARPU), which was roughly flat, and EBITDA improved JPY7.6b YoY to a positive JPY1.0b.
Outlook: Stable performances from internet services and FinTech, scope for improvement from Mobile
Looking ahead, we expect Rakuten’s latest operating performance to broadly persist through FY2026, though with differing degrees of durability. Internet Services should remain a key contributor to the group’s overall EBITDA, though EBITDA growth itself may moderate as the comparison no longer benefits from restructuring costs in 1Q2026. FinTech should see modest improvements as the Bank of Japan (BOJ) is expected to remain on its hiking path, as well as continued customer growth, though earnings are likely to remain tied to the BOJ’s actual rate trajectory. Finally, we expect the mobile segment to continue its positive contribution to EBITDA generation as the segment captures more subscribers across Japan, though the impact on FCF might be muted due to plans to accelerate capex from 2Q2026.
Diversified interconnected ecosystem of Internet Services and FinTech to continue anchoring Rakuten’s earnings base
Rakuten’s earnings base is primarily reinforced by the structural feature connecting its two largest, most established segments. Internet Services and FinTech share a single Rakuten ID and points programme, such that transaction activity in one segment routinely generates revenue in the other. Rakuten Card and Rakuten Pay are the default payment methods across Rakuten Ichiba and Rakuten Travel, while points earned on e-commerce purchases can be spent, saved, or invested across Rakuten Bank and Rakuten Securities. We believe this loop helps support customer activity and the resulting earnings inside the ecosystem. As of 31 March 2026 (1Q2026), 77.1% of Rakuten’s 45.88m monthly active users (MAUs) in Japan engage with two or more Rakuten services, further strengthening this flywheel effect.
This interconnection shows up directly in the numbers. Domestic advertising revenue (substantially generated from transaction and behavioural data captured across Rakuten Ichiba and Travel, then monetised through a shared advertising platform) grew 13.0% YoY to JPY61.9b in 1Q2026. On the FinTech side, management has attributed growth at Rakuten Securities and Rakuten Bank to a rising internal “membership value” metric, evidencing that FinTech engagement reinforces, rather than competes with, the broader ecosystem.
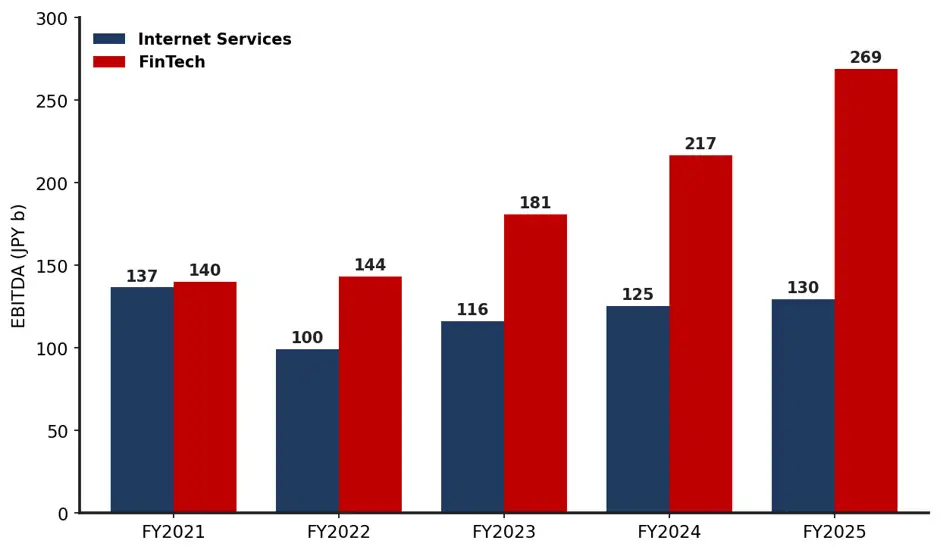
We believe that this interconnection helps partially explain why both segments generate consistently positive EBITDA over the last five years (see Chart 1 below); Internet Services generated an average EBITDA of JPY 121.5b from FY21 to FY25, while FinTech generated an average EBITDA of JPY 190.1b during the same time. We think this consistency is crucial in helping Rakuten to sustain the losses from its mobile segment, while providing coverage for the group’s interest obligations.
Chart 1: 5Y EBITDA of Internet Services & FinTech
Data as of 31 December 2025
Source: Company data, iFAST Compilations.
Resilient domestic ecommerce forms the bedrock for Internet Services earnings
Domestic ecommerce (EC) is the anchor of Internet Services (~78% of the segment’s revenue as of 1Q2026), with both volume and monetisation trending upward. As seen in Chart 2 below, gross merchandise sales (GMS) dipped 1.5% in FY2024 before recovering 3.9% in FY2025 and accelerating to +4.8% YoY in 1Q2026, while take rate has climbed from 15.0% in FY2023 to 16.1% in FY2025, as higher-margin advertising and service revenue outgrows the underlying transaction volume.
Importantly for bondholders, the segment is growing more profitable: while internet services revenue rose 4.0% YoY to JPY 317.6b in 1Q2026, EBITDA leapt 28.1% YoY to JPY 29.5b, leaving the TTM EBITDA of JPY 135.7b within touching distance of FY2021’s record high. Management attributes the improvement to cost discipline alongside the narrowing of losses in the growth investment businesses (aided by logistics profitability initiatives and the termination of a loss-making streaming service). With those loss-making units still shrinking, we see room for further margin gains without requiring GMS to accelerate. Consequently, we expect Internet Services to remain one of Rakuten’s more reliable earnings generators, which should support the group’s debt servicing capacity.
Chart 2: GMS + Take Rate over the years
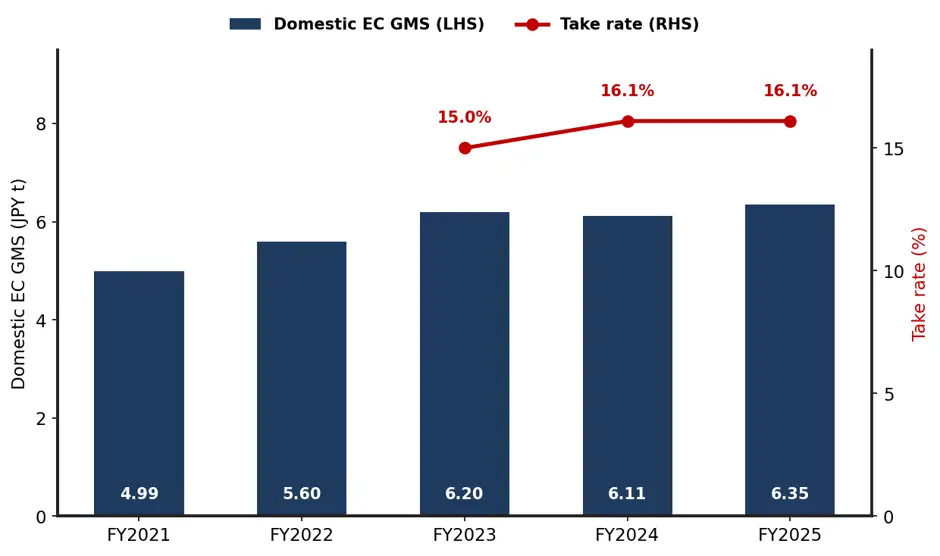
* Take rate was only disclosed from FY2023 onwards
Data as of 31 December 2025
Source: Company data, iFAST Compilations.
FinTech is the largest EBITDA contributor for Rakuten
FinTech is Rakuten’s largest consistent earnings engine by EBITDA, with three main sub-segments: 1) Rakuten Card, 2) Rakuten Bank, and 3) Rakuten Securities.
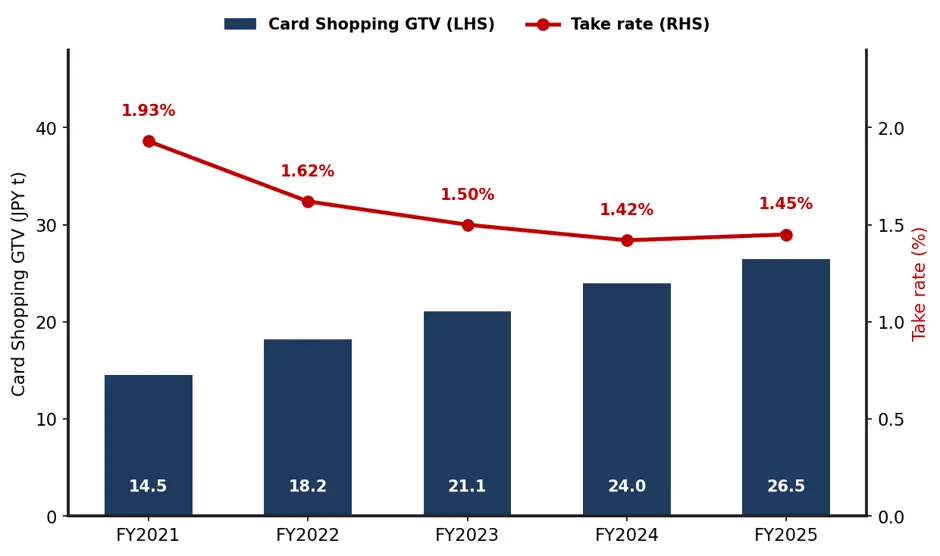
Rakuten Card is the largest single FinTech business by revenue (~37.6% of segment revenue as of 1Q2026). As seen in Chart 3 below, gross transaction value (GTV) rose 82.8% from JPY 14.5t in FY2021 to JPY 26.5t in FY2025, with take rate (Revenue / GTV) declining from 1.93% to 1.45% in the same timeframe. Crucially, even as GTV has grown, the segment’s non-GAAP operating margins have broadly remained resilient in a 14-18% range throughout, reaching 16.5% in FY2025, highlighting cost discipline helped partly offset fee-rate decline.
Rakuten Bank has been the fastest-growing FinTech sub-segment. Aided by the BOJ’s rate hikes, net interest income rose from JPY 69.0b in FY2022 to JPY 197.6b in FY2025, while operating margin expanded from 32.1% to 40.3% over the same period as net interest margins inched higher.
Rakuten Securities continues to benefit from the Japanese market’s reform initiatives, which have led to an increase in securities accounts: NISA accounts reached 7.53m (+18.3% YoY) and general accounts reached 13.87m (+12.4% YoY) as of March 2026. This customer growth, combined with a favourable market environment and higher interest income from BOJ rate hikes, drove segment revenue up 75.7% from JPY 90.0b in FY2021 to JPY 158.1b in FY2025.
Looking ahead, we expect FinTech to remain a key consistent anchor for Rakuten’s earnings contributor, though the underlying drivers differ in durability across the three main sub-segments. Rakuten Bank and Securities should continue to benefit from the BOJ’s rate hike path, although we caution on the other hand that any sustained market downturn will weigh on these segments.
Chart 3: GTV & Take Rate for Rakuten Card
Data as of 31 December 2025
Source: Company data, iFAST Compilations.
Gradual, steady turnaround in Mobile supports debt servicing capacity
Long been the segment that’s been loss-making for Rakuten, Mobile’s story is one of recovery rather than steady compounding. As seen in Chart 4 below, since the peak EBITDA losses of JPY 339.0b in FY2022, the segment has narrowed its losses for every year, before turning EBITDA positive of JPY 28.8b for FY2025.
The clearest evidence that this turnaround may be durable came in 1Q2026; historically, the first quarter is Mobile’s seasonally toughest quarter, with EBITDA usually negative for this period due to higher marketing costs. That said, 1Q2026’s EBITDA for the mobile segment came in positive at JPY 1.0b; the first time it has done so.
Delving deeper into the figures, we note that EBITDA margins have been growing as cost discipline and scale come in. However, we stress that the margin improvement is being driven by cost discipline and scale rather than by better subscriber economics; while total subscribers grew 1.74m YoY, both churn and ARPU have been broadly flat, implying recent gains have come from adding new subscribers rather than from higher retention or ARPU. That said, we highlight that cost discipline can only bring margins up so far; we do not consider margin improvement as a key contributing factor from here on out.
Capex is the clearer risk to watch. Network capex jumped to JPY 26.2b in 1Q2026 alone, more than double what was spent in 1Q2025; we note that management guided for JPY 200b in Mobile capex for FY2026, as Rakuten accelerates its build-out.
Looking ahead, we expect Mobile’s EBITDA recovery to continue. The key swing factor is less about subscriber quality; what matters is whether Mobile’s earnings and cashflows can outpace its capex.
Chart 4: Mobile’s EBITDA has been improving since a trough in FY2022
Data as of 31 December 2025
Source: Company data, iFAST Compilations.
Decent Credit Profile with Improving Coverage
Overall, we view Rakuten’s credit profile as improving, though the consolidated balance sheet materially overstates the group’s financial flexibility.
On a fully consolidated basis, as of 31 March 2026, Rakuten reported cash and equivalents of JPY 5.04t against JPY 1.75t of bonds and borrowings. However, this cash sits within Rakuten Bank and other financial subsidiaries, whereas the JPY 1.75t debt figure does not include funding for these financial businesses. If we include borrowings for these businesses, we would estimate total consolidated borrowings closer to JPY 5.65t, yielding a net debt position of roughly JPY 612b.
The parent-only balance sheet provides a cleaner view of liquidity. Rakuten Group held cash and equivalents of JPY 330.1b against external debt of JPY 1.32t, implying a net debt of approximately JPY 992b. As seen in Table 1 below, leverage (net debt / EBITDA) stands at 2.14x as of 31 March 2026, marking a slight reversal of the deleveraging trend since FY2023. Management’s own leverage metric (non-FinTech net interest-bearing debt / non-FinTech EBITDA) has seen leverage improve to 5.6x in March 2026, from 6.5x in December 2025 and 11.7x in December 2024, against targets of approximately 6x by end-FY2026 and within 5x by 2027. We believe the 6.5x 2026 target, being above current levels, is consistent with the capital expenditure step-up planned for the Mobile segment.
Coverage seems adequate: Rakuten’s interest coverage ratio (EBITDA / annual interest expense) has strengthened from 3.12x in FY2023 to an estimated 5.74x on a trailing twelve-month basis. A steady increase in the group’s EBITDA generation, from loss-making in FY22 to JPY 464.7b over the TTM, outpaced the group’s interest expense growth.
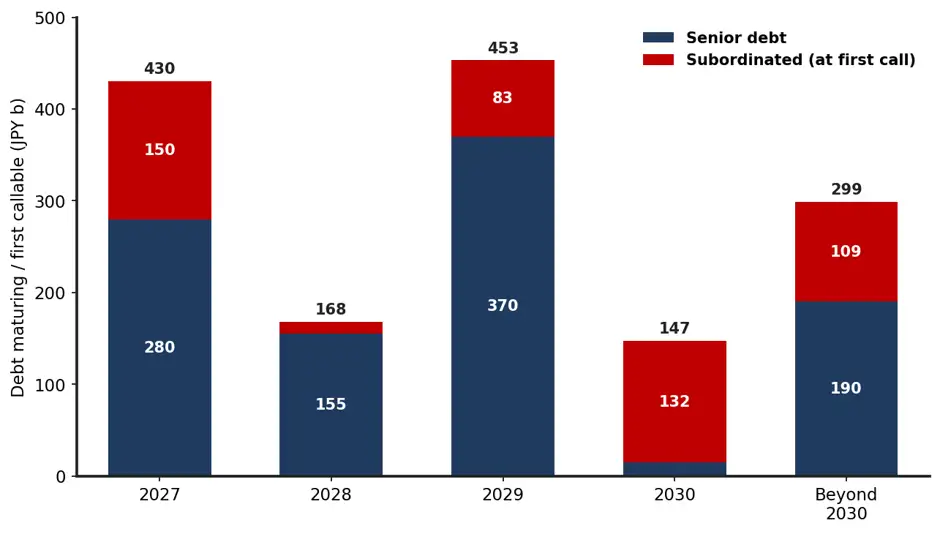
Looking at Chart 5 below, Rakuten’s debt maturities are unevenly spread. FY2026 is light at JPY 65b, with management already confirming it is fully covered by cash on hand. FY2027 is the year to watch with roughly JPY 276b of debt due, potentially rising to around JPY 426b if Rakuten opts to redeem two subordinated bonds in April and November 2027; we think there’s a good chance of this happening given favourable economics surrounding early redemption. Management has indicated it will meet these obligations through a mix of funding methods, which we read as refinancing rather than repayment from cash.
Refinancing should, however, reduce Rakuten’s interest bill. The February 2027 bond was issued in early 2024, when the company's credit was under pressure, at an effective cost of 7.2% after hedging. Its most recent yen bond, issued in August 2025, priced at just 2.3%. Replacing the maturing bond at a similar level would save roughly JPY 12–13b a year, or about 16% of current interest expense. Rising Japanese interest rates would narrow that saving but not close the gap.
Looking ahead, we expect coverage to continue improving as Internet Services stabilises, Mobile continues to increase its profitability, alongside the concurrent compounding of FinTech's earnings. However, Mobile's capex trajectory in particular bears close watching as the clearest swing factor on whether Rakuten’s balance sheet improvement can continue at its recent pace.
Chart 5: Debt Maturity Profile – FY2026 is funded, refinancing likely for FY2027
Data as of 5 August 2026
Source: Company data, iFAST Compilations.
Table 1: Credit metrics have improved
|
Credit Metrics |
FY2023 (Dec’23) |
FY2024 (Dec’24) |
FY2025 (Dec’25) |
1Q2026 (Mar’26) |
|
Non-consolidated Net debt / EBITDA |
7.98x |
2.95x |
2.04x |
2.14x* |
|
Interest Coverage Ratio (EBITDA / Annual interest expense) |
3.12x |
3.84x |
5.28x |
5.74x* |
|
*Trailing Twelve Month (TTM) basis Data as of 31 March 2026 |
||||
Table 2: Bond recommendations
|
Issue |
Issuer |
Ask Price |
Yield to Worst (%) |
Years to maturity / Years to next call |
Credit rating (S&P) |
|
Rakuten Group, Inc. |
103.10 |
5.19% |
0.53 / - |
BB |
|
|
Rakuten Group, Inc. |
108.60 |
6.23% |
2.70 / - |
BB |
|
|
Data as of 4 August 2026. Source: Bloomberg, Bondsupermart, iFAST Compilations. |
|||||
Overall, we think Rakuten has a stable credit profile, with improving leverage and coverage due to the Mobile segment turning profitable. Moving forward, we continue to expect stable earnings from both the Internet Services and FinTech services, while the Mobile segment offers scope for improved profitability. While refinancing is expected over the next 1 year or so, we expect it to be successful (subject to market conditions) given the improvements in EBITDA for the group.
In Table 1 above, we highlight a couple of outstanding Rakuten USD bullet bonds. In general, the bullet bonds offer yields-to-worst ranging from 5.19% to 6.23%, presenting an attractive yield spread of 124 bps to 195 bps against comparable US Treasuries. In sum, we think these issues provide attractive short-dated income for investors who are comfortable with a sub-investment grade issuer (S&P: BB) whose credit profile has seen decent improvement and is expected to remain stable.
Declaration: For specific disclosure, at the time of publication of this report, IFPL (via its connected and associated entities) holds RAKUTN 11.250% 15Feb2027 Corp (USD) and the analyst who produced this report holds NIL positions in the abovementioned securities. This research report was prepared with the assistance of artificial intelligence (AI) tools. iFAST Financial Pte Ltd does not rely exclusively on AI for content generation; the content of this report – including all investment theses, ratings, price targets and conclusions – has been independently reviewed and verified by the research analyst(s) to ensure accuracy and professional integrity.