Receive first-hand news on the latest bond issues, credit updates and special events when you join us on our Telegram channel at https://t.me/bondsupermart!
- ANZ saw strong NII in 1H23 due to healthy loan growth and higher margins on deposits. The bank has managed its costs effectively, focusing on improving operational capabilities and digital banking services.
- We expect NII to remain supported in 2H23. In the long-term, we see earnings tailwinds from ANZ Plus’ growing customer uptake and synergies unlocked from a potential acquisition of Suncorp Bank.
- The bank's asset quality remains resilient while liquidity and capital position are healthy and sufficiently above the regulatory minimum levels.
Introduction to ANZ Bank
The Australia and New Zealand Banking Group Limited ("ANZ") is a multinational banking and financial services corporation headquartered in Melbourne, Victoria, Australia. It is the nation’s second-largest bank in terms of assets and fourth-largest bank in terms of market capitalisation (as of 7 August).
As one of Australia’s big four banks, ANZ has about 570 branches and services around six million customers in its home market. Beyond Australia, the bank also has strong footprints globally, with a significant presence in New Zealand and across emerging markets like China, Vietnam, and Indonesia.
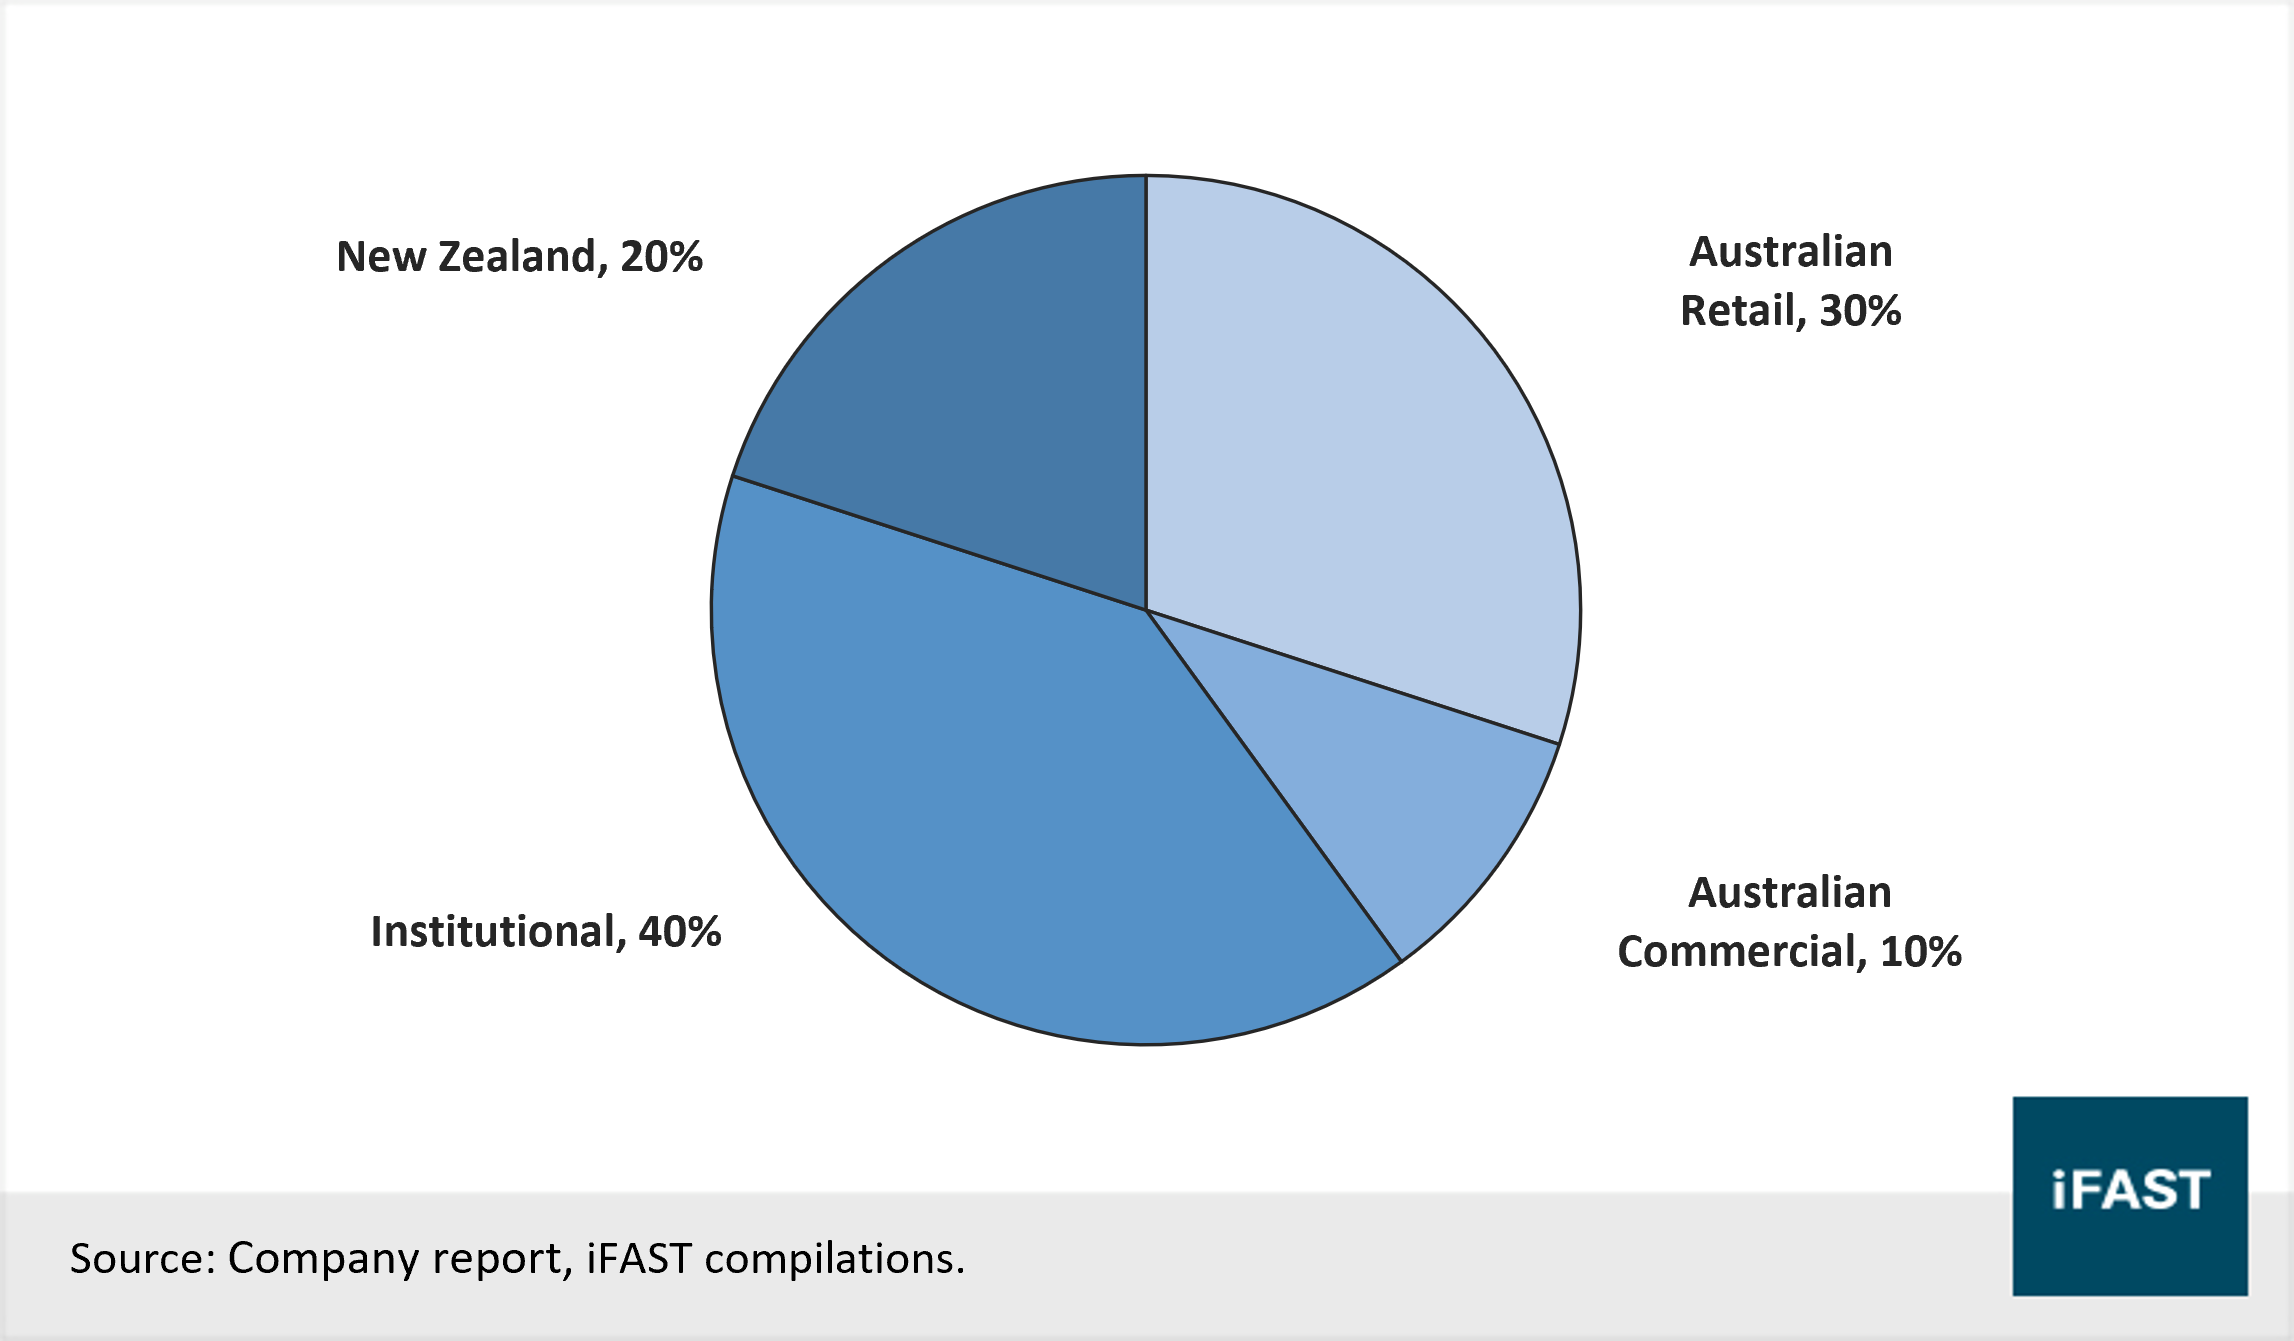
ANZ operates mainly across four main sectors (Chart 1):
- Australia Retail: The Australia Retail division services ANZ’s retail customers across the country and is focused on improving their financial well-being.
- Australia Commercial: The Australia Commercial division services ANZ’s commercial and private banking customers across the country.
- Institutional: The Institutional division services global institutional and business customers across three product sets: Transaction Banking, Loans & Specialised Finance, and Markets.
- New Zealand: The New Zealand division comprises the Retail and Commercial business units.
The credit rating of ANZ stands robust, with all three major credit rating agencies having a stable outlook on the group, with ratings of ‘A+‘ by Fitch, ‘Aa3’ by Moody’s, and ‘AA-‘ by Standard & Poor’s.
Chart 1: Capital Allocation across ANZ’s key business sectors
Profitability of ANZ
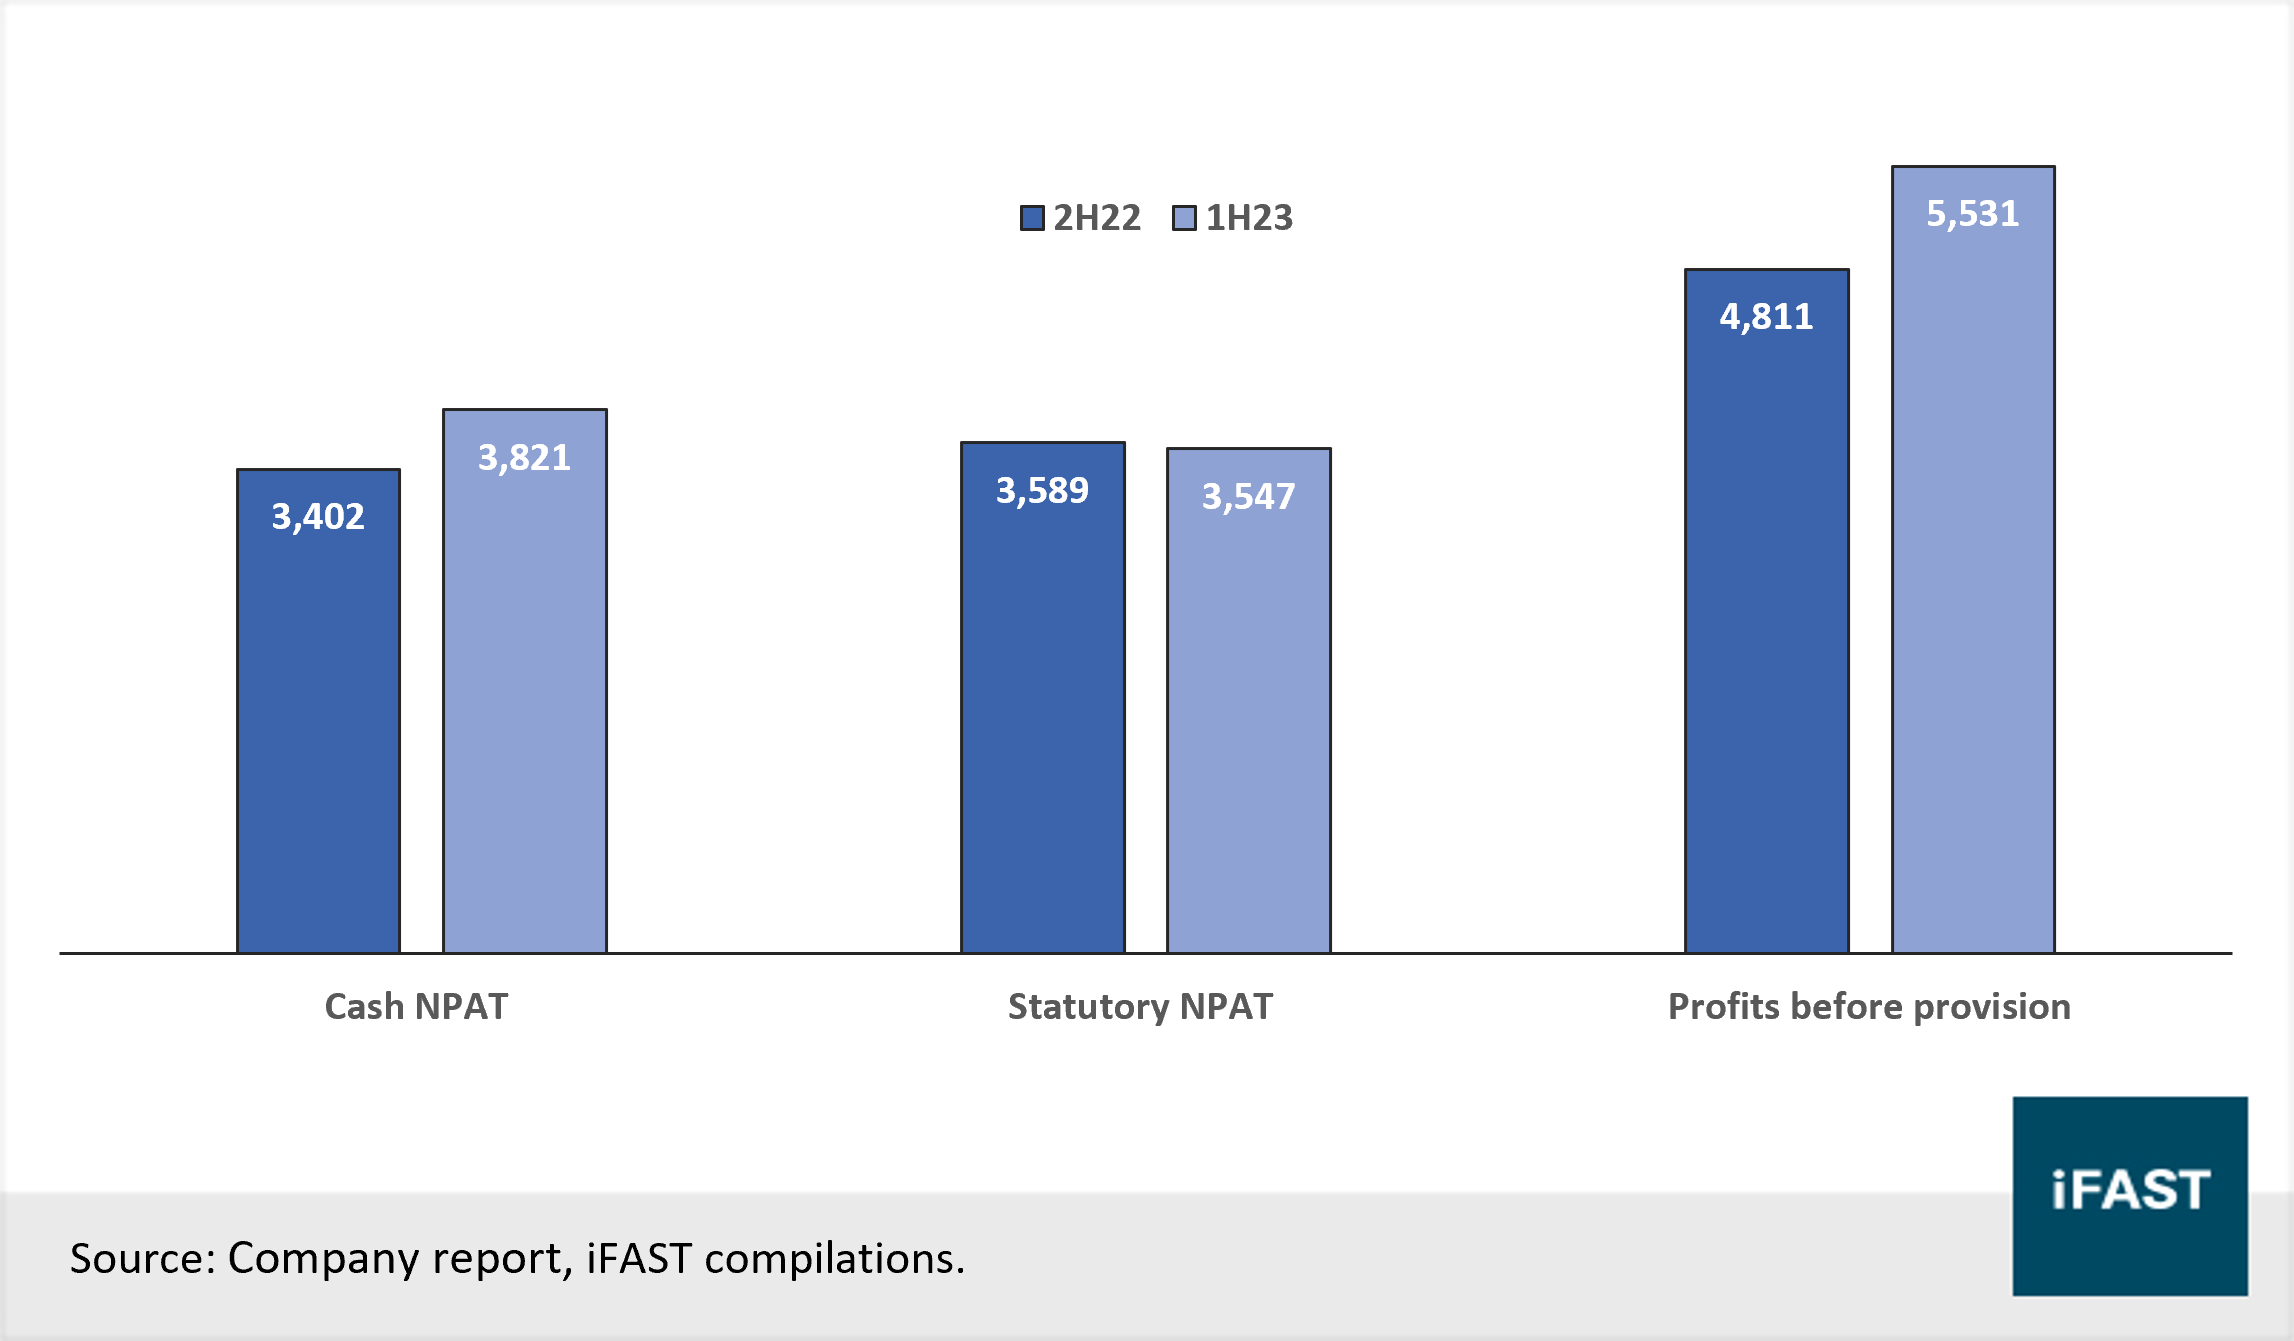
ANZ demonstrated strong operating performance in the half year ended 31 March 2023 (1H23). Cash net profit after tax (“NPAT”) grew 12% from AUD 3,402M (2H22) to AUD 3,821M (1H23) (Chart 2). While statutory NPAT fell by 1% from AUD 3,589M (2H22) to AUD 3,547M (1H23) (Chart 2), we do not find it alarming as statutory NPAT includes non-business-as-usual items such as revenue hedges, treasury shares and gains/losses from sales or acquisition. These items tend to fluctuate and may not accurately reflect the underlying performance of the bank.
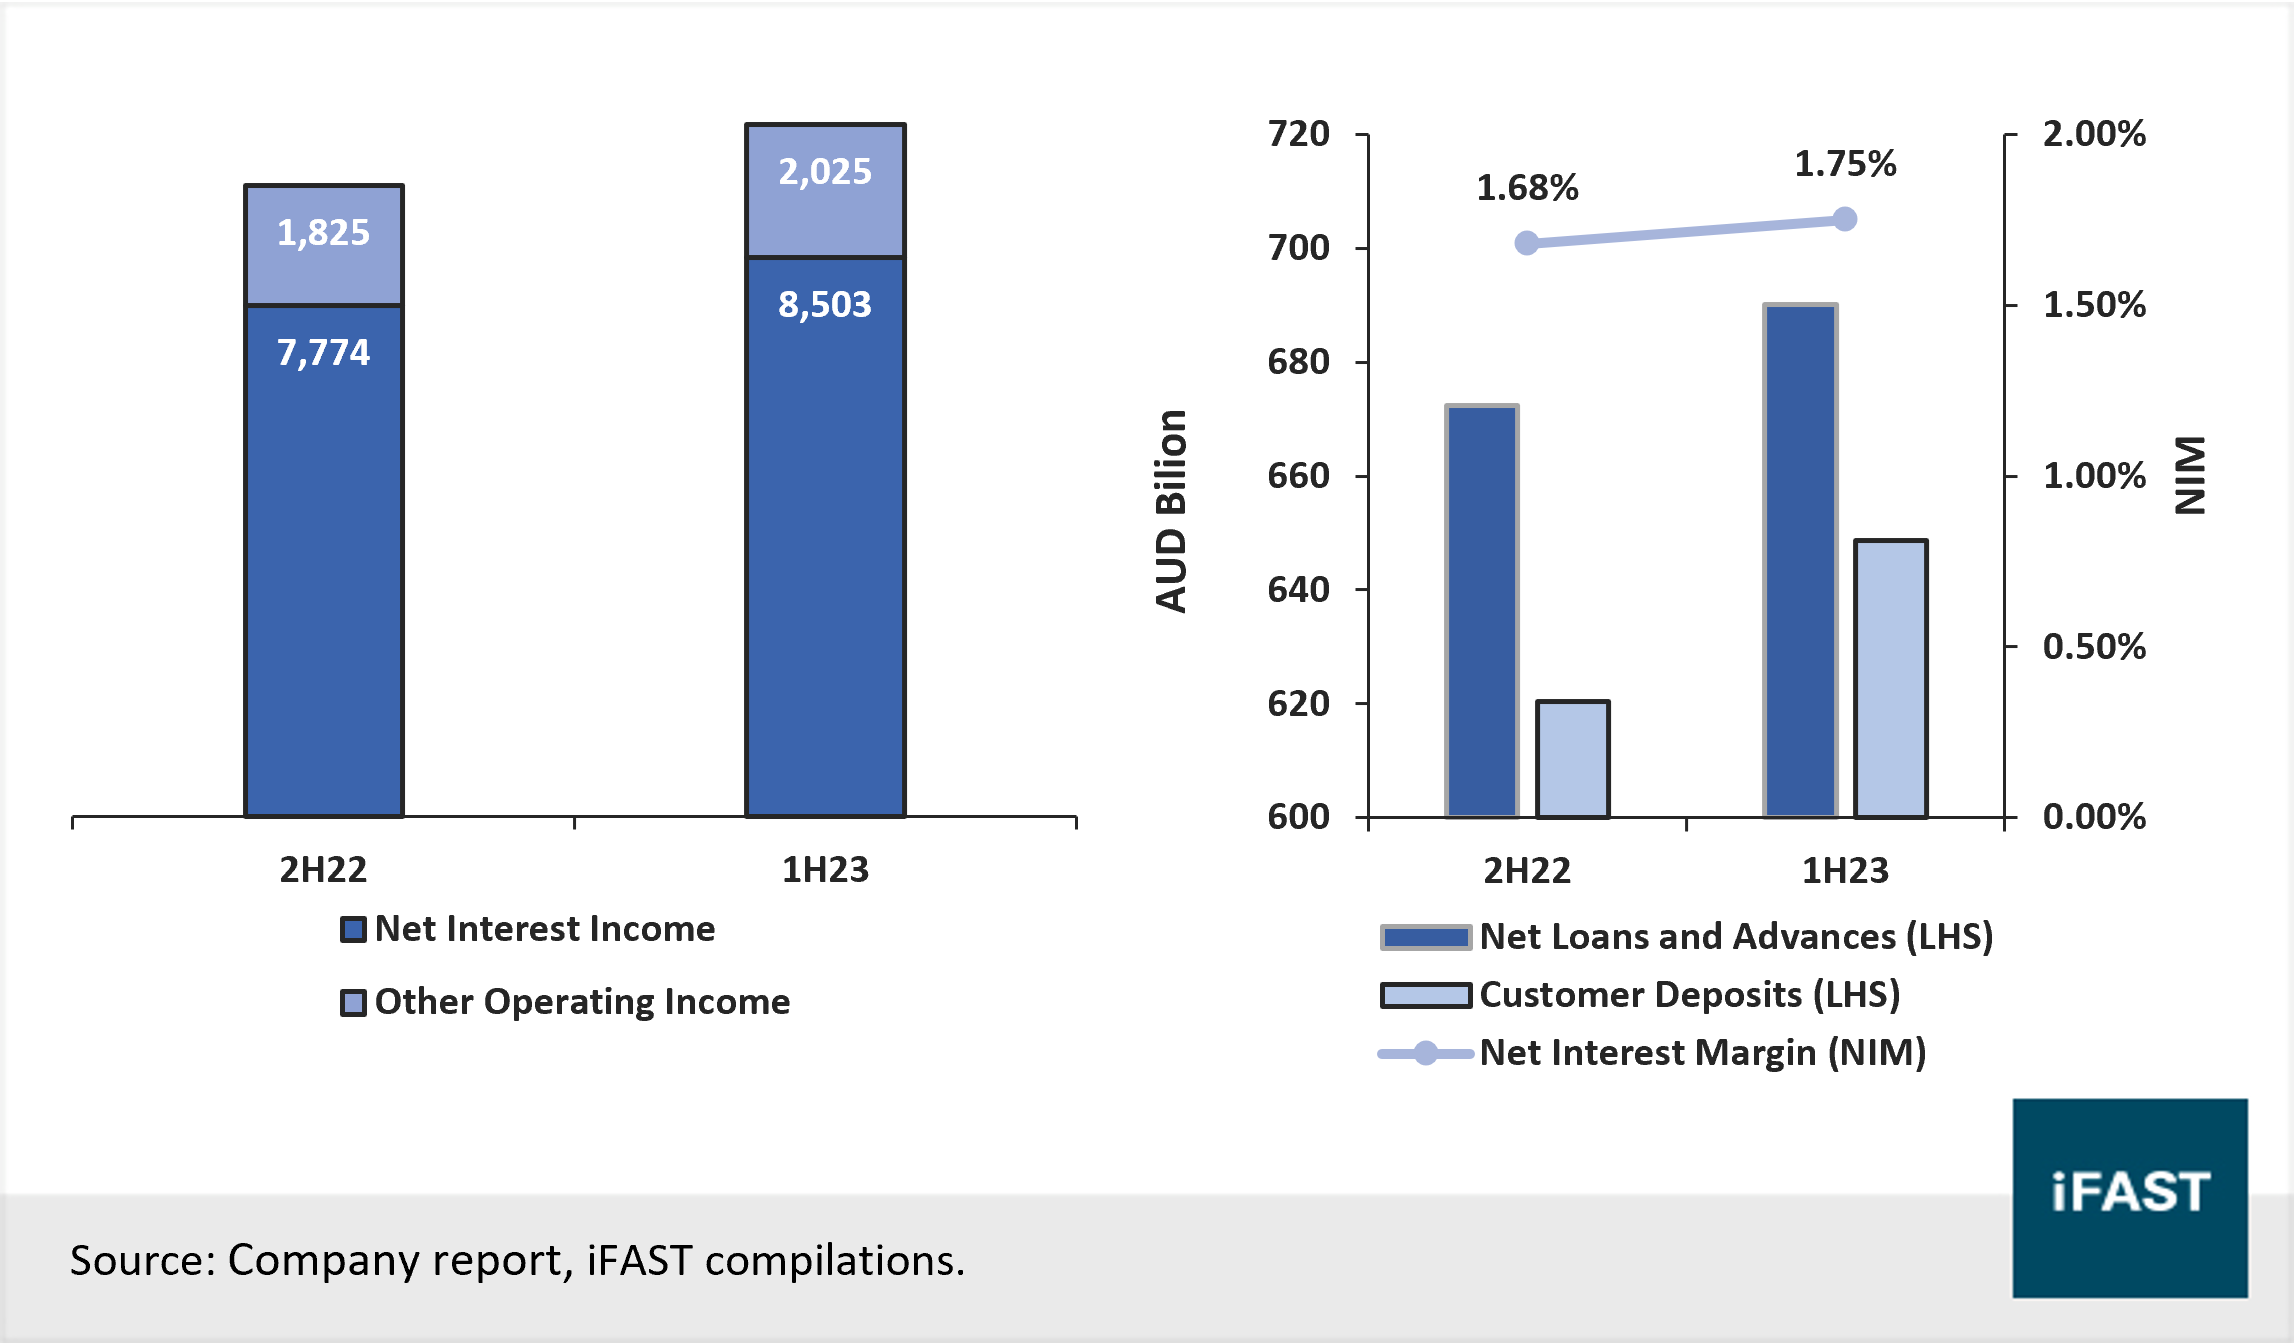
Cash NPAT performance tends to be a better gauge of ANZ’s performance and is a common measure used by Australian banks. Another sign of improved operating performance can be gleaned from the robust growth in total operating income, which was up 10% from AUD 9,599m (2H22) to AUD 10,528m (1H23). This was meaningfully driven by a 9% increase in net interest income (“NII”) from AUD 7,774m (2H22) to AUD 8,503m (2H22) and a bigger increase in other operating income of 11% from AUD 1,825m (2H22) to AUD 2,025m (1H23). Collectively, this supported a 15% increase in profits before provision, rising from AUD 4,811m (2H22) to AUD 5,531m (1H23) (Chart 2).
Chart 2: Profitability across 2H22 and 1H23 (AUD Million)
The bank’s stronger NII was a result of two factors. First, it was driven by an increase in the volume of loans as net loans and advances increased by 4% HoH (Chart 3). Second, a 7 basis points (“bps”) pick up in net interest margin (“NIM”), from 1.68% to 1.75% (1H23) (Chart 3). Deposits played a huge part in higher NIM, superseding the drag from the softer home loans sector in Australia and New Zealand which was affected by stiff competition against rival banks, stifling the ability to raise loan rates. However, with the home loan sector comprising a small proportion of ANZ’s loan book, we believe that its impact should be minimal.
Cost of the bank remains relatively under control, with total operating expenses seeing a smaller increase of 4% to AUD 4,997m (vs 2H22). This was largely driven by inflationary impacts on wages, product enhancement, technological spending on projects like Cloud Run and ANZ Plus, as well as cost from preparation work for the potential Suncorp integration. Much of the cost, apart from those driven by inflation, are initial expenses for new projects that are introduced to optimize and expand ANZ’s operating capabilities. These preliminary expenses are expected to either generate future cost savings or support operating income.
Take ANZ Plus for example, which is the bank’s new digital banking service aimed to help lower the cost of service as well as to increase customer engagement and operational performance for the Australian retail banking arm. While ANZ Plus initially contributed to operating expenses, this service has performed well, with AUD 6.1b of deposits inflow and over 260,000 customers since its launch.
Chart 3: (Left) Operating Income across 2H22 and 1H23 (AUD Million). (Right) Drivers of Net Interest Income across 2H22 and 1H23 (AUD Billion)
Business Outlook
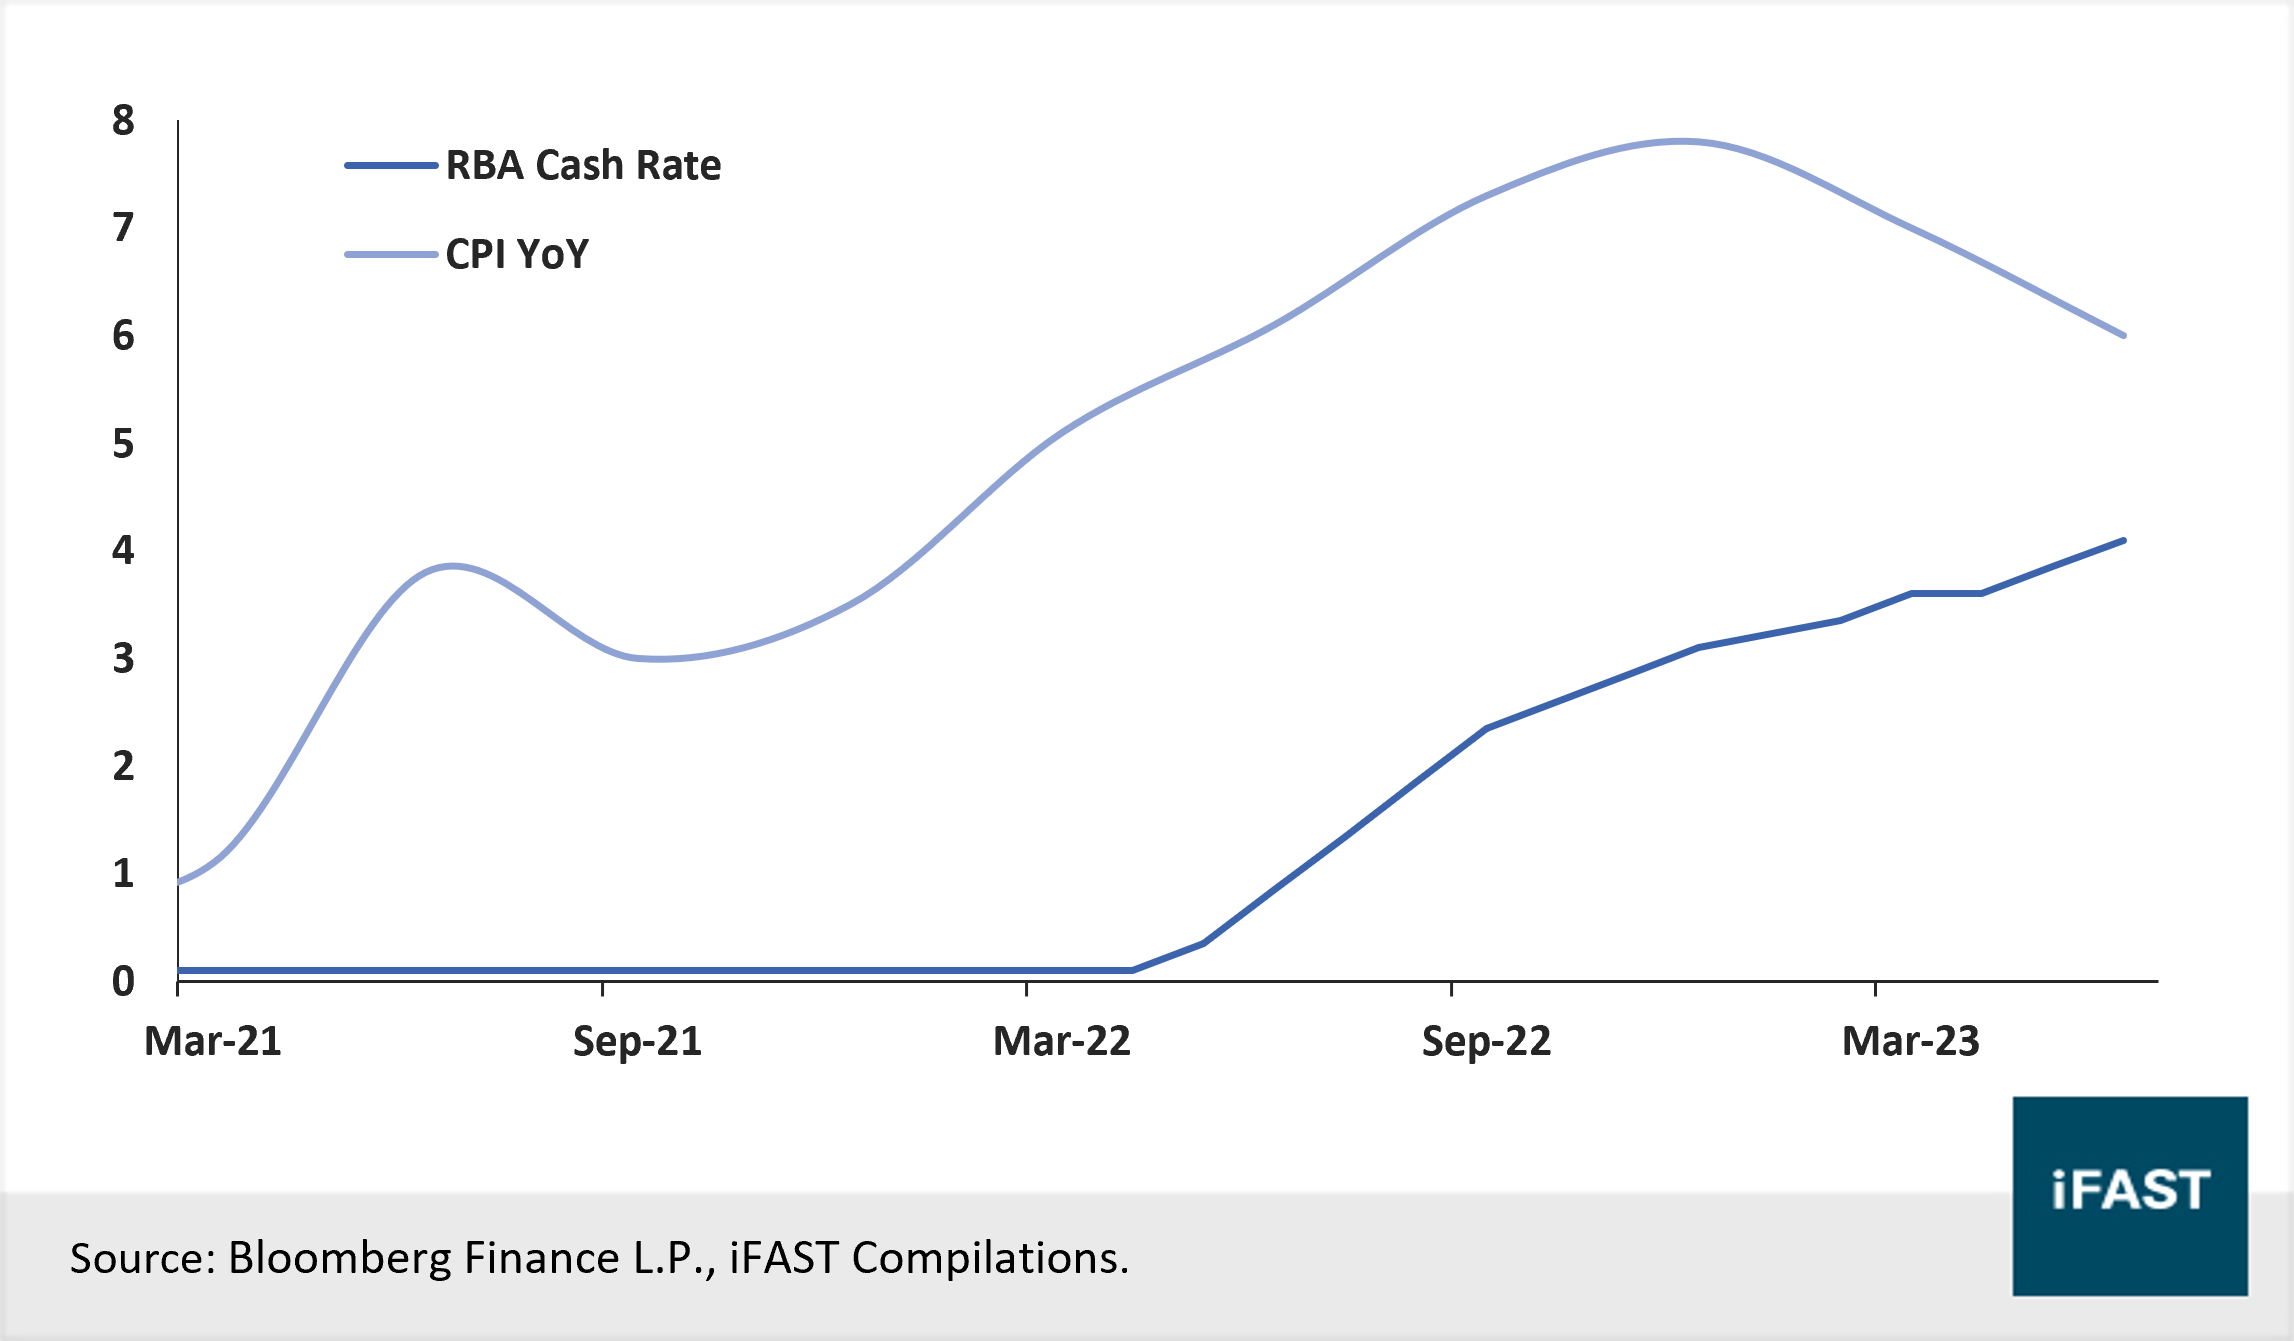
Since March 2023, the Reserve Bank of Australia (“RBA”) hiked the interest rates by a total of 75 bps, hitting a decade-high cash rate of 4.1% (Chart 4). While Australia’s inflation data have seemingly cooled, we see the potential for another hike by the end of 2023, supporting NIM for the bank.
Despite headwinds from the Australian and New Zealand home loans sector, the drag on NII will likely be minimal due to ANZ’s well-diversified business portfolio. Also, we think inflation will increasingly be less of a headwind for earnings in terms of expenses. The recent moderation in prices spells good news for inflation-driven expenses such as wages. Cost for the bank may continue to grow but likely at a softer pace moving forward.
Overall, given elevated policy rates and firm loan growth, we expect NII to remain supported in FY23. Beyond FY23, we expect some earnings headwinds as the Australian economy slows while pricing pressure across home loans stiffens. That said, we remain positive on longer-term earnings growth given the growing customer uptake from ANZ Plus and synergies unlocked from a potential acquisition of Suncorp Bank.
Chart 4: Historical benchmark interest rates and inflation rates in Australia (%)
Asset Quality
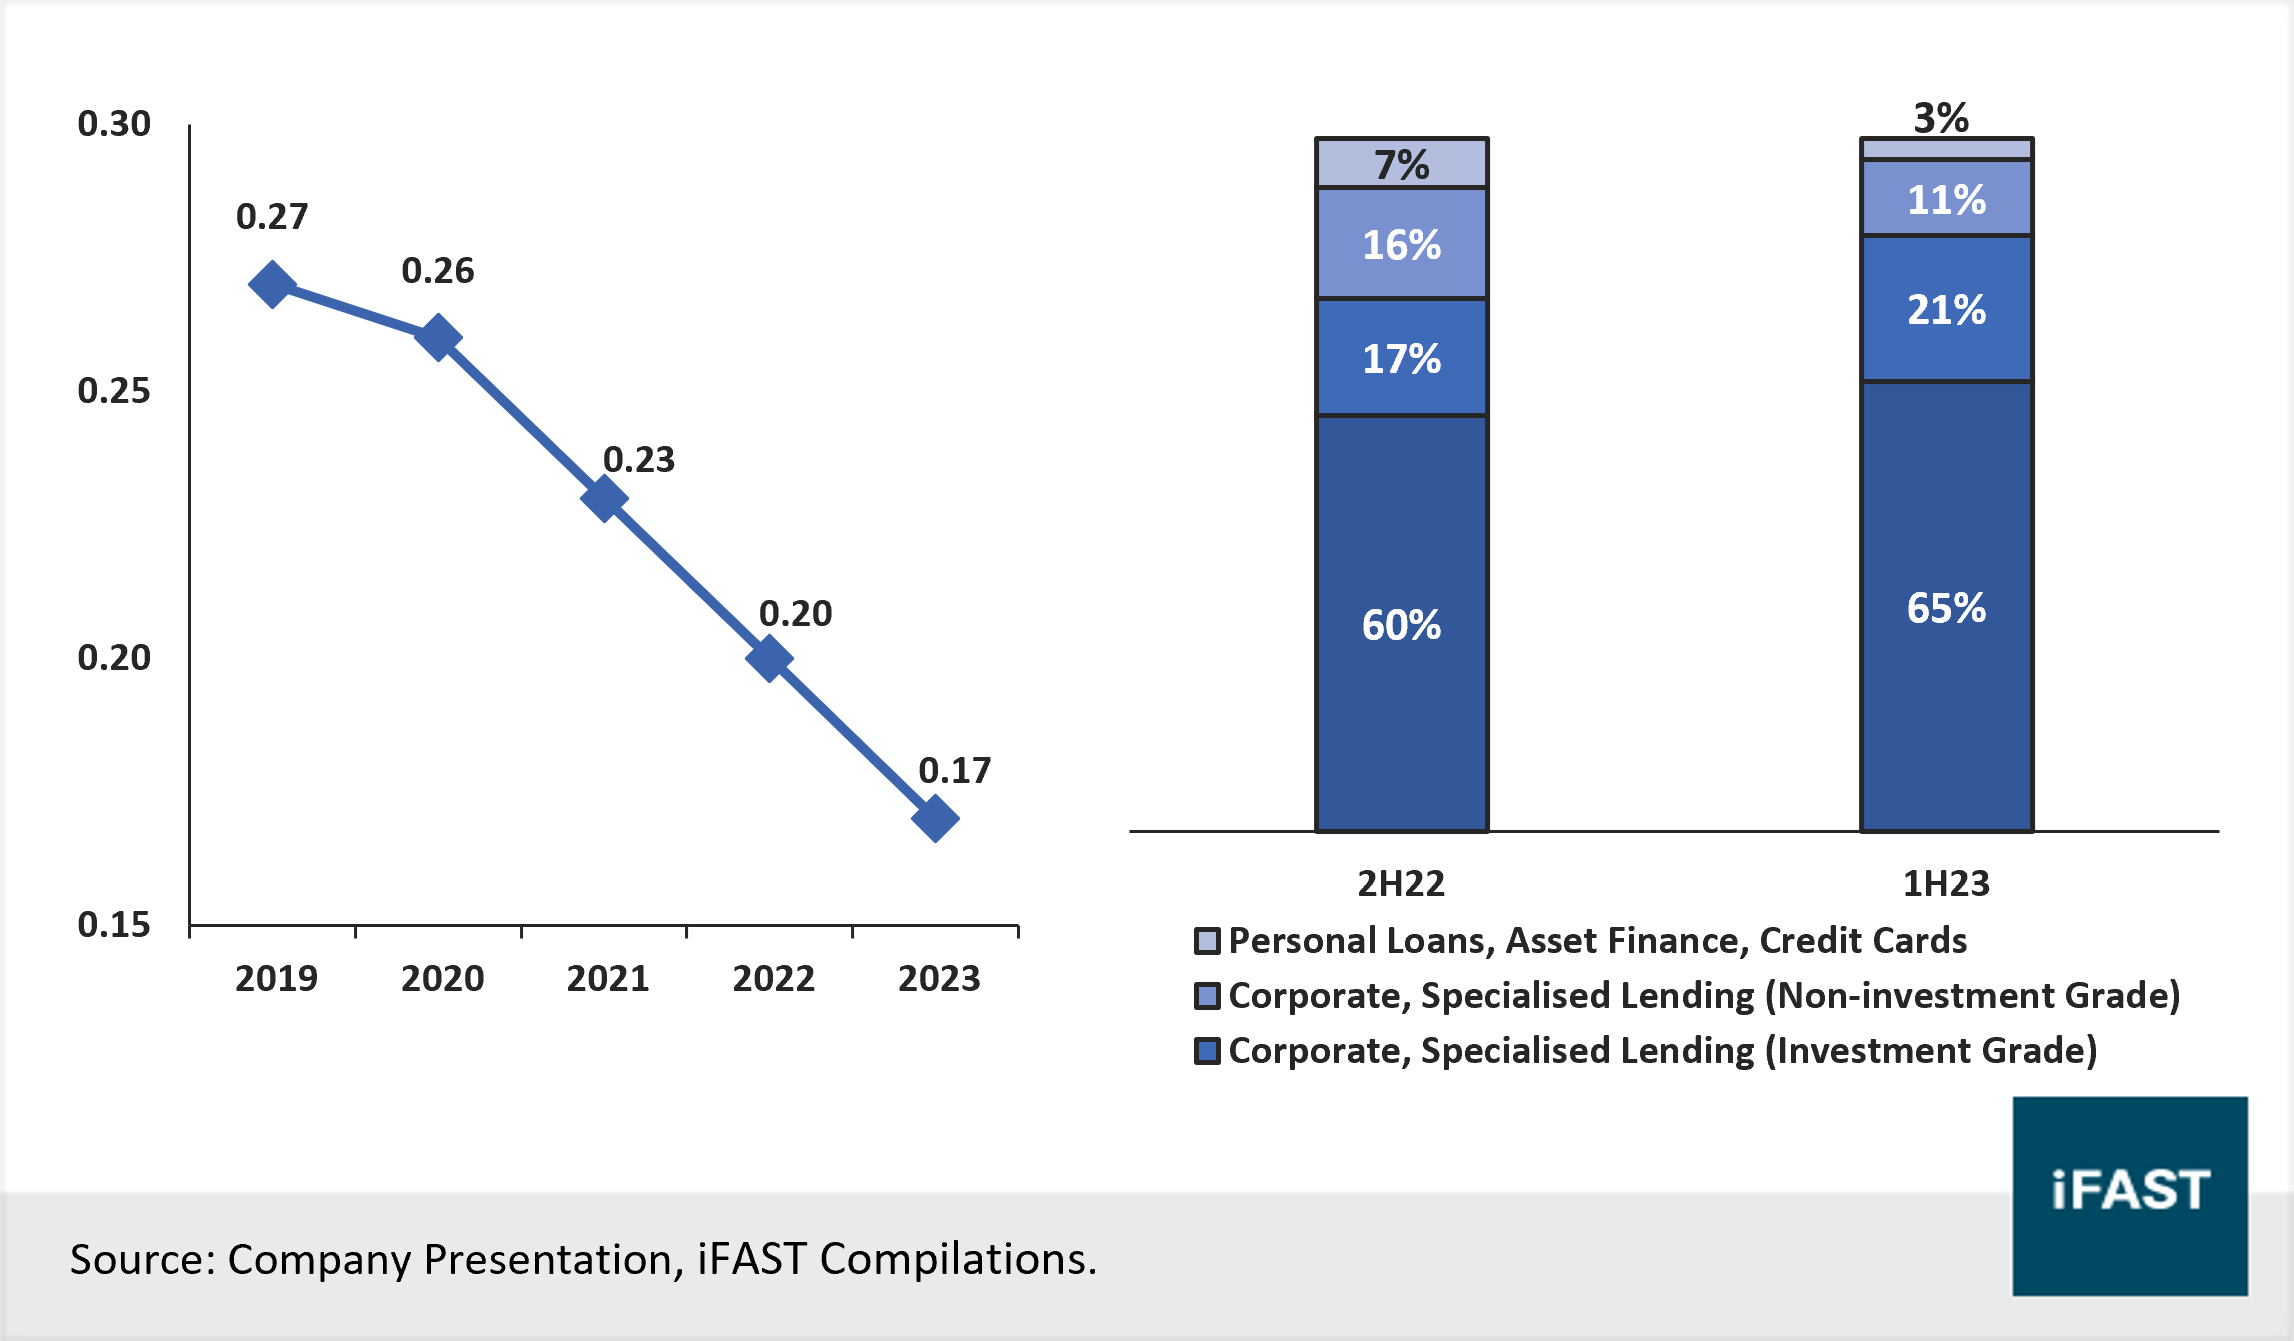
For 1H23, ANZ saw an increase in the total allowance for expected credit losses (“ECL”) of 2% from 4,395m (2H22) to 4,040m (1H23) but this was within expectations given a relatively challenging economic outlook with interest rates and inflation soaring throughout 1H23. Even with this increase, ANZ kept their long-run loss rate at considerably low levels, at 0.17% in 1H23, maintaining the declining trajectory since March 2019. (Chart 5). This can be attributed to ANZ’s continued effort in rebalancing its portfolio to reduce ‘higher loss’ segments and include more ‘low loss’ segments (Chart 5).
Loans due past 90 days (“90+ DPD”) (as a percentage of total portfolio) remained low for ANZ’s consumer portfolio. 90+ DPD for the bank’s Australia’s home loans and consumer cards have fallen steadily over the past 1.5 years. While the former saw an uptick since December 2022, 90+ DPD in 1H23 remains near the post-covid low.
Chart 5: (Left) ANZ’s Long Run Loss Rate since 2019 (%). (Right) ANZ’s loan portfolio across 2H22 and 1H23
Capital Position and Liquidity
During the first half of 2023, the Australian Prudential Regulation Authority (“APRA”) introduced new rules for the amount of capital that Australian banks need to hold. One of the key regulation changes was to the risk-weighted assets (“RWA”) and the standardization behind its calculation. The changes were designed to make the capital requirements more sensitive to the level of risk associated with different types of lending.
This change in regulation, which usually affects companies negatively, benefited ANZ as it saw a decline in RWA by AUD 34.5b, an equivalent of a 100 bps increase to the CET1 ratio. The CET1 ratio for 1H23 (under the APRA reporting standards) was 13.18%, an increase of 89 bps over 2H22. Overall, the ratio remains sufficiently above the regulatory minimum of 8.00%.
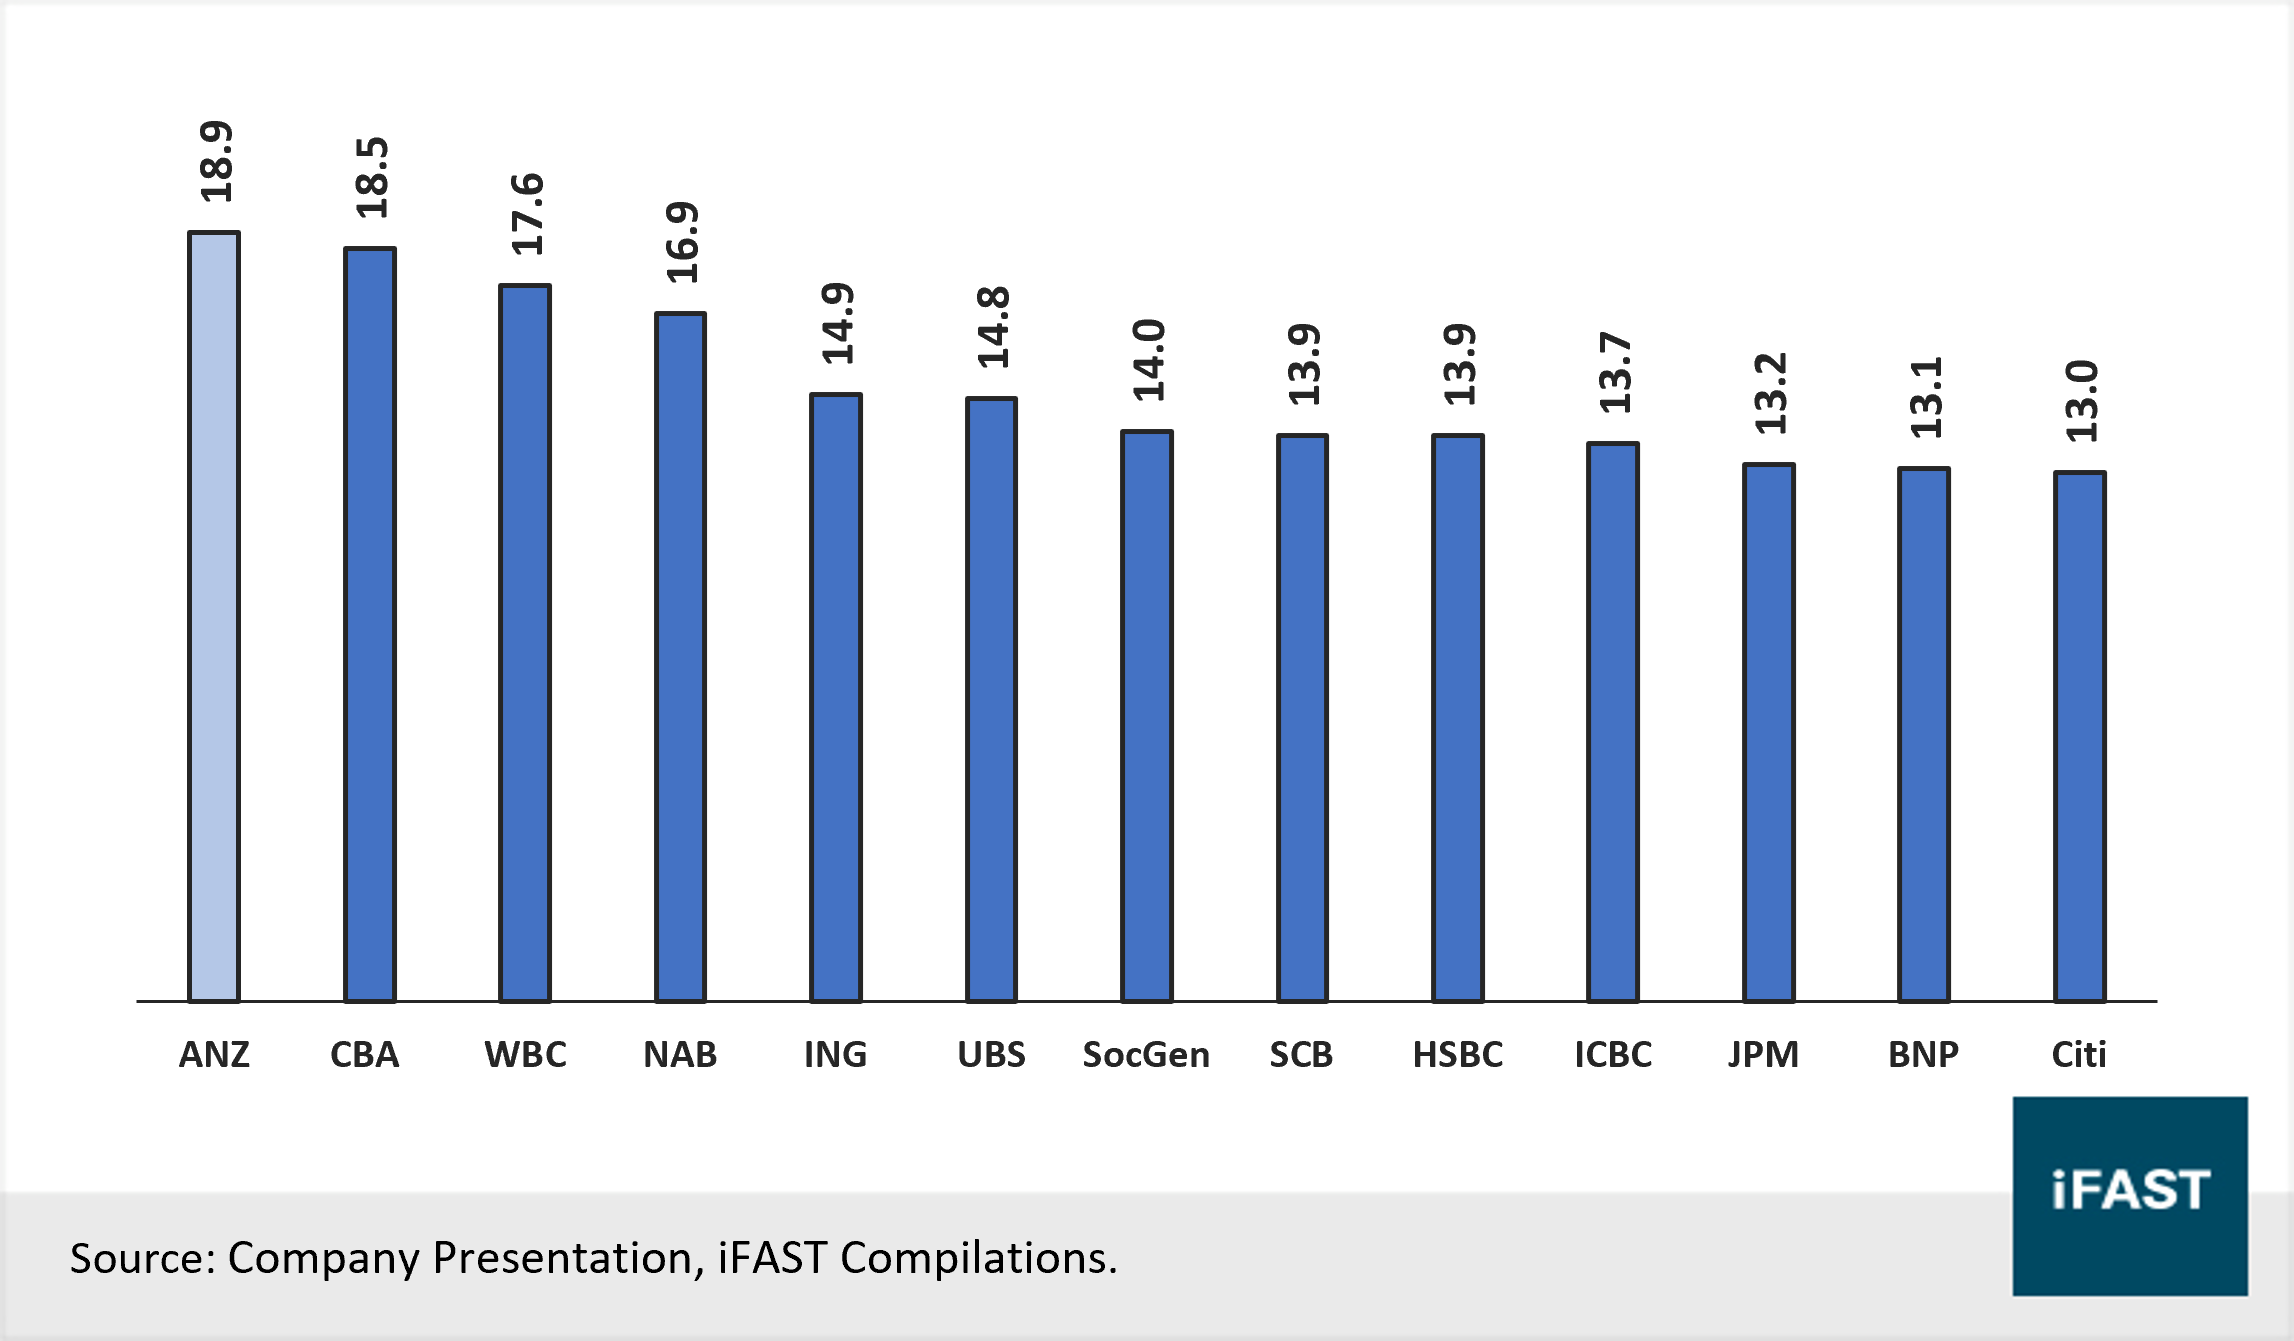
On an international level, based on Basel III regulations, the CET1 ratio was 18.94% which is comparatively much stronger than most regional banks. (Chart 6). CET1 capital remains healthy despite the dividend payout which reduced CET1 ratio by 47 bps. Accounting for the potential acquisition of Suncorp Bank, the pro forma CET1 ratio falls to 12.10% - a 118 bps drop from the current CET1 ratio level but remains well above the requirement.
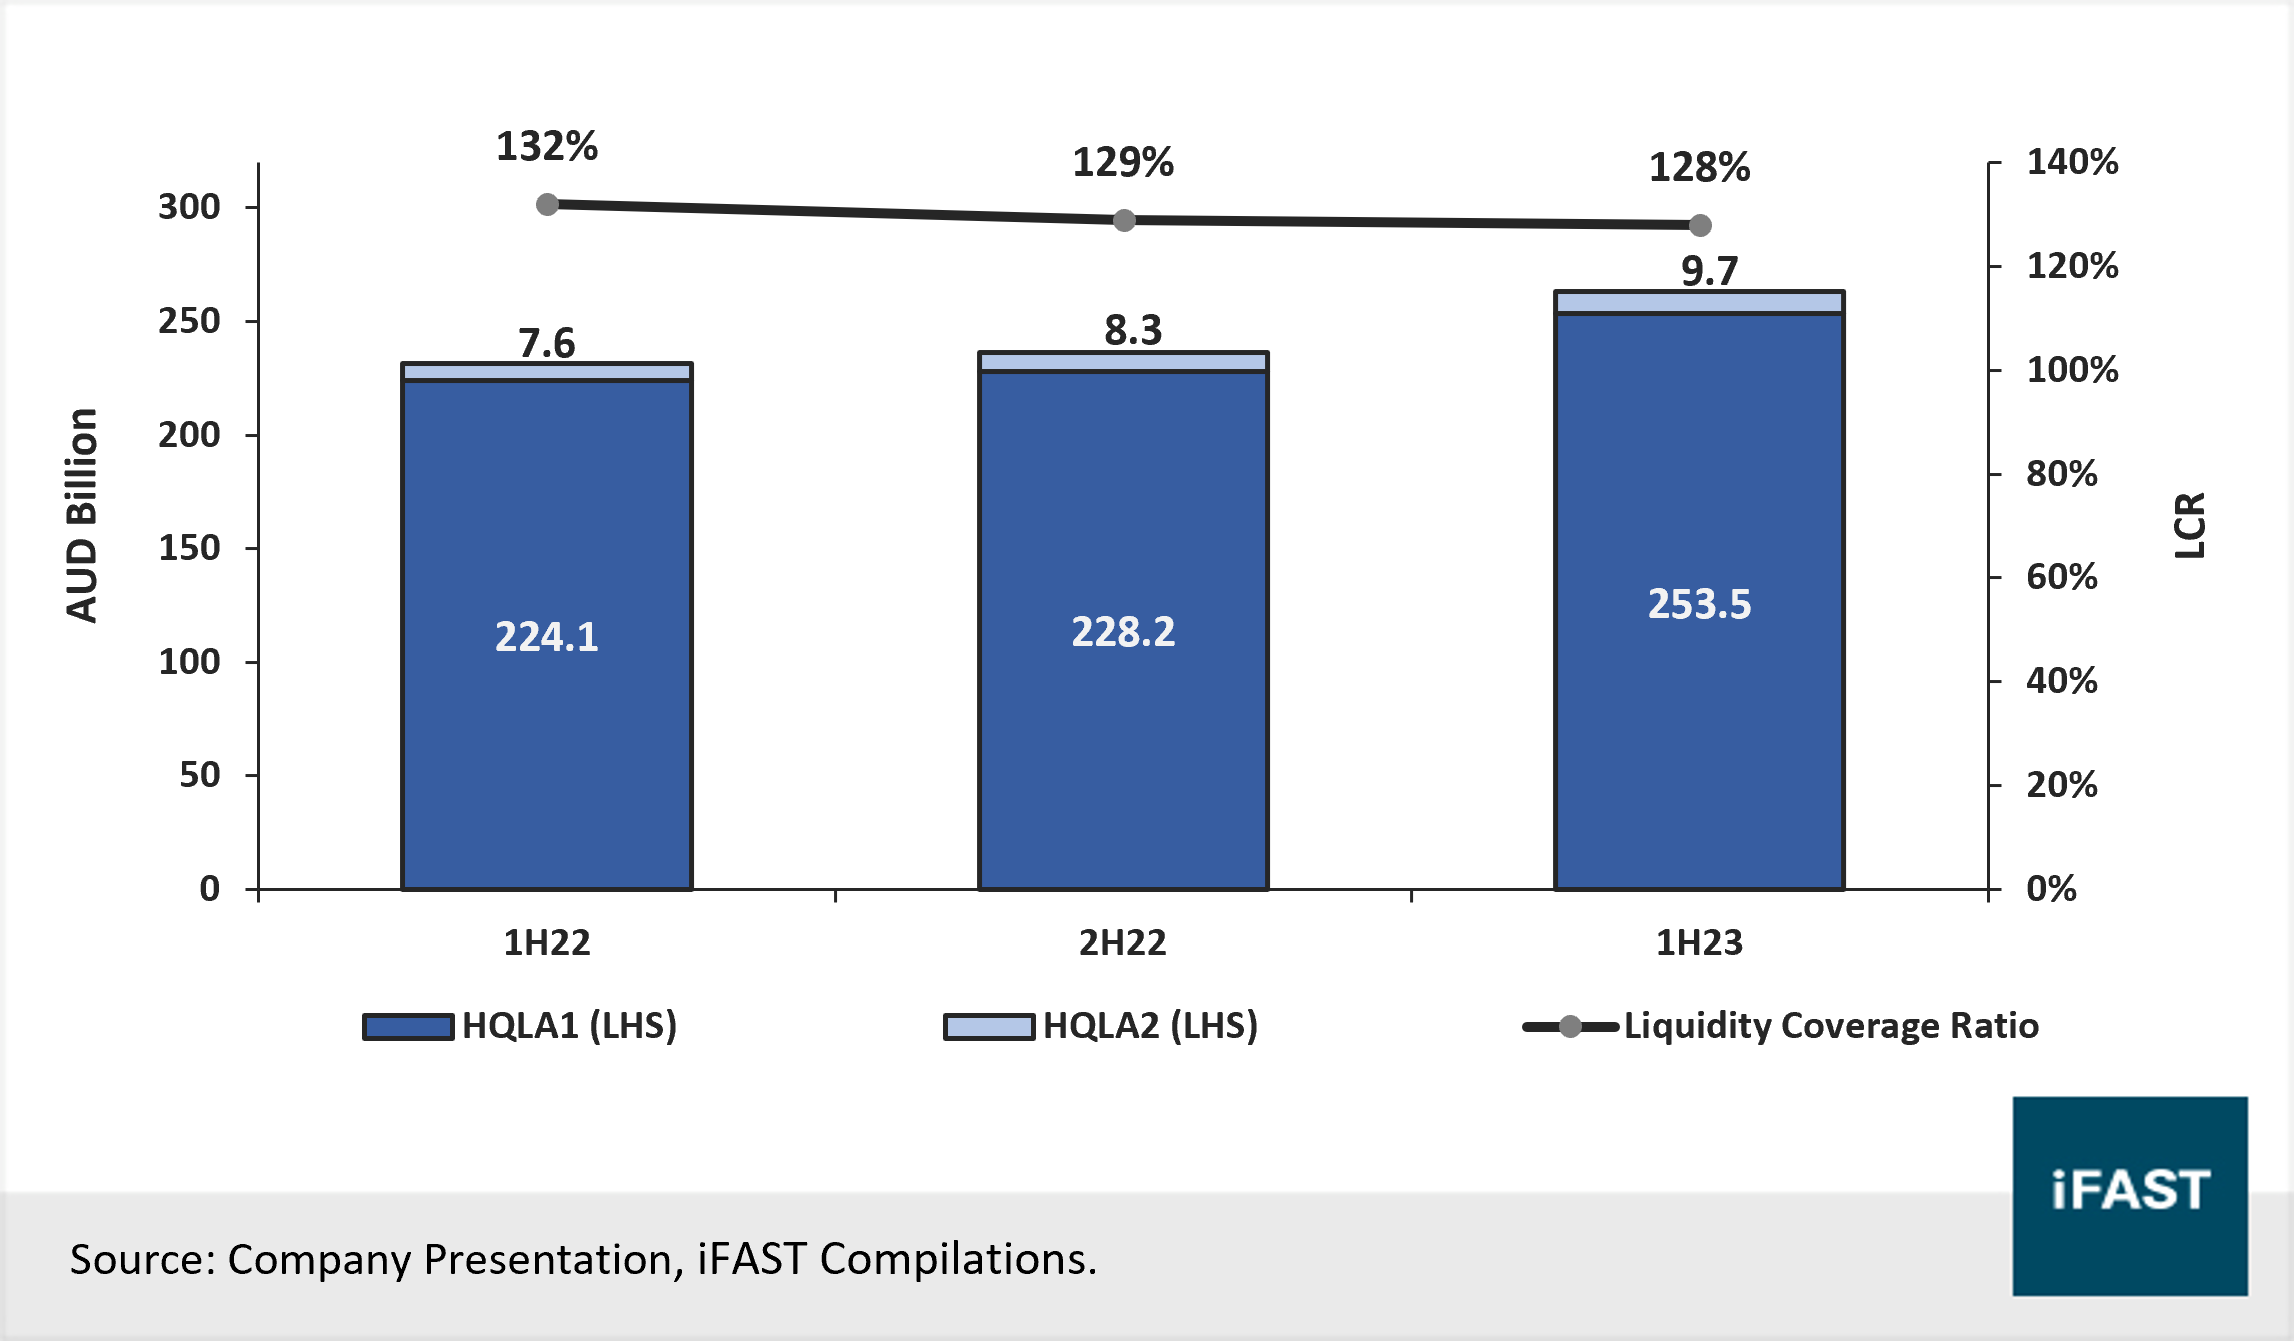
ANZ also boasts a strong liquidity position as its liquidity coverage ratio (“LCR”) stayed relatively stable over the past 1-2 years. Similarly, ANZ’s level 1 highest-quality liquid assets (“HQLA1”) and level 2 high-quality liquid assets (“HQLA2”) saw an increase of 11% and 17% respectively since 2H22 (Chart 7).
Overall, we believe ANZ’s credit profile remains strong, with the bank retaining its conservative stance on liquidity. As interest rates are likely to remain higher for longer, and potentially exert pressure on credit quality, we believe ANZ is likely to withstand a more challenging macro and financial condition.
Chart 6: Comparison of internationalised CET1 ratios with major global banks (%)
Chart 7: ANZ’s HQLA assets and LCR since 2022
Recommendations
Table 1: Tier 2 Subordinated notes across SGD and AUD
In the AUD Tier 2 (“T2”) bond space, at similar credit ratings by Australian banks, we like ANZ 4.750% 07Sep2032 Corp (AUD) for its attractive yield. For SGD T2 bonds with similar credit ratings, we continue to recommend the HSBC 5.250% 27Jun2032 Corp (SGD), which holds a similar tenor and higher initial margin as compared to other offerings from the Australian banks. Read about our thoughts on it
here.
Under the Basel III framework for Tier 2 capital, Tier 2 securities that remain uncalled past the first reset date will have to be amortized in the balance sheet of the company. This also means that there is an incentive for the banks to call back on their Tier 2 subordinated bonds and to re-issue new Tier 2 bonds to ensure capital remains sufficient on their balance sheet.
We would like to remind investors that Tier 2 subordinated bonds are ultimately subjected to loss absorption upon a trigger, although the CET1 and AT1 instruments would be utilised first before the activation of Tier 2 securities for loss absorption.
Declaration: For specific disclosure, at the time of publication of this report, IFPL (via its connected and associated entities) holds a position in ANZ 4.500% 02Dec2032 Corp (SGD) and the analyst who produced this report holds a NIL position in the abovementioned securities.
Our podcast series, Yield Hunters, is available on Spotify, iTunes Podcasts and Google Podcasts. We share our thoughts on new bond issues and hold discussions on the fixed income space. Listen to our latest episode below and follow us!