Receive first-hand news on the latest bond issues, credit updates and special events when you join us on our Telegram channel at https://t.me/bondsupermart!
Highlights:
- PDC Energy has geographical advantages with low breakeven points. Its operating performances are strong. The company could achieve a net cash position in around three years. The company has a consistent risk management strategy and superior financial discipline.
- The company’s credit indicators are excellent, which is comparable to its investment-grade peers. The financial position remains strong under the stress test. Besides, the company has a simple debt structure, and it does not rely on bond refinancing to repay the debts.
- Investors may consider the 2026 bond, with a yield to maturity of 6.8%.
We discussed the outlooks for the oil market in "Idea of the Week: Anton Oilfield Services – Capturing High Yield Opportunity in Oilfield Service" and the US natural gas in “Idea of the Week: Southwestern Energy—Moving Towards Investment Grade”. Investors who are interested could take a look.
This article would introduce an oil and gas company, called PDC Energy. The company currently has a total annual production of around 90 million barrels of oil equivalent (MMboe) and daily production of around 255 thousand barrels of oil equivalent (Mboe/d). It is a mid-sized US oil and gas company.
The company is listed on the NASDAQ Stock Exchange (Stock Code: PDCE.US). It currently has a market capitalisation of around USD 5.42 billion (same currency below).
Geographic Advantages with Low Breakeven
PDC Energy’s oil fields are located in the Wattenberg Field in the DJ Basin in Colorado, the US. The company also has a small number of fields in the Delaware Basin among the Permian Basin.
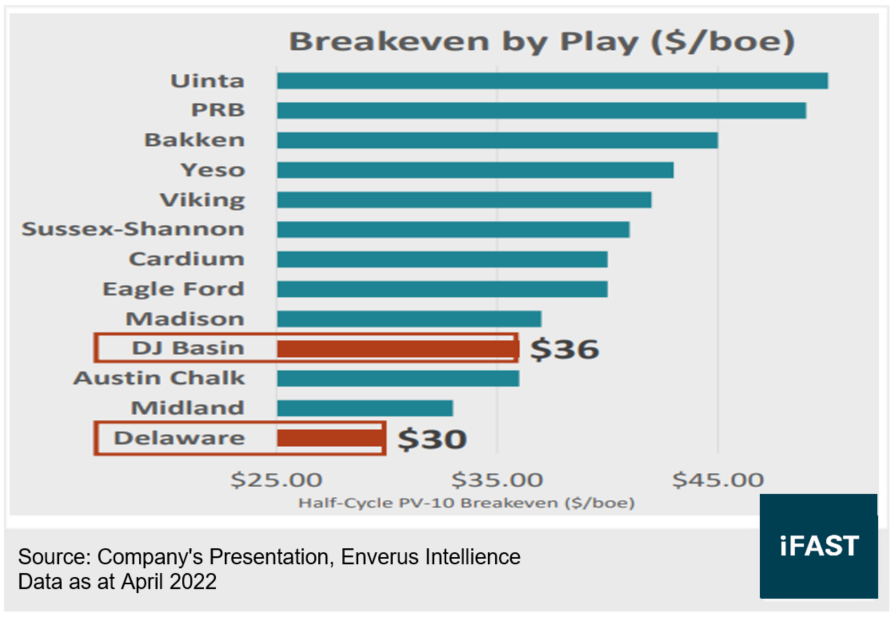
The company has a geographic advantage. As shown in Chart 1, its oil fields are located in those basins which have low breakeven points, with production costs in the DJ Basin and Delaware Basin as low as $36 and $30 per barrel of oil equivalent (BOE) respectively, which are significantly lower than those of the peers.
Chart 1: Breakeven by US Basins (In terms of weighted average costs of crude oil, natural gas and natural gas liquid)
The features of DJ Basin and Delaware are the combination of commodities, with crude oil, natural gas and natural gas condensate produced in roughly a 30% / 40% / 30% ratio. There is no preference for one commodity over another one.
Sometimes, crude oil prices do not move in line with natural gas. Therefore, if we do not consider hedging, the company's revenue would be less volatile than those upstream companies which mainly produce crude oil or natural gas.
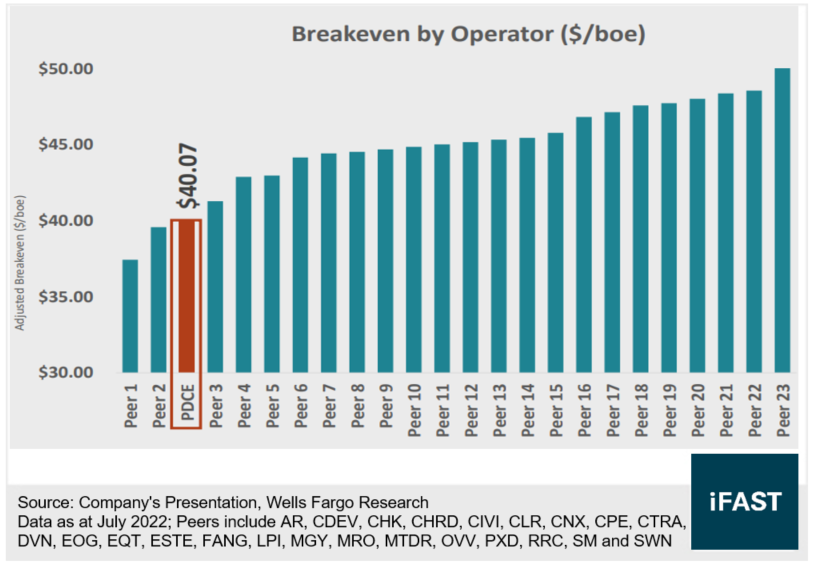
As shown in Chart 2, the company's break-even point is much lower than its peers, because the company's fields are entirely concentrated in basins (DJ Basin and Delaware Basin) with low operating costs. The company does not venture into basins with higher operating cost (such as Uinta Basin and Bakken Shale Formation), so its margins are better than those of the peers. Also, the company is more resilient and defensive during downturn cycles.
Chart 2: Comparison of US Oil & Gas Companies’ Operating Costs
In addition, the company acquired more oil fields in the Wattenberg Field from peers in 2022, for a total consideration of approximately $800 million (cash consideration of $543 million + 4 million new PDC Energy shares). This would increase its daily production by around 25% to 255 Mboe / d. This combination of cash and new share issuance will reduce its cash expense burden and help stabilise its credit status.
Based on the management's past approach and development strategy, the company should continue to acquire oil projects in the DJ Basin and Delaware Basin in this manner.
Strong Operating Performance with an Expectation of Achieving Net Cash Position in Around Three Years
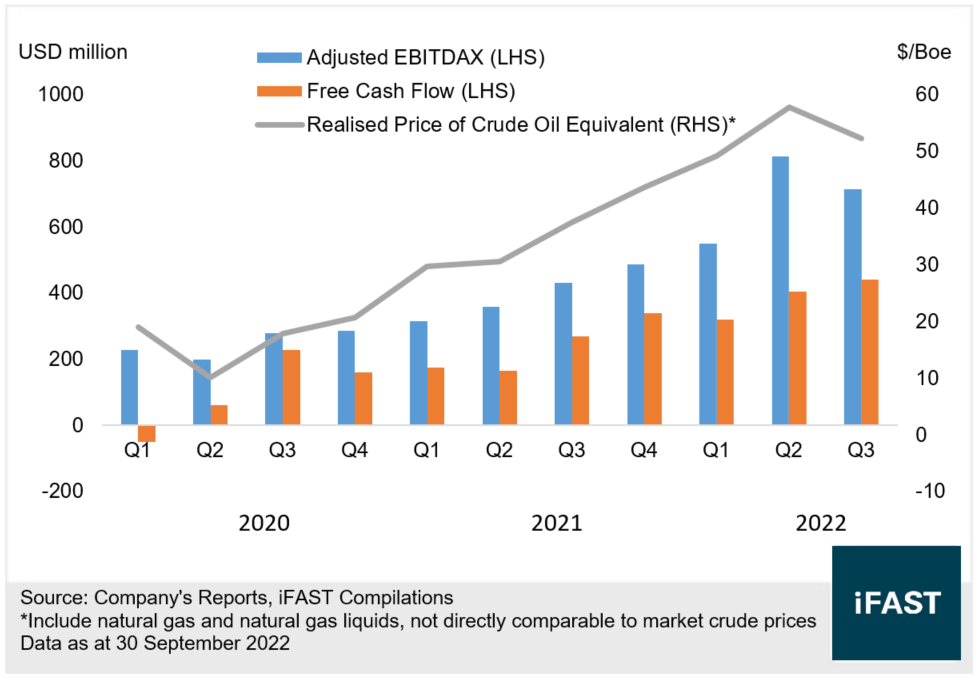
As shown in Chart 3, PDC Energy's adjusted EBITDAX was $2.08 billion in the first three quarters of 2022, increased by 88% YoY, benefiting from the surge in oil prices and increased production during the period. The free cash flow also jumped 91% YoY to $1.16 billion in the same period. The overall operating performance is strong, with decent cash flow performances.
Chart 3: PDC Energy’s Adjusted EBITDAX, Free Cash Flow and Realised Price of Crude Oil Equivalent
The use of the company's free cash flow can be broadly categorised as (1) returning to shareholders through dividend payments and share repurchases, and (2) debt reduction. Currently, the company is committed to distributing the base dividends and at least 60% of its free cash flow, net of base dividends, to shareholders.
As shown in Table 1, assuming that the company can generate free cash flow of around $300 million to $400 million per quarter, it is estimated that the company can reduce debts up to $430 million to $590 million per year and achieve a net cash position in about three years.
Table 1: Simple Financial Model
|
(USD billion) |
||
|
Free Cash Flow Per Quarter (Forecast) |
0.3 |
0.4 |
|
Free Cash Flow Per Annual (Forecast) |
1.2 |
1.6 |
|
- Base Dividends |
0.125 |
0.125 |
|
Free Cash Flow Net of Base Dividends |
1.075 |
1.475 |
|
- 60% for extra dividends and share repurchases |
0.645 |
0.885 |
|
Free Cash Flow Available to Reduce Debts Per Annual |
0.43 |
0.59 |
|
Net Debt |
1.4 |
1.4 |
|
Earliest Time to Achieve Net Cash Position |
3.3 Years |
2.4 Years |
|
Sources: Company’s Reports, iFAST Compilations Data as at 30 September 2022 |
||
Consistent Risk
Management Strategy and Superior Financial Discipline
Investors should pay attention to the hedging strategy of upstream energy companies against commodity prices. Not only does it determine the sensitivity to current spot prices, it also reflects its risk appetite, impact of the commodity upward cycles and resistance to the downward cycles. The hedging exposures and prices are indicators of the company's future potential revenue and cash flow performance.
Besides, they usually take advantage of costless strategies, like Collar (Two-Way Collar or Three-Way Collar), Futures or Fixed-price Swap. These could avoid having cash expenses due to hedging, while locking the basic profits after giving up part of the upside potential.
PDC Energy’s risk management strategy is more consistent. The company usually hedges around 30% of production ahead of time. As shown in Table 2, the company’s total hedging exposures of oil equivalent in 2022 and 2023 were around 33% and 30% of total production in the previous year, respectively. The company is less likely to significantly increase or decrease its hedging exposure due to price movements, reflecting management's superior financial discipline.
Table 2: PDC Energy’s Hedging Exposures
|
2022* |
2023** |
||||
|
Quantity in Hedging |
Weighted Average Price Floor – Ceiling / Weighted Average Swap Price |
Quantity in Hedging |
Weighted Average Price Floor – Ceiling / Weighted Average Swap Price |
||
|
Crude Oil (Mbbl) |
Collar |
5,472 |
$53.2-$67.3 |
5,937 |
$61.3-$83.1 |
|
Fixed-price Swap |
6,744 |
$44.4 |
9,804 |
$66.4 |
|
|
Natural Gas (Bbtu) |
Collar |
35,460 |
$3.1-$4.8 |
17,227 |
$3.2-$4.9 |
|
Fixed-price Swap |
33,600 |
$2.7 |
50,585 |
$3.1 |
|
|
Total Oil Equivalent in Hedging (Mbboe) |
23,726 |
/ |
27,043 |
/ |
|
|
Total Production in Previous Year (%) |
33% |
/ |
30% |
/ |
|
|
Source: Company’s Reports, iFAST Compilations *Data as at 31 December 2021 **Data as at 30 September 2022 |
|||||
Meanwhile, the company's hedging prices for crude oil and natural gas are more reasonable. It shows that it did not make any serious mistakes in the hedging strategy. Compared to some companies with poor management, they may over-hedge after a small rebound due to the panic when oil and gas prices plummeted in 2020, leading to low long-term cash flows and affecting their current profitability.
Excellent Credit Indicators with Strong Financial Position Under Stress Test
For the credit profile, PDC Energy's credit indicators are excellent. As of the end of September 2022, the company's leverage remains low, although total debt increased to $1.44 billion as a result of acquisition during the year. With a low net debt/adjusted EBITDAX of 0.5x and a net debt/free-cash flow of 0.9x, the company's leverage is much better than that of its BB-rated peers.
The company's interest coverage ratio was even high at 35.3 times and its average cost of financing fell to 6.1% given its improving credit profile.
It is highlighted that even during the 2020 oil downturn, the company still recorded a positive free cash flow of around $400 million for the year and its net debt / free cash flow was only 4.1 times in 2020. Its financial position remains strong even under the stress test (i.e. 2020).
Table 3: PDC Energy’s Main Credit Indicators
|
Dec 20 |
Dec 21 |
Sep 22 |
|
|
Total Debts (USD billion) |
1.62 |
0.96 |
1.44 |
|
Total Market Capitalisation (USD billion) |
2.05 |
4.75 |
5.57 |
|
Net Debt to Adjusted EBITDAX (times) |
1.6x |
0.6x |
0.5x |
|
Net Debt to Free Cash Flow (times) |
4.1x |
1.0x |
0.9x |
|
Net Debt to Market Capitalisation (%) |
79.1% |
19.4% |
25.1% |
|
Interest Coverage Ratio (times) |
11.2x |
19.3x |
35.3x |
|
Average Cost of Borrowings (%) |
6.3% |
6.4% |
6.1% |
|
Source: Company’s Reports, iFAST Compilations Data as of 30 September 2022 |
|||
Simple Debt Structure without Reliance on Bond Refinancing
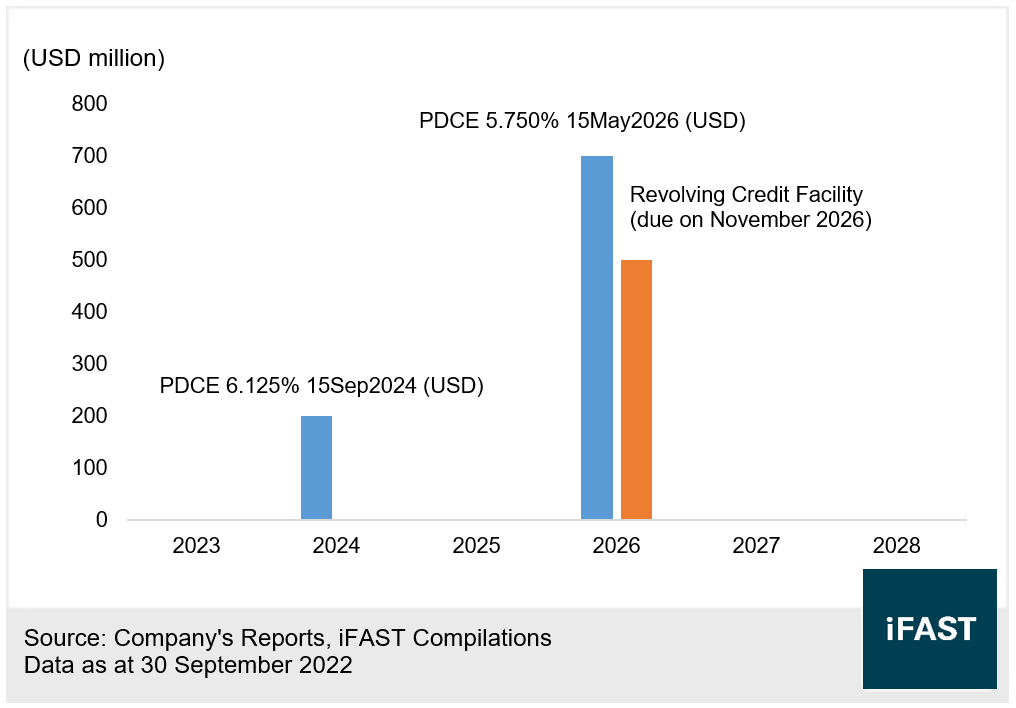
The company's debt structure is very simple. As shown in Chart 4, the company's next debt maturity is $200 million in September 2024, and the other two debts are around $750 million and a revolving credit facility of $450 million, due in May and November 2026, respectively. Other than that, the company has no other debts.
Chart 4: PDC Energy’s Debt Structure and Maturity Profile
Given its ample cash flows, it should gradually repurchase the USD bonds. With the early repayment, it should reduce the total debt and interest expenses. Ideally, the company could reach a net cash position in about three years, as assumed above. The balance sheet will continue to improve under the high oil price environment.
At the same time, the company’s one-year free cash flow is already sufficient to cover all the debts (if the company suspends dividends and shares repurchases). Thus, compared to peers in the oil industry, investors do not need to consider the refinancing risk as it does not rely on bond refinancing to repay the old bonds.
Investors may consider 2026 Bond, with Yield to Maturity of 6.8%
PDC Energy currently has a credit rating of BB (S&P), belonging to the non-investment grade.
However, the company's credit metrics are comparable to the investment grade peers. With a low leverage, strong cash flows, a much lower break-even point than its peers and a more balanced product mix, we believe that the company’s credit risk is low.
Investors may consider the bond due in 2026, which has an attractive yield to maturity of 6.8% (Table 4). Given its strong cash flow, the company might choose to exercise its redemption option in May 2024, with a yield to call of 8.0%.
Table 4: The Bond due in May 2026
|
Bond Name |
Years to Maturity |
YTM (%) |
Net YTC (%) (May 2024) |
| PDCE 5.750% 15May2026 Corp (USD) | 3.3 |
6.8% |
8.0% |
|
Source: Bondsupermart Data as of 20 January 2023 |
|||
Related Risk
The company's revenues are primarily from the sale of crude oil and natural gas, which are highly volatile. This could result in its revenues to be volatile as well.
If the company mistakenly makes significant long-term hedges during periods of low prices, this may result in low cash flows in the long-term.
The company's acquisition of peers may increase its leverage level, leading to an increase in debt repayment pressure. The company might increase the gearing and capital expenditures, resulting in an increase in total debts and a decrease in cash flows.
Conclusion
PDC Energy has geographical advantages with low breakeven points. Its operating performances are strong. The company could achieve a net cash position in around three years. The company has a consistent risk management strategy and superior financial discipline.
The company’s credit indicators are excellent, which is comparable to its investment-grade peers. The financial position remains strong under the stress test. Besides, the company has a simple debt structure, and it does not rely on bond refinancing to repay the debts.
Investors may consider the 2026 bond, with a yield to maturity of 6.8%.
Declaration: For specific disclosure, at the time of publication of this report, IFPL (via its connected and associated entities) and the analyst who produced this report hold a NIL position in the abovementioned securities.