Company background
OUE Limited ("OUE"; Bloomberg Ticker: OUE:SP) is a real estate developer and landlord with a portfolio comprising of mainly hotel, commercial and retail properties, located mostly in Singapore and Asia (see Figure 1), as well as the US. Some of its key assets include OUE Downtown (formerly DBS Building Towers) in Singapore and US Bank Tower in Los Angeles.
Figure 1: OUE’s corporate structure
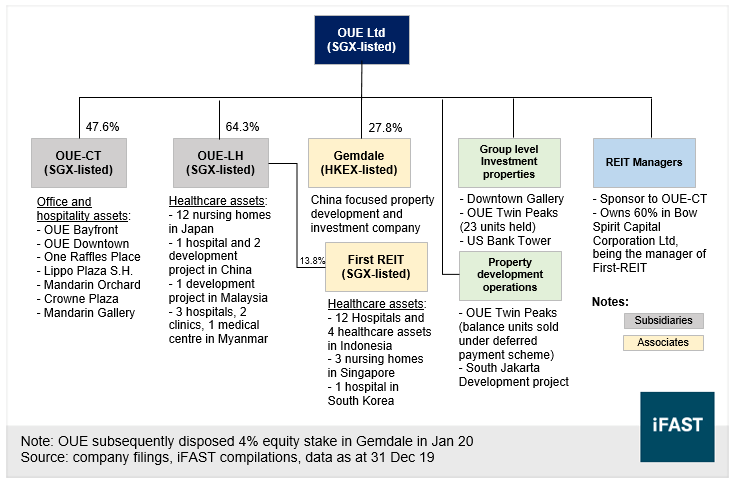
OUE is the sponsor of OUE Commercial REIT (“OUE-CT”), which merged with OUE-Hospitality Trust (“OUE-HT”) in September last year, with the latter operating as a sub-trust of the enlarged OUE-CT. Post-merger, OUE owns 47.6% of the enlarged OUE C-REIT, which has total assets of S$6.9 billion as at 31 Dec 19. The two REITs own some of the iconic properties in Singapore, such as Mandarin Gallery, Mandarin Orchard Singapore (“MOS”) and One Raffles Place.
OUE also owns a 64.3% stake in OUE Lippo Healthcare Ltd (“OUE-LH”) and a 27.8% shareholdings in HKEX-listed Gemdale Properties and Investment Corporation Limited (“Gemdale”). OUE and OUE-LH hold 60% and 40% stakes, respectively, in First REIT’s manager Bowsprit Capital Corporation Limited. As of 31 Dec 19, OUE-LH owns and manages twelve nursing homes in Japan and is expanding its hospital portfolio in China and Myanmar.
Key assets owned by OUE itself include OUE Twin Peaks (23 residential units are held for rental purposes), US Bank Tower and Downtown Gallery (the non-office portion of OUE Downtown). OUE recorded total assets of S$10.7 billion as at 31 Dec 19, of which S$6.6 billion are investment properties.
The group derives its revenue mostly from its investment properties and hospitality segments, which together contributed ~57% (S$528.8m) of total revenue (S$930.8m) in 2019. OUE’s property development segment made up ~38% of total 2019 revenue, and its healthcare and other businesses contributed the remaining 5%.
OUE is listed on the SGX-ST and its market valuation stood at S$1.13 billion at the close of yesterday. The Riady family and TIH chairman Mr Kin Chan are majority shareholders of the company. Through their interests in various entities under Lippo Group and Argyle Street Management, the two parties control about 68.7% of the OUE shares. Dr Stephen Riady and Mr Chan also sit on the board of directors as executive chairman and non-executive director respectively.
2019 Results
OUE recorded revenue of S$930.8m in 2019, up significantly from S$642.9m in the previous year. The growth was mainly due to the consolidation of results from OUE-CT post-merger, with the latter now becoming a subsidiary of the group.
The group’s development properties segment contributed the highest amount of revenue at S$349.6m, followed by the investment properties (S$287.6m) and hospitality (S$241.2m) divisions. Revenue from the development properties segment was boosted by higher revenue recognised on the sale of OUE Twin Peaks units, sold under deferred payment schemes, as well as revenue recognised on the sale of a land plot at 26A Nassim Road.
We observe a dry development pipeline at OUE as there is no new development projects launched since OUE Twin Peaks (obtained temporary occupation permit in February 2015). We see the next possible project coming from its land parcel held at South Jakarta, Indonesia, which was slated to be developed into a skyscraper comprising of office spaces and a lifestyle hotel. However, we think this project may be delayed due to weak economic conditions and lockdown measures amid the global pandemic.
Nonetheless, we note that a substantial amount of OUE’s revenue comes from recurring income sources, mostly from its investment properties held through OUE-CT. Revenue from the investment properties division was lifted higher mainly due to the inclusion of revenue from Mandarin Gallery, after the merger of OUE-CT and OUE-HT. Meanwhile, the hospitality division’s revenue was boosted by increased room occupancy at Crowne Plaza Changi Airport (“CPCA”).
Overall, OUE reported profit before tax (“PBT”) of S$369.7m. Included in PBT were other gains of S$197.3m, of which S$136.6m came from a one-off disposal gain of OUE’s entire equity stake in Aquamarina Hotel Private Limited in April 2019. Meanwhile, OUE also recorded S$170.7m of share of results of equity-accounted investees, which comprised mostly of contribution from Gemdale. During the year, OUE acquired additional stake in Gemdale, causing it to become an associate of the group from 31 May 19 onwards.
We estimated OUE’s earnings before interests and taxes (“EBIT”), excluding other gains, at S$342.5m, which were able to cover 2.0 times of its interest expenses (S$170.0m). This is a manageable ratio in our view, albeit on the low end. Using cash-flow figures, which are less impacted by accounting gains and losses, we find that net cash flow from operations (after taxes), together with dividends received from equity-accounted investees and other investments (which we assume to be recurring income), and were able to cover interest expenses by 2.9 x in 2019.
As a result of the global slowdown in economic activities under the coronavirus outbreak, OUE’s recurring income source (rentals from its underlying REITs and investment portfolio) will likely shrink substantially. Assuming adjusted EBIT (excluding other gains) were to fall by 50%, we would see interest coverage (EBIT excluding other gains over interest expenses) fall to a weak level of 1.0x.
High asset coverage supports credit profile
Despite its thin interest cover, we have a neutral outlook on OUE’s credit profile as we think its asset portfolio provides ample coverage against debt. As of 31 Dec 19, OUE carried a debt load of S$4.0 billion, up from S$3.5 billion a year ago, mainly due to additional loan drawdowns made by OUE-CT and the inclusion of OUE-HT’s loans post-merger.
Meanwhile, cash balance increased to S$477.7m from S$409.4m over the same period. The cash position was mainly boosted by asset monetisation, including the sale of an investment property and disposal of interests in equity-accounted investees. Overall, the group generated net cash from investing activities of S$381.9m (2018: S$450.8m outflow). In addition, net cash from operating activities was much higher at S$396.6m (2018: S$119.4m), mainly lifted by S$314.4m from the sale of development properties (26A Nassim Road and OUE Twin Peaks units).
Thanks to the improved cash level, OUE’s net gearing (net debt over equity) improved slightly to 0.57x (4Q18: 0.60x) despite its increased debt load. As at 31 Dec 19, OUE had given guarantees to banks in respect of banking facilities granted to a wholly-owned subsidiary, of which the maximum exposure was S$255.3m. Including corporate guarantees as debt, we find OUE’s adjusted net gearing still at a manageable level of 0.62x.
As a result of the merger between OUE-CT and OUE-HT, OUE’s S$6.1 billion of equity base included S$2.0 billion of non-controlling interests (“NCI”), which were higher by S$843.0m as compared to 2018. Excluding NCIs, we find OUE’s net gearing at 0.86x (4Q18: 0.78x).
OUE has short-term debt of S$1.3 billion due this year, which is significant relative to its S$439.4m of cash (excluding pledged deposits). The group’s short-term borrowings include S$0.6 billion and S$0.2 billion of debt at OUE-CT and OUE-LH respectively, which will mature in 1H20 and we think are supported by the subsidiary’s assets. Per OUE, the group is in progress of negotiating for the refinancing of the remaining S$0.5 billion owed by its wholly-owned subsidiaries.
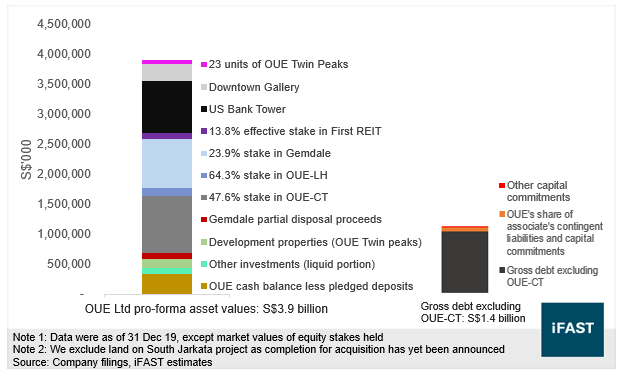
While we are wary of OUE’s tight liquidity, we took comfort from the group’s many assets that can be monetised to alleviate liquidity needs if need be. As of 31 Dec 19, OUE carried S$6.6 billion of investment properties, S$1.8 billion of property, plant and equipment (mostly pertains to MOS and CPCA held at OUE-CT), S$152.4m of development properties and S$921.6m of interests in equity-accounted investees. Comparing the group’s asset portfolio against its total borrowings of S$4.0 billion, we think there is room for it to raise liquidity.
We believe the bulk of OUE’s asset base, namely the S$6.6 billion of investment properties, are held by OUE-CT. The REIT will have to abide to the regulatory leverage limit (debt over assets) of 50%. Substantial transactions of properties at the underlying REIT are also subject to approval of minority unitholders. While this may raise the barrier to raise financing, we take comfort that other assets are able to provide a comfortable cushion to its debt, with an asset coverage ratio of 2.8x (see Figure 2).
Figure 2: Asset coverage analysis
Impact from Covid-19
The global pandemic will likely adversely affect OUE’s revenue in the coming quarters, in particular OUE-CT’s rental income, which is the main earnings contributor in the property investments and hospitality segments. Nonetheless, we take comfort that as of 31 Mar 20, 59.4% of OUE-CT’s revenue is contributed by its office properties, which we believe should be resilient compared to its retail and hospitality assets. The latter two sectors generate 18.9% and 21.7% of the REIT’s revenue respectively.
Per OUE-CT, it has sought alternative sources of demand for its hotel rooms (at CPCA and MOS), including hosting guests on self-isolation and workers affected by lockdown measures. A minimum rent component of S$67.5m under the master lease agreements of its hotels may also help to mitigate downside risks.
In addition, the REIT is also capitalising on the current weak operating environment to re-brand MOS as Hilton Singapore Orchard, with asset enhancement works to commence in 2Q20 and expected to complete by the end of next year. OUE-CT will incur approximately S$90.0m of capital expenditure, to be fully funded by bank loans.
Meanwhile, the REIT’s retail segment (mainly Mandarin Gallery) will likely take the biggest hit as Singapore has imposed lockdown measures closing all non-essential businesses until 1 Jun 20. Both OUE and OUE-CT have provided rental reliefs to their retail tenants, including waiver of gross rental for April and rental reductions between 15-25%.
We speculate that OUE may pursue further asset monetisation activities given our anticipation of weaker revenue and tighter liquidity in the near future. That said, given its comfortable debt-to-asset coverage, we remain neutral on OUE’s credit outlook notwithstanding the broader economic downside risks.
We are also cautiously optimistic that OUE-CT is able to meet debt obligations on its own. As at 31 Mar 20, OUE-CT’s short-term borrowings total S$597.0m, of which S$426.1m are secured debt that we assume the REIT would be able to rollover. The REIT reported a leverage ratio of 40.2%, which allows a debt head room of S$1.3 billion to the revised regulatory limit of 50%. However, we also expect OUE-CT to register revaluation losses given the adverse operating conditions facing its properties, which may limit OUE-CT’s ability to take advantage of a widened debt headroom.
We like the OUESP 3.75% ’22s
Among OUE’s two straight bonds, we see more value in the nearer dated OUESP 3.750% 17Apr2022 Corp (SGD), which is indicating an ask yield to maturity (“YTM”) of 3.96% (Z-spread: 359bps). This offers a yield pick-up of 23bps against the OUESP 3.550% 10May2023 Corp (SGD), which has an ask YTM of 3.73% (Z-spread: 331bps) and a roughly one-year longer tenor.
The OUESP 3.75%’22s also compare favourably with peer credits. As a reference, GuocoLand Limited’s GUOLSP 4% ’22s are indicating at an ask YTM of 3.65% (Z-spread: 329bps). We think GuocoLand is a good comparable with its similar size of S$11.0 billion in assets, constituting mainly of investment and development properties. We prefer the OUESP 3.75% ’22s for their better pricing and OUE’s lower gearing.
Table 1: Relative valuation
|
Issuer Ticker |
Coupon rate (%) |
Maturity date |
Ask price |
Ask YTM (%) |
Z-spread (ask; bps) |
Debt/Assets (%)* |
Net debt/equity* |
|
OUECT |
3.03 |
05-Sep-2020 |
100.30 |
2.00 |
176 |
40.2 |
0.67x |
|
GUOLSP |
3.62 |
30-Mar-2021 |
100.69 |
2.79 |
240 |
47.5 |
0.97x |
|
FPLSP |
3.95 |
07-Oct-2021 |
101.26 |
3.01 |
264 |
47.8 |
0.95x |
|
GUOLSP |
4.00 |
31-Jan-2022 |
100.56 |
3.65 |
329 |
47.5 |
0.97x |
|
OUESP |
3.75 |
17-Apr-2022 |
99.62 |
3.96 |
359 |
37.2 |
0.57x |
|
GUOLSP |
3.85 |
15-Feb-2023 |
100.42 |
3.69 |
328 |
47.5 |
0.97x |
|
OUESP |
1.50 |
13-Apr-2023 |
97.38 |
4.21 |
812 |
37.2 |
0.57x |
|
OUESP |
3.55 |
10-May-2023 |
99.50 |
3.73 |
331 |
37.2 |
0.57x |
|
GUOLSP |
3.40 |
10-Aug-2025 |
99.08 |
3.59 |
305 |
47.5 |
0.97x |
|
FPLSP |
4.25 |
21-Apr-2026 |
100.22 |
4.21 |
362 |
47.8 |
0.95x |
|
*As at 31 Dec 19 Source: Bloomberg Finance L.P., pricing data are indicative only (as of 19 May 20) |
|||||||
Declaration:
For specific disclosure, at the time of publication of this report, IFPL (via its connected and associated entities) and the analyst who produced this report hold a NIL position in the abovementioned securities.