(Picture depicts The M at Middle Road, taken from company's annual report)
- Wing Tai Holdings’ operating results were boosted by properties’ sales with FY20’s operating profits increasing by 83%.
- The Group also has an extremely healthy balance sheet and low gearing ratios.
- Its two perps are yielding at about 4% - providing a fairly attractive yield given its credit profile.
The world is experiencing a property craze and this has been instrumental for Wing Tai Holdings – a property developer and lifestyle company. Its upcoming major development – The M at Middle Road (pictured above) is primely located in Singapore’s central district and has been driving its revenue strongly.
Financial performance
For the financial year ending June 2020 (“FY20”), Wing Tai Holdings (“WTH”) saw operating profit increased by 83% to SGD 44.97m on the back of higher revenue from additional units sold in Le Nouvel Ardmore and the progressive sales recognised from The M at Middle Road in Singapore.
Despite the large increase in operating profit, profit before tax (“PBT”) still declined by 42% in FY20 due to lower profits of SGD 5.77m (-89% YoY) from the Group’s share of profits of associated and joint venture companies – Wing Tai Properties Limited (“WTP”), Uniqlo (Singapore) Pte. Ltd. and Uniqlo (Malaysia) Sdn. Bhd. WTH has a 33% stake in Wing Tai Properties Limited. It has a 45% and 49% interest in Uniqlo (Malaysia) Sdn. Bhd. and Uniqlo (Singapore) Pte. Ltd. respectively.
Even though contributions from associates and joint venture firms declined in FY20, the share of profits from associated and joint venture companies improved in 1HFY20 as it increased 8% YoY to SGD 38.54m.
As mall traffic decreased due to social distancing measures, Uniqlo (Singapore) Pte. Ltd. saw lower revenue but still managed to churn out a profit for FY20. Meanwhile, Wing Tai Properties was hit by fair value losses on investment properties of SGD 37.3million resulting in a total loss of SGD 62.71m for FY20.
In 1HFY21 ending 31 Dec 2020, total revenue climbed 33% to SGD 243.42m on the back of robust property development sales. The Group continued to perform strongly with operating profit increasing by 180% mainly due to sales from the Le Nouvel Ardmore and the M at Middle Road. Operating expenses also declined by 21% in 1HFY21, and this led to a 74% gain in total profit to SGD 57.55m.
Table 1: Wing Tai Holdings’ selected income statement items
|
SGD'000 |
FY20 |
YoY (%) |
1HFY21 |
YoY (%) |
|
Revenue |
371,026 |
15 |
243,418 |
33 |
|
Cost of sales |
-190,753 |
9 |
-143,496 |
60 |
|
Gross profit |
180,273 |
22 |
99,922 |
7 |
|
Expenses |
-135,196 |
-10 |
-62,231 |
-21 |
|
Operating profit |
44,973 |
83 |
37,691 |
180 |
|
PBT |
26,827 |
-42 |
72,292 |
83 |
|
Total profit |
15,708 |
-68 |
57,546 |
74 |
Source: Company's financial statements, iFAST compilations
Projects in the pipeline
As of the end of the reporting period ending 31 Dec 2020, WTH recorded SGD 835.69m of development properties and SGD 801.28m of investment properties on its balance sheet. Some of its larger developments would understandably include Le Nouvel Ardmore at Ardmore Park, Le Nouvel KLCC and Jesselton Hills at Pulau Pinang, Malaysia. Other major projects such as The M at Middle Road have started construction and are projected to be completed in 2022.
According to EdgeProp, Wing Tai’s joint venture with Keppel Land in The Garden Residences is virtually fully sold with only 2 of 613 units remaining. Potential revenue from properties development could be coming from Malaysia with Phase 4A of Jesselton Hills (aka Garden Villas) only 30% sold, and Garden Terraces with 65% sold as of 30 June 2020.
Credit and liquidity highlights
Furthermore, Wing Tai has ample liquidity with SGD 786.51m of cash and SGD 726.22m of borrowings at the end of December. Gearing, measured by its debt over total assets ratio is also extremely low (1HFY21: 16.22%), giving it room to increase its leverage and pursue new projects if opportunities arise.
Given how property prices have been increasing and talks of cooling measures have been circulating, the Group may be waiting for a more opportune time to acquire land for further real estate development.
Table 2: WTH’s balance sheet and credit ratios
|
SGD'000 |
Dec-20 |
Jun-20 |
|
Current assets |
||
|
Cash and cash equivalents |
786,506 |
605,480 |
|
Trade and other receivables |
39,725 |
111,590 |
|
Inventories |
8,704 |
14,679 |
|
Development properties |
835,693 |
993,584 |
|
Other assets |
27,680 |
17,027 |
|
Assets held for sale |
68,062 |
|
|
1,698,308 |
1,810,422 |
|
|
Non-current assets |
||
|
Trade and other receivables |
121,918 |
134,673 |
|
Investments in associated and joint venture companies |
1,713,772 |
1,764,891 |
|
Investment properties |
801,279 |
792,346 |
|
PPE |
89,720 |
91,608 |
|
Other assets |
53,703 |
56,872 |
|
2,780,392 |
2,840,390 |
|
|
Current liabilities |
||
|
Trade and other payables |
69,765 |
57,842 |
|
Current income tax liabilities |
39,037 |
33,418 |
|
Borrowings |
85,942 |
|
|
Other liabilities |
19,139 |
117,395 |
|
213,883 |
208,655 |
|
|
Non-current liabilities |
||
|
Borrowings |
640,280 |
787,740 |
|
Other liabilities |
60,341 |
69,072 |
|
700,621 |
856,812 |
|
|
Total debt/total assets |
~16.22% |
~16.94% |
|
Total debt/total assets (incl. perps) |
~22.83% |
~23.31% |
|
Net gearing ratio (incl. perps) |
~7.23% |
~14.55% |
Source: Company’s financial reports, iFAST estimates
Peer comparison
Among property developers such as GLL IHT Pte. Ltd. (“GLL”), Frasers Property Treasury Pte. Ltd. (“FPL”), OUE Ltd., and its HK associate – Wing Tai Properties, WTH has the one of the lowest gearing ratios – second to WTP, and has a decent interest coverage ratio too. This interest coverage ratio is calculated as the trailing twelve month (“TTM”) EBIT divided by interest expense and the developer’s EBIT is more than twice its interest cost.
Table 3: Credit ratios of Singapore property developers
|
WTH |
WTP |
GLL |
FPL* |
OUE |
|
|
TTM adj. EBIT/interest (x) |
~2.97 |
2.32 |
0.94 |
1.88 |
1.71 |
|
TTM adj. EBIT/interest incl. perps (x) |
~2.02 |
1.38 |
0.80 |
1.79 |
1.71 |
|
Total debt/total assets |
~16.22% |
11.76% |
52.61% |
51.70% |
36.40% |
|
Total debt/total assets (incl. perps) |
~22.83% |
15.82% |
56.29% |
55.16% |
36.40% |
|
Net gearing ratio (incl. perps) |
~7.23% |
15.89% |
112.63% |
132.80% |
50.95% |
Source: Company financial statements, Bloomberg Finance L.P.
estimates, iFAST estimates
Data as of 31 Dec 2020. *FPLSP data as of 30 Sep 2020.
Relative valuation
Comparing credits within the Singapore real estate developer sector, we observed that the GUOLSP 4.600% Perpetual Corp (SGD) is trading at a lower yield as compared to the two perpetual bonds issued by WTH and the FPLSP 3.950% Perpetual Corp (SGD).
Figure 1: Bond yields of SGD credits among Singapore developers
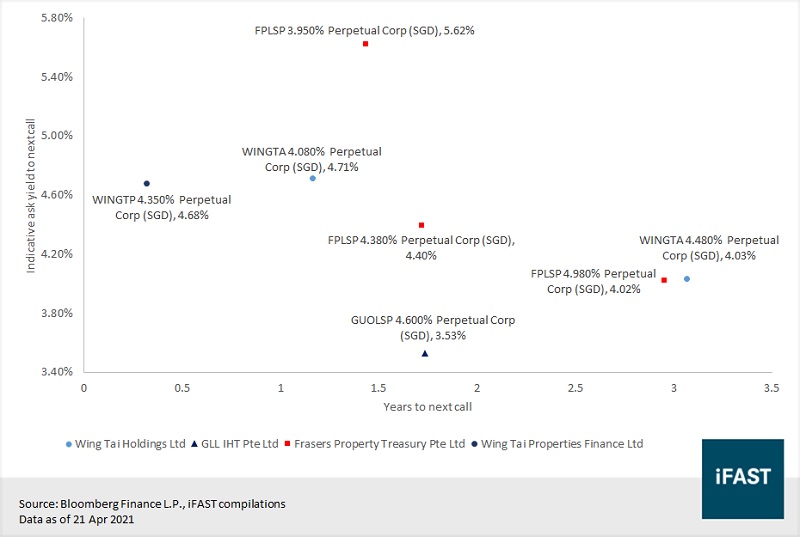
The GUOLSP 4.600% Perpetual Corp (SGD) is issued by GLL IHT Pte. Ltd., and has a reset
rate based on a 100 basis points (“bps”) step up margin, initial spread and the
SGD 7-year swap offer rate (“SOR”), whereas the other perps are based on the prevailing
SGD 5-year SOR. Investors are thus pricing in a high probability of GLL calling
its perp.
On the contrary, investors are pricing in a lower probability of Frasers calling the FPLSP 3.950% Perpetual Corp (SGD) as it will reset to a lower rate compared to the other two perps. Issuers will likely call upon resets and/or step-up, when higher rates (versus then prevailing refinancing conditions) provide an incentive for the issuer to redeem the perpetual notes.
Table 4: Reset rates based on current swaps
|
Reset date |
Reset rate (%) |
|
|
WINGTA 4.080% Perpetual Corp (SGD) |
28/6/2022 |
~3.315 |
|
GUOLSP 4.600% Perpetual Corp (SGD) |
23/1/2025 |
~4.854 |
|
FPLSP 3.950% Perpetual Corp (SGD) |
5/10/2022 |
~3.190 |
Source: Bloomberg Finance L.P., iFAST estimates
Note: Rates are computed using corresponding SORs on 22 Apr 2021
Recommendation
Last August, Wing Tai Properties did not redeem the WINGTP 4.350% Perpetual Corp (SGD) as the reset date falls on 24 Aug 2027. Investors may be wondering if WTH will follow suit, but they should not be too worried.
If not redeemed on 28 Jun 2022, the WINGTA 4.080% Perpetual Corp (SGD) will potentially have a new distribution rate of mid-3%, thereby lowering the Group’s interest expense. Even with a mid-3% yield, the perps would still be appealing given WTH’s adequate liquidity and financial ratios. The yield-to-call (“YTC”) of 4.71% on 21 Apr 2021 for the WINGTA 4.08% perps is also attractively priced, even if WTH were to not call the notes. A drop in prices due to a non-call event could be an opportunity to invest in the notes. Additionally, we think that WTH will not have difficulty accessing the debt market to refinance the notes.
Prices of the WINGTA 4.480% Perpetual Corp (SGD) also look fair at this juncture. The WINGTA 4.48% perp has a higher yield-to-worst (“YTW”) than the WINGTA 4.08% perp although the YTC for the latter exceeds the former. Assuming that both perps are called in mid-2024, their YTCs are very similar too. Thus, all things considered, we believe that both WTH’s perpetuals are offering investors a decent return at its current level of creditworthiness.
Declaration: For specific disclosure, at the time of publication of this report, IFPL (via its connected and associated entities) holds a position in FPLSP 4.980% Perpetual Corp (SGD) and the analyst who produced this report hold a NIL position in the abovementioned securities.
Our podcast series, Yield Hunters, is available on Spotify and iTunes Podcasts and Google Podcasts. We share our thoughts on new bond issues and hold discussions on the fixed income space. Listen to our latest episode below and follow us!