- March inflation prints show energy pass-through, with headline CPI accelerating while core inflation remains more muted across major markets.
- Higher energy costs may spill into logistics, airfares, fertiliser, plastics, packaging and daily necessities, though pass-through will likely occur with a lag.
- UAE’s OPEC exit may eventually boost supply, but unresolved conflict and Hormuz disruptions have kept oil prices elevated.
- Investors should monitor crude prices, refining spreads, gasoline, diesel, CPI momentum and inflation breakevens for signs of broader inflation pressure.
- We still favouring short- to medium-duration exposure as renewed inflation risks could revive policy tightening concerns.
At the end of March, we wrote that the interest rate cycle was turning less supportive, as renewed inflationary pressures emerged from the Middle East conflict. Since then, there have been occasional ceasefires and talks, but neither side has been able to force a durable settlement. Furthermore, the UAE’s departure from OPEC has not triggered a sustained fall in oil prices; in fact, oil prices are higher since the announcement, driven by a renewed escalation in the conflict.
This matters because the conflict is turning into a rapidly changing inflation story. March inflation data across major economies are already showing signs of energy price pass-through. For now, the shock remains concentrated mostly in headline inflation, but the key risk is that higher energy costs begin feeding into core goods and services over the coming months.
Energy shock is coming through
Headline inflation for March, released in April, has already moved higher across major economies, supported by higher energy inflation (Table 1). Across the major markets shown below, headline CPI inflation (y/y) accelerated from February to March, while core CPI inflation was more muted, suggesting outsized impacts arising from energy and food.
Furthermore, we also observe sizeable m/m increases in energy prices in countries where such data is available. The US saw energy inflation of >10% on both y/y and m/m metrics, consistent with the sharp rise in live diesel and gasoline prices that we had highlighted throughout March. Other markets also experienced elevated energy inflation. Japan appeared more insulated, with energy prices rising 3.9% m/m but still falling -5.7% y/y, partly due to the dampening effect of fuel subsidies.
We think the March energy inflation figures mainly capture first-order effects. These are the most direct channels, such as higher gasoline, diesel, heating oil, and electricity costs. However, second-order effects typically appear with a lag. These could include transportation and logistics, or possibly travel cost (e.g. airfares) – higher fuel and energy prices would raise the costs for such companies, which may then be passed on to consumers.
(For instance, in Singapore, electricity tariffs are set based on average gas prices in the previous quarter. Hence, we would start to see the effect on electricity prices only in 2Q26, and possibly to a fuller extent only from 3Q26 onward.)
The exact timing and extent of cost pass-through will differ across countries, making it difficult to estimate precisely. However, we see sizable risks that second-order effects have not yet fully appeared in inflation data. This uncertainty raises the hurdle for near-term rate cuts, as central bankers may prefer to wait for clearer evidence on the inflation trajectory before acting.
Table 1: Headline inflation has moved higher across major economies
| Inflation | Headline CPI (Feb) | Headline CPI (Mar) | Core CPI (Feb)* | Core CPI (Mar)* | Energy CPI (Mar, y/y) | Energy CPI (Mar, m/m) |
| US | 2.4% | 3.3% | 2.5% | 2.6% | 12.6% | 10.9% |
| Euro Area | 1.9% | 2.6% | 2.4% | 2.3% | 5.1% | 7.0% |
| UK | 3.0% | 3.3% | 3.2% | 3.1% | 5.0% | 5.4% |
| Canada | 1.8% | 2.4% | 2.0% | 1.9% | 3.9% | 13.1% |
| Australia | 3.7% | 4.6% | 3.3% | 3.3% | - | - |
| Japan | 1.3% | 1.4% | 2.6% | 2.5% | -5.7% | 3.9% |
| China** | 1.3% | 1.0% | 1.8% | 1.1% | - | - |
| Singapore*** | 1.2% | 1.8% | 1.4% | 1.7% | - | - |
| Source: Bloomberg, BLS, Eurostat, UK ONS, Statistics Canada,
ABS, Japan's MOF, NBS, DOS, iFAST compilations, iFAST estimates. Data as of
28 Apr 2026. *In most markets, core inflation primarily excludes food and energy. For Australia, we use trimmed-mean inflation as a proxy for core inflation. **China authorities do not publish a clean 'energy CPI' aggregate. ***In Singapore, core inflation excludes accommodation and private transport. MAS & MTI do not publish a clean 'energy CPI' aggregate. |
||||||
Pass-through to prices of food and other daily necessities
Food prices are another important second-order channel to watch. Fertilisers (especially nitrogen-based ones) are produced using natural gas. Gulf nations are major fertiliser exporters supported by their access to low-cost gas. Furthermore, a significant proportion of fertiliser flows through the still-blockaded Strait of Hormuz. A sustained disruption to fertiliser supply chains could raise farmers’ input costs, which may eventually feed into higher food prices faced by consumers.
(UN estimates that 35% - 45% of world urea exports, and 30% of ammonia exports, transit through the Strait of Hormuz.)
More broadly, higher freight costs arising from (i) higher fuel costs; and/or (ii) shipping route disruptions, could push imported inflation up, especially for net food-importing countries. The cost of operating heavy agricultural machinery could also adjust upward due to higher fuel or diesel costs. We are already seeing an upward shift in various agricultural futures prices (Chart 2), which perhaps is a sign of incoming food inflation over the coming months.
Oil and gas are also key inputs for petrochemicals, which are used in many daily necessities. This includes plastic packaging which covers a wide range of items like bottles, food containers, and plastic bags. It is also used in detergents and shampoos, as well as different clothing items (e.g. polyester shirts), or even home essentials like PVC pipes. The bottom line is: this energy disruption has the potential to affect many items in the inflation basket apart from just energy.
We acknowledge that companies which already locked in prices of raw materials pre-conflict may opt to gradually raise prices over time. It also depends on companies’ abilities to pass on costs to consumers, versus absorbing them into their own margins. Ultimately, the timing and extent of pass-throughs into the different components of inflation is uncertain and may not be immediate, but the direction of risk is clearly inflationary to us.
Table 2: Agriculture futures prices have moved up
| Agriculture Futures (US cents) | Corn (per bushel) | Wheat (per bushel) | Soybean (per bushel) | Sugar (per pound) |
| End-2026 (Pre-War) | 470 | 627 | 1,128 | 14.2 |
| End-2026 (4 May) | 505 | 678 | 1,197 | 15.8 |
| Change | +35 (+7%) | +51 (+8%) | +69 (+6%) | +2 (+11%) |
| End-2027 (Pre-War) | 478 | 654 | 1,097 | 15.0 |
| End-2027 (4 May) | 511 | 723 | 1,150 | 16.5 |
| Change | +33 (+7%) | +69 (+11%) | +53 (+5%) | +1 (+10%) |
| Source: Bloomberg, iFAST compilations, iFAST
estimates. Data as of 04 May 2026. We use Dec 2026/2027 futures for corn and wheat, Nov 2026/2027 futures for soybean, and Oct 2026/2027 futures for sugar. |
||||
What the UAE exit (from OPEC) means for oil markets
The UAE’s decision to leave OPEC adds another layer of uncertainty to the oil market. In theory, this could eventually be disinflationary if the UAE increases production outside of OPEC quotas. The UAE has long pushed for higher production allowances, and its exit gives it greater flexibility to pursue a more independent output policy.
However, the near-term impact is less straightforward. The UAE’s exit comes at a time when the Middle East conflict remains unresolved, and the Strait of Hormuz remains essentially closed. Importantly, the UAE’s geographical position means that it is heavily reliant on an open Strait - higher production would still not be able to be exported if the Strait remains closed. This helps explain why oil futures did not fall meaningfully after the announcement, and actually ended the day higher (the announcement came around mid-day).
For us, we think the inflation story remains intact despite the UAE’s exit from OPEC. Even if the UAE exit eventually increases supply, the current shock has already moved into official inflation data through higher energy prices.
Key inflation indicators
Investors have several datapoints to monitor when assessing whether the energy shock remains contained or broadens into a more persistent inflation problem.
1. Commodities-related prices
Brent or WTI (depending on the market) will remain the most immediate indicators of energy price pressures. Oil prices fell in late April but rebounded in recent days, and importantly, remain well above pre-conflict levels, while futures curves are also pointing toward oil prices staying elevated for an extended period (Chart 1).
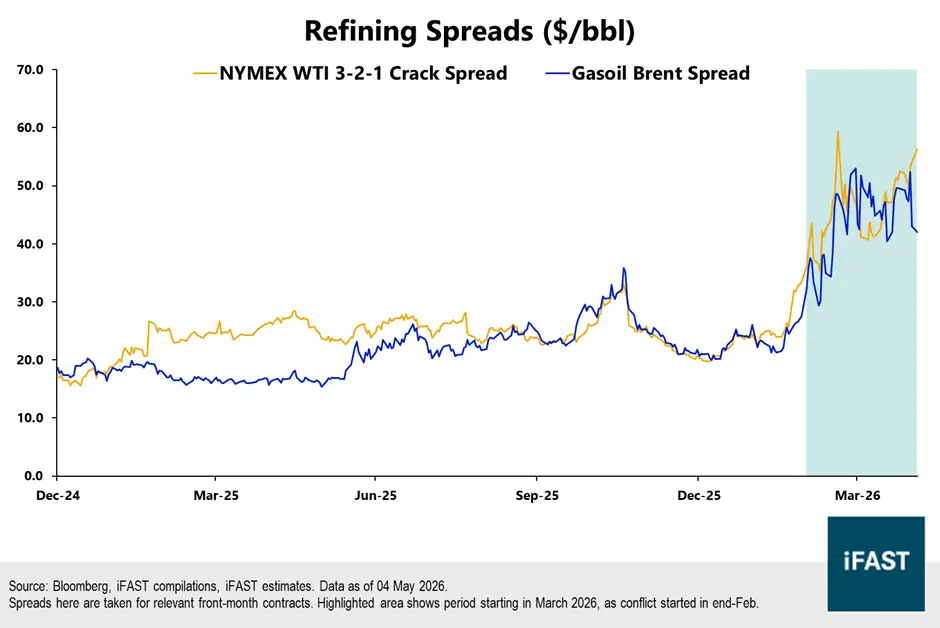
Refining spreads are also important, as consumers and businesses ultimately buy refined oil products rather than raw crude. Refining spreads recently shot up alongside Brent / WTI crude prices because of tighter refining capacity and could further amplify the oil shock (Chart 2). In other words, even if crude prices stabilise, elevated refining spreads could keep energy price pressures intact.
Chart 1: Brent futures curve continues to point toward higher prices for some time
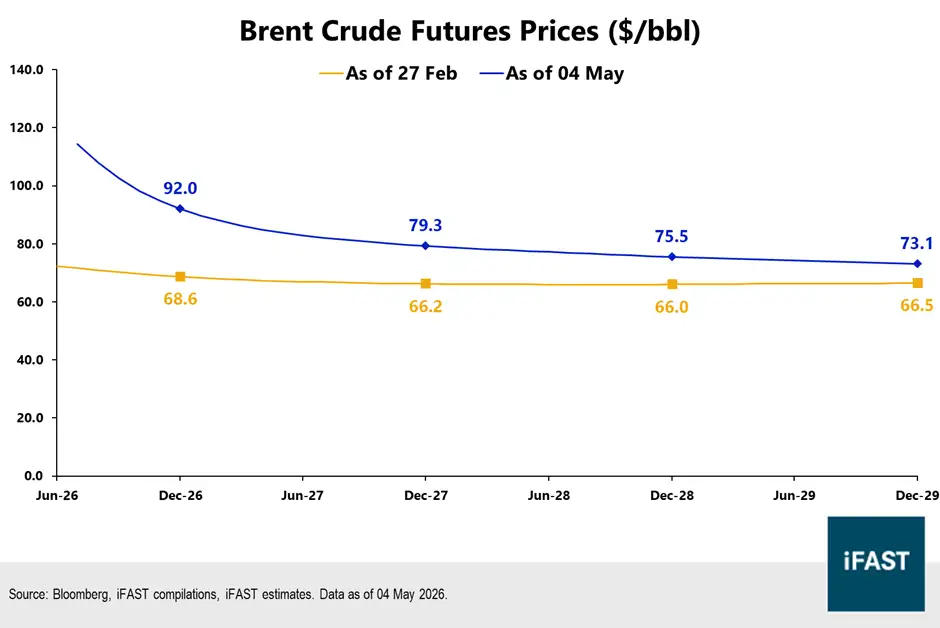
Chart 2: Higher refining spreads could further amplify the energy shock
2. Energy prices directly faced by consumers
Direct fuel indicators would also be important, as these feed directly and quickly into CPI (first-order effects). This includes household transport costs (e.g. gasoline) and logistics costs (e.g. diesel), which would then affect inflation via first and second-order effects.
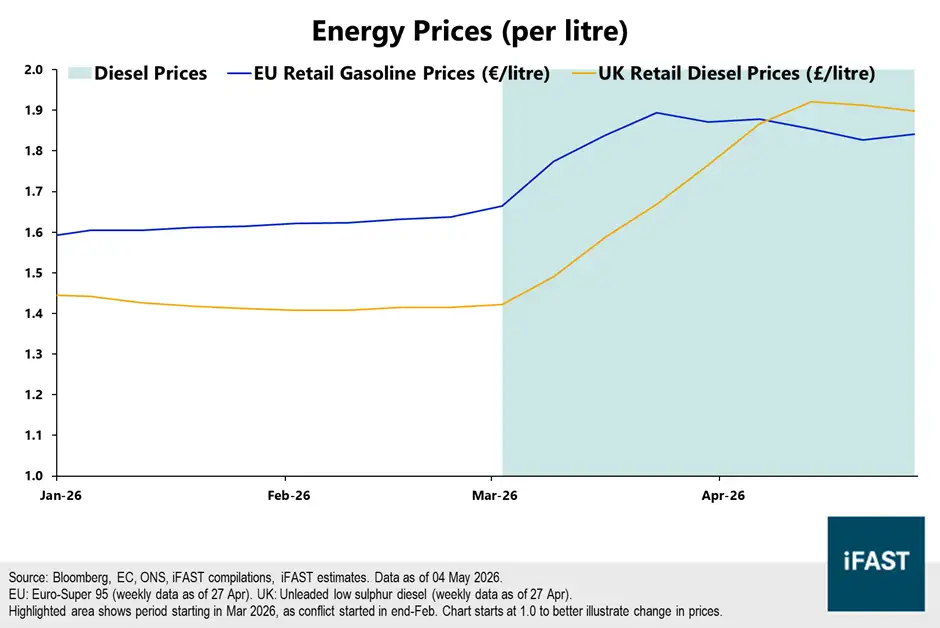
Furthermore, such data tends to be available on a more frequent basis (e.g. daily / weekly) compared to inflation, which instead tends to be a lagging monthly indicator. Examples include US-based metrics from AAA and EIA, where gasoline and diesel prices already shot up prior to the CPI reading coming out (Chart 3); outside the US, various markets provide different metrics like the EU’s Weekly Oil Bulletin, or the UK’s unleaded petrol prices (Chart 4).
Chart 3: US consumers are already facing higher gasoline and diesel prices …
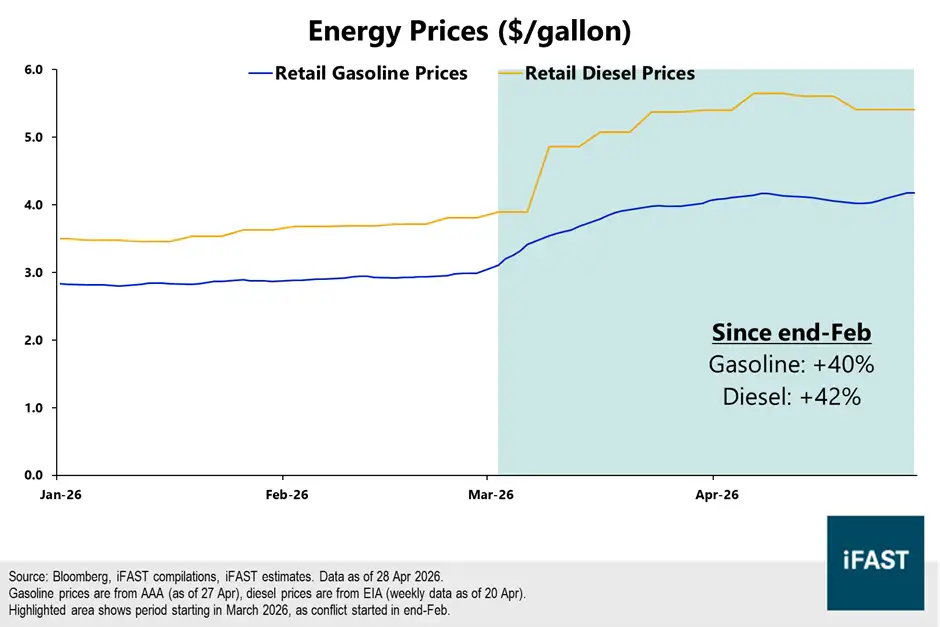
Chart 4: … as are EU and UK consumers
3. CPI readings (incl. April & May 2026)
CPI readings will remain the key confirmation signal for central banks, even though they are more lagging than direct fuel or commodity prices. It would also be important to look at core readings (which exclude energy), not only to check on second-order inflation impacts, but also as they generally provide a better sense of ‘underlying’ inflation for central banks. Month-on-month CPI readings would be especially important as they can provide a timelier signal of whether inflation momentum is re-accelerating.
4. Inflation expectations, including breakevens
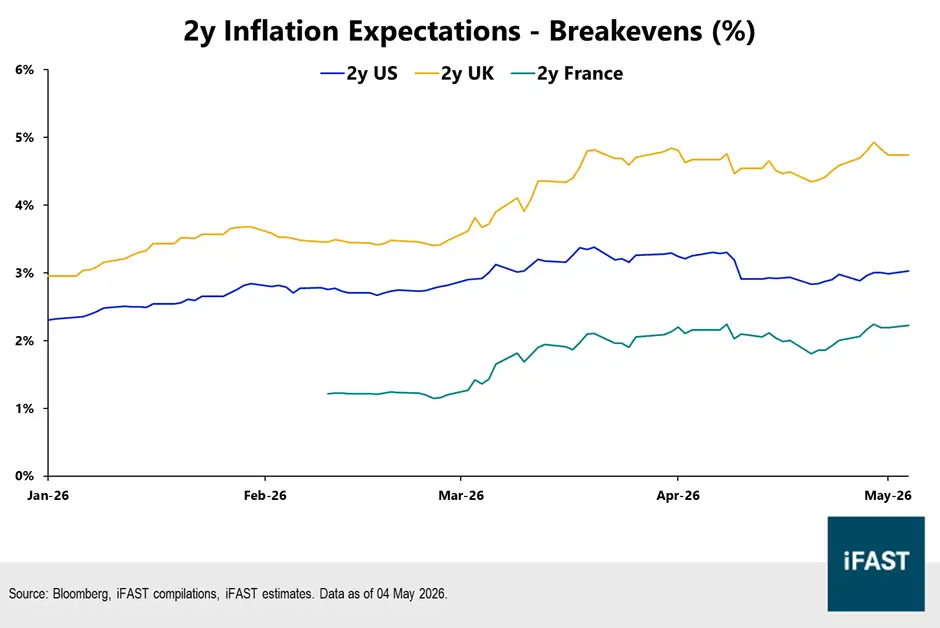
Finally, we would look at inflation expectations, including survey expectations and breakevens (Chart 5). A noticeable increase in longer-term inflation expectations could potentially prompt even greater cautiousness from central banks. Even an increase in shorter-term inflation expectations could play into central banks’ broader cautiousness over future policymaking (especially cautious regarding further cuts).
(Note: Breakevens are market-based estimates of inflation expectations, usually calculated as the yield difference between nominal sovereign bonds and inflation-protected sovereign bonds of the same maturity.)
Chart 5: 2-year inflation breakevens have crept up across the UK, Germany, and France
What this means for bond investors
We reiterate our view that we are witnessing a shift in the interest rate trajectory – global rate hikes are now on the cards, anchored by renewed inflationary pressures (Chart 6). As described above, we are beginning to see the initial effects coming through in March inflation data, but there remains a sizeable risk of inflation re-accelerating further, including due to second-order effects.
In this situation, we continue to prefer short to medium duration bonds across most bond markets, including USD and SGD. Short-duration bonds can provide consistent returns because of their low sensitivity to rates fluctuations, with USD yields in particular remaining attractive (high-3%). Medium-duration bonds can provide some yield pickup over shorter-duration bonds for those comfortable with holding to maturity. We include some of our recommendations below (Table 3).
Chart 6: Markets are still expecting global rate hikes
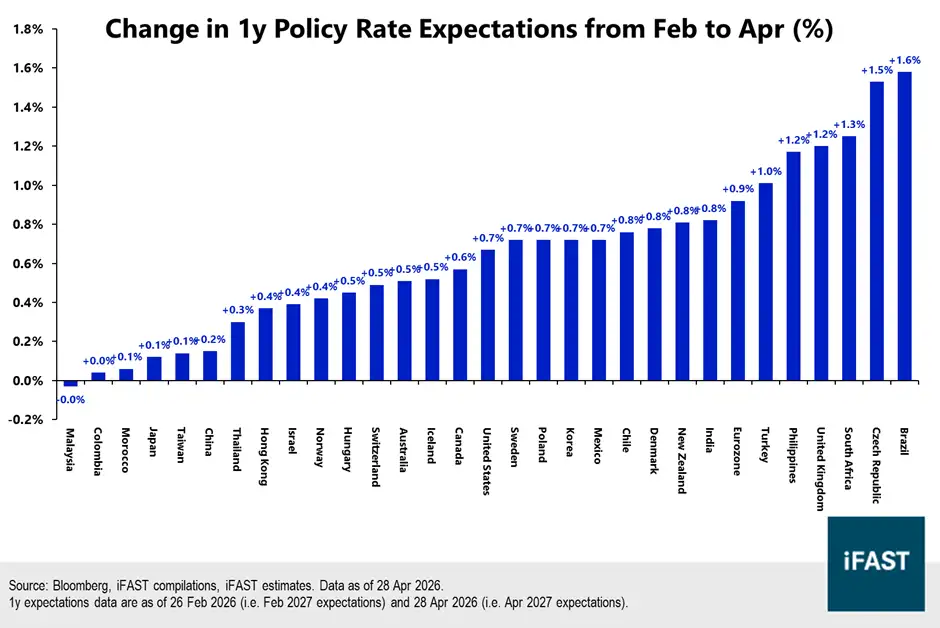
Table 3: Bond recommendations
| Bond Name | Call or Reset / Maturity Date (Years to Call or Reset / Maturity) |
Ask Price | Yield to Worst (%) | Credit Rating (S&P / Moody's / Fitch) |
| DB 5.882% 08Jul2031 Corp (USD) | 08 Apr 2030 / 08 Jul 2031 (3.9 / 5.2) |
102.14 | 5.26% | BBB- / Baa3 / BBB |
| STANLN 4.300% 19Feb2027 Corp (USD) | - / 19 Feb 2027 (- / 0.8) |
100.02 | 4.25% | BBB / Baa2 / BBB+ |
| VALEBZ 3.750% 08Jul2030 Corp (USD) | 08 Apr 2030 / 08 Jul 2030 (3.9 / 4.2) |
96.47 | 4.69% | BBB / Baa2 / BBB+ |
| FWDGHD 5.252% 22Sep2030 Corp (USD) | - / 22 Sept 2030 (- / 4.4) |
100.40 | 5.14% | - / Baa2 / BBB- |
| Source: Bloomberg, Bondsupermart, iFAST compilations. Data as of 07 May 2026. | ||||
Declaration: For specific disclosure, at the time of publication of this report, IFPL (via its connected and associated entities) holds positions in STANLN 4.300% 19Feb2027 Corp (USD), VALEBZ 3.750% 08Jul2030 Corp (USD), and FWDGHD 5.252% 22Sep2030 Corp (USD). The analyst who produced this report hold NIL positions in the abovementioned securities.