In its 1HFY2026 earnings report, Lloyds Banking Group (Lloyds) continued to demonstrate a robust earnings profile, with:
- Strong net income growth: In 1HFY2026, Lloyds recorded high-single-digit growth in total income, which increased by 9.3% YoY to £9,747m. This was supported by higher structural hedge income and stronger growth in interest-earning assets, resulting in an 8.3% YoY increase in net interest income to £7,278m. The bank also reported a slight improvement in its net interest margin to 3.19% (1HFY2025: 3.04%).
Looking ahead, the Bank of England’s relatively hawkish stance could keep medium-term interest rates elevated, allowing Lloyds to reinvest maturing structural hedges at potentially higher yields and further support structural hedge income.
- Growth in other income: This was further supported by stronger customer activity and improved performance from investment initiatives, with other income, comprising fee and commission income and investment-related income, increasing by 10.5% YoY to £3,310m.
- Disciplined cost management: Meanwhile, operating costs remained broadly flat, mainly reflecting disciplined cost management and lower severance expenses during the period, which helped mitigate inflationary pressures. As a result, the bank’s cost:income ratio improved to 50.4% (FY2025: 58.6%).
- Higher statutory profit before tax: Overall, the bank’s statutory profit before tax increased by 33.5% YoY to £4,293m. Following the release of its 1H2026 results, management reiterated its underlying net interest income guidance of >£14.9 billion (2025: £13.6 billion) and structural hedge income of >£7 billion (2025: £5.5 billion). This reflects expectations that NII will continue to benefit from higher structural hedge income and growth in lending balances, although competitive mortgage pricing and asset margin compression may partly offset these tailwinds.
Table 1: Profitability indicators (£m)
|
1HFY2025 |
1HFY2026 |
Change |
|
|
Net income |
8,914 |
9,747 |
9.3% |
|
Operating costs |
(4,874) |
(4,915) |
0.8% |
|
Statutory profit before tax |
3,504 |
4,293 |
22.5% |
Source: Company Reports, iFAST Compilations. Data as of 30 June 2026.
From a credit perspective, the overall credit profile remains relatively stable compared with our previous update on Q1FY2026.
1. Asset Quality
- The Asset Quality Ratio (AQR)* remained stable at 0.25%, unchanged from Q1FY2026, but was slightly higher than the 0.17% reported in FY2025.
*AQR - a metric being used to measure the proportion of troubled, impaired, or non-performing assets relative total loans
- This was primarily due to higher Multiple Economic Scenario (MES)^ charge of £80 million during the period, which have contributed around 4 – 5 bps to the AQR, mainly due to the deterioration in the economic outlook resulting from the Middle East conflict.
^MES is a forward-looking risk model that assesses multiple economic scenarios (e.g. upside, baseline and downside) to determine the level of provisions a bank should set aside for potential future loan losses.
- The non-performing loan ratio continued to improve, declining to 1.54% (FY2025: 1.71%), despite a 2.3% increase in loans and advances to customers.
- Expected credit losses also remained broadly stable, with a marginal improvement to £3,257m (FY2025: £3,353m), mainly due to the derecognition of mortgage assets following a securitisation transaction.
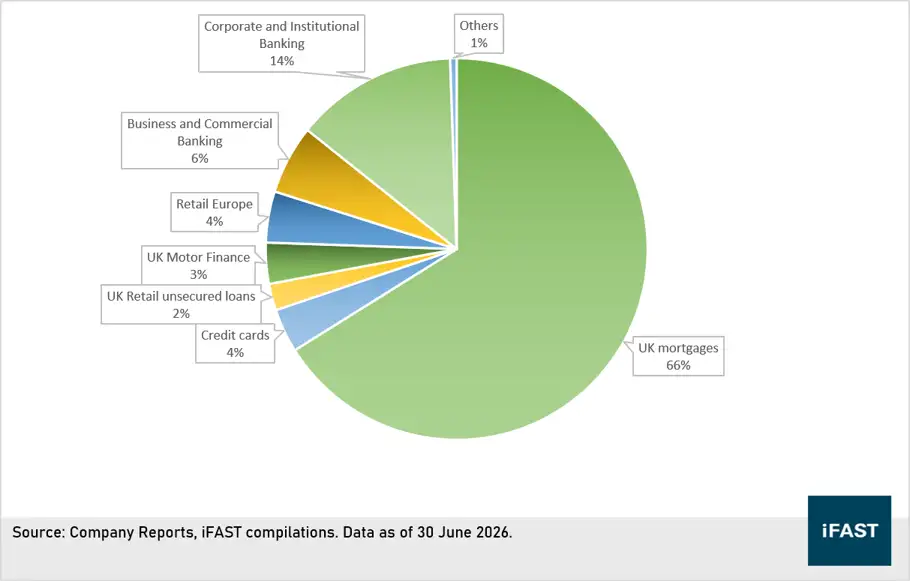
- Nevertheless,investors should remain mindful of the risks associated with Lloyds’ loan portfolio as residential mortgages account for approximately 70% of the Group’s total loan book, leaving it heavily exposed to the UK housing market.
- In our view, the UK property market is likely to remain subdued through 2026, with house prices broadly flat and buyer demand weakening amid rising interest rate expectations and affordability pressures. This could dampen mortgage lending growth and put pressure on lending margins, while a fall in house prices could increase the risk of borrowers defaulting on their mortgages.
- At this juncture, we view that borrower credit risk to remain manageable, supported by a decline in Stage 2 and Stage 3 loans to £43,337m and £7,700m respectively in 1H FY2026 (FY2025: £45,413m and £8,349m). Furthermore, the average loan-to-value (LTV) ratio of 45.7% indicates a substantial collateral cushion across Lloyds’ existing mortgage portfolio, helping to mitigate potential credit losses in the event of borrower defaults.
Chart 1: Loan Portfolio
2) Capital Position
- CET1 increased marginally by 0.2% to 13.6% (Q1 2026: 13.4%), as capital generation from profits outpaced the growth in RWA.
- Management has reaffirmed its guidance to moderate the CET1 ratio to 13% as it seeks to optimise capital and maximise return on tangible equity (RoTE).
3) Funding / Liquidity
- The loan-to-deposit ratio also remained stable at 98%.
- The Group continued to maintain a strong liquidity position, with both the Liquidity Coverage Ratio (LCR) and Net Stable Funding Ratio (NSFR) remaining comfortably above the regulatory minimum requirement of 100%, at 144% and 123%, respectively (Q1FY2026: 144% and 123%, respectively).
Risks to consider
High concentration in the UK market: Unlike many of its peers, Lloyds Banking Group has limited geographical diversification, with its business largely concentrated in the UK. As a result, the Group’s performance remains closely linked to the performance of the UK economy, resulting in less diversified earnings compared with international peers such as HSBC.
Liquidity risk: Lloyds’ loan-to-deposit ratio is relatively high. While this reflects efficient utilisation of its deposit base, it also presents a potential vulnerability in the event of significant deposit withdrawals or a bank run, which could place pressure on the Group’s liquidity position. However, this risk is mitigated by its Liquidity Coverage Ratio (LCR) of 144%, indicating that Lloyds holds sufficient high-quality liquid assets to cover projected net cash outflows over a 30-day period under severe financial stress.
Our view
Investors should remain mindful of certain risks, For instance, Lloyds’ strong concentration in the UK market makes the Group more sensitive to domestic economic conditions than its more geographically diversified peers. However, we believe the borrowers’ credit risk remains manageable at this juncture.
In addition, its relatively high loan-to-deposit ratio, while reflecting efficient deployment of customer deposits, could increase funding and liquidity risks in the event of significant deposit outflows.
Overall, we maintain a positive view of Lloyds’ earnings profile and medium-term outlook. In addition, geopolitical uncertainty and higher oil prices have contributed to higher bond yields, which may benefit investors seeking to invest in Lloyds bonds at current market levels, as they can potentially lock in higher yields compared with earlier periods.
For AUD investors, the newly issued LLOYDS 5.831% 11Jun2032 Corp (AUD) may be considered, offering a yield of 6.13%.
For USD, investors may consider LLOYDS 3.574% 07Nov2028 Corp (USD), yielding at around 4.78%. Alternatively, investors who prefer higher yield and has a greater duration risk tolerance may consider about LLOYDS 6.068% 13Jun2036 Corp (USD), with a yield to call of approx. 6.43%.
For GBP, investors may consider LLOYDS 2.000% 12Apr2028 Corp (GBP), yielding at around 4.53% level. Additionally, LLOYDS 7.500% Perpetual Corp (GBP) could also be a good choice, as we believe the risk–reward profile is justified with yield to call of approximately 7.32%. However, investors should be aware of the features / risks associated with perpetual bonds (e.g., interest deferral, non-call risk etc).
Table 2: Recommended Bonds
|
Bonds |
Years to next call / Years to maturity |
Yield to next call / Yield to maturity |
|
4Y9M / 5Y9M |
6.13% / 6.13% |
|
|
1Y11M / 6Y11M |
6.21% / 7.19% |
|
|
- / 1Y8M |
- / 5.68% |
|
|
1Y6M / 2Y6M |
5.68% / 6.10% |
|
|
4Y/ 5Y |
5.99% /6.00% |
|
|
1Y2M / 2Y2M |
4.78% / 4.78% |
|
|
8Y9M / 9Y9M |
6.43% / 6.43% |
|
|
3Y / - |
6.68% / - |
|
|
5Y / - |
7.05% / - |
|
|
8Y10M / 1Y7M |
4.53%/ 4.53% |
|
|
3Y9M / - |
7.32% / - |
|
|
1Y8M / - |
6.01% / - |
Source: BSM, iFAST Compilations. Data as of 12 Oct 2026.
Declaration: For specific disclosure, at the time of publication of this report, IFPL (via its connected and associated entities) holds a position in LLOYDS 7.086% 31Aug2033 Corp (AUD) and the analyst who produced this report hold a NIL position in the abovementioned securities.