• Higher fees and annuity gains lifted profits: Pension fees rose with asset values while costs stayed flat, and repositioning the annuity portfolio added gains. Adjusted operating profit rose 25% YoY to GBP 563 million in 1H26.
• Steady cash up to the issuer: Capital released from existing policies, plus investment repositioning, lifted operating cash (sent up to the bond issuer) 6% YoY to GBP 745 million in 1H26.
• Debt reduced to target, while coverage remains healthy: Solvency II leverage (debt / regulatory capital) fell to 29% as of 30 June 2026 (FY25: 33%), while interest coverage is healthy at 6.6x.
• Growth brings fresh debt: Having met its leverage target, Standard Life is buying Aegon UK, a UK pensions business, for GBP 2 billion. The GBP 650 million new debt needed (GBP 350 million already raised) will lift leverage, though management expects it back below 30% after completion.
• About the bonds: Standard Life’s USD/GBP bonds offer attractive yields of up to 7+%, which are suitable for investors seeking quality income from an established issuer.
The name on these bonds has changed, but the business behind them has not. Standard Life plc (“Standard Life” or the “Group”) was called Phoenix Group Holdings plc until 24 February 2026, so figures up to FY25 were reported under the Phoenix name. It focuses solely on retirement savings and income, with GBP 333 billion in assets under administration (AUA) as of 30 June 2026 (1H26).
To understand how it makes money, picture two engines. The first, Pensions and Savings, manages workplace and personal pensions for a fee, and so needs little capital. The second, Retirement Solutions, sells annuities, paying a guaranteed income for life, including pension risk transfer (PRT) deals that take over company pension schemes' obligations. Because it makes these promises itself, this engine ties up more capital and holds GBP 42.0 billion of annuity assets on average (1H26).
Crucially for bondholders, however, the bonds come not from the insurers but from Standard Life plc, the holding company, which owns the insurers but not the policyholders' money. In other words, it pays coupons from the cash its insurers send up, and every bond ranks behind policyholders. Our analysis therefore follows two threads: the cash reaching the holding company, and the capital standing behind it.
The Engine: Profits Are Rising, and the Accounting Losses Are Mostly a Side-Effect of Hedging
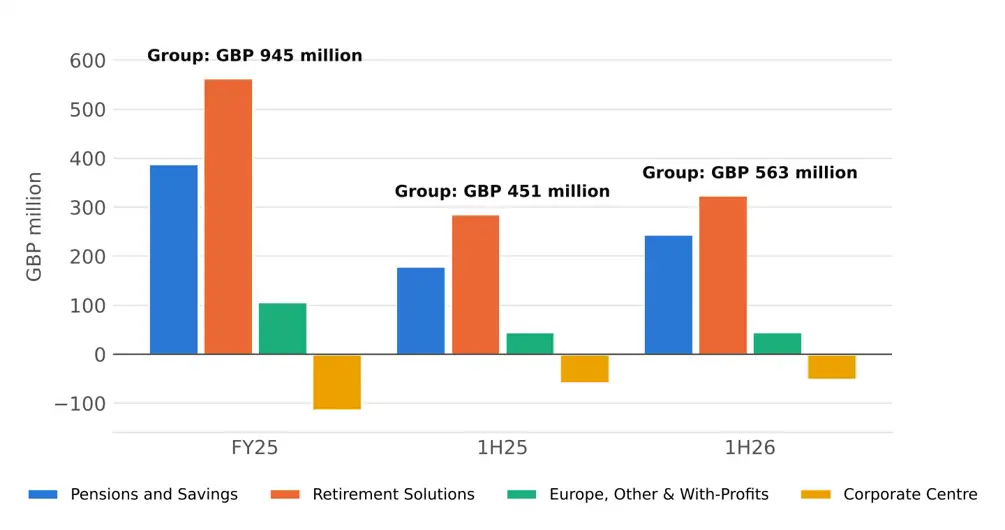
Adjusted operating profit (underlying earnings, before one-off items and market movements) climbed 25% year on year (YoY) to GBP 563 million in 1H26 (1H25: GBP 451 million), as seen in Chart 1 below. The fee-based Pensions and Savings business led the way, up 36% YoY to GBP 244 million, and we like its twin drivers. Rising markets lifted its average assets 10%, and their fees with them, while cost savings held expenses broadly flat. Consequently, its margin widened to an annualised 0.22% of average assets (1H25: 0.18%). Retirement Solutions rose 13% YoY to GBP 324 million, helped by gains from repositioning its annuity investments. This mix suits bondholders, because fee growth adds profit without tying up much capital.
If the story ended there, it would be simple. Under IFRS accounting rules, Standard Life lost GBP 179 million in 1H26 mostly on hedges. This is because the Group hedges to protect its solvency capital, which drives cash and dividends, rather than its accounting profit. So, when stock markets rise, as in 1H26, the hedges lose money in the accounts while the matching gains largely go unrecorded. We therefore focus on adjusted operating profit, which we think is a better metric to judge the business’ core operating profitability.
That said, the losses have left accounting equity negative at GBP (218) million in 1H26 (FY25: GBP 244 million). For bondholders, this matters less than it looks, because dividends are paid from the cash the insurers send up, not from new debt.
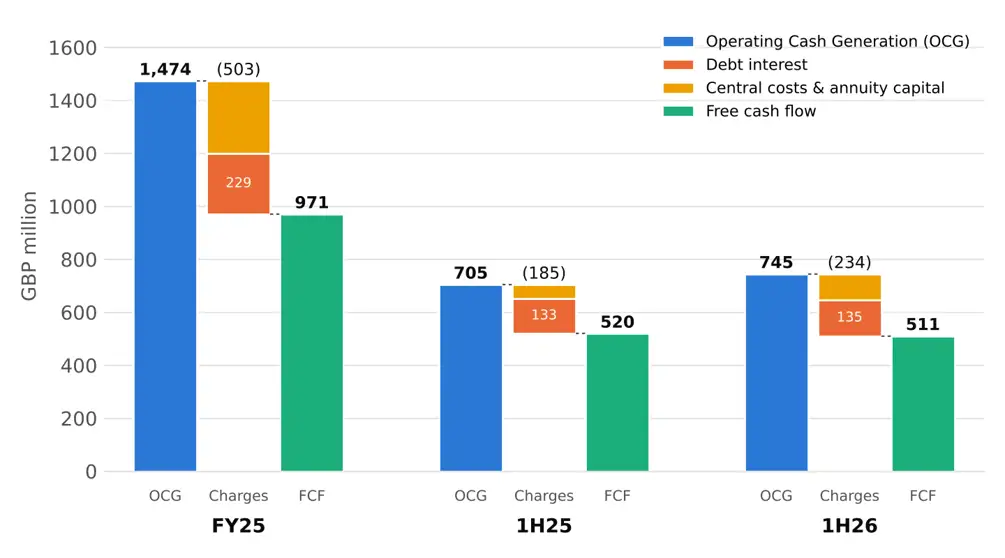
On cash flow, we set aside consolidated operating cash flow (GBP 1.1 billion in 1H26), as it includes policyholder money beyond bondholders' reach, and focus on operating cash generation (OCG) instead. OCG grew 6% YoY to GBP 745 million in 1H26. After central costs, annuity capital and interest payments, GBP 511 million of free cash flow remained (1H25: GBP 520 million), as seen in Chart 2 below. That covered the GBP 282 million dividend paid to shareholders in 1H26, with GBP 229 million to spare.
Looking ahead, we expect Standard Life to reach its GBP 1.1 billion FY26 profit target, helped by GBP 210 million of annual cost savings so far. That said, management expects narrow credit spreads and competition to lower returns on new annuities in 2H26. Do note that from 2027, spare cash will fund growth, and shareholder returns rather than debt repayment.
Chart 1: Twin Engines Lifted Adjusted Operating Profit
Data as of 30 June 2026
Source: Company data, iFAST compilations
Chart 2: Most of Operating Cash Generation is Left as Free Cash Flow After Costs and Interest
Data as of 30 June 2026
Source: Company data, iFAST compilations.
The Assets: A High-Quality Bond Portfolio, With a Sizeable Slice of Private Loans
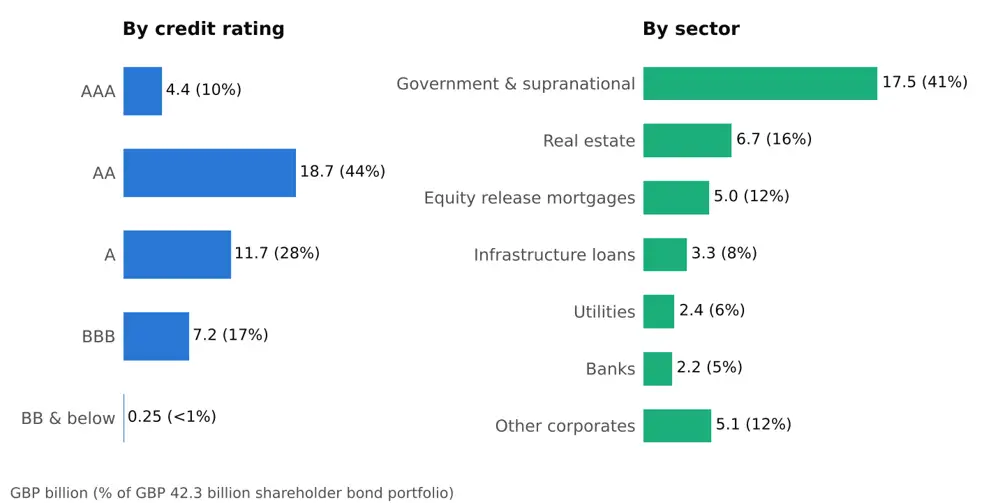
Behind both the profits and the cash generation sits the investment portfolio. As of 30 June 2026, Standard Life holds a GBP 42.3 billion shareholder bond portfolio* which mainly backs the annuity book.
Reassuringly, credit quality is high. Around 99.4% of the portfolio is investment grade, and 55% is rated AA or above, as seen in Chart 3 below. 41% of the portfolio (the largest segment) sits in government bonds, sub-sovereign and supranational debt, which can be sold quickly if cash is needed. Real estate is the next biggest exposure at 16%, though mostly rated A, while banks make up just 5%.
That said, a sizeable slice is private. Nearly two-fifths, about GBP 16.6 billion, sit in loans that lack transparent pricing, such as corporate credit, infrastructure and commercial property loans. This includes GBP 5.0 billion of equity release mortgages (loans secured on retirees’ homes, repaid when they die or move into care). These loans earn an extra yield that supports annuity pricing, but they are valued with internal models rather than market prices. We note the mortgages also carry ratings from internal securitisations rather than agencies, so their quality is harder to verify.
On balance, we take comfort in the portfolio’s quality. A single credit rating downgrade (AAA to AA) on 20% of the bonds backing its annuities would cut its solvency ratio by only 7 points. Furthermore, the large holding of government bonds provides cash on short notice. Looking ahead, we would watch private corporate credit, the fastest-growing part of the portfolio, which rose 12% in 1H26 to GBP 4.3 billion. Its value rests on Standard Life's own internal models rather than market prices.
*Bonds and loans, where shareholders, not customers, bear the investment risk. Most of GBP 333 billion of AUA is customers' money.
Chart 3: Investment Portfolio backing annuities
Data as of 30 June 2026
Source: Company data, iFAST compilations.
Deleveraged Credit Profile: Leverage Is Down to Target with Healthy Coverage
Since 2024, Standard Life has directed much of its spare cash to paying down debt. After GBP 503 million of repayments in June 2026, Solvency II leverage (debt, including RT1, divided by own funds) fell to 29% (FY25: 33%), meeting management’s 30% target. Meanwhile, interest coverage (TTM OCG / TTM interest costs) improved modestly to 6.6x for 1H26 (FY25: 6.4x), as seen in Table 1 below.
Repaying debt does cost some solvency, however, because subordinated debt counts as capital. The shareholder capital coverage ratio (SCCR: own funds divided by the Solvency Capital Requirement, the capital regulators require) fell to an estimated 169% (FY25: 176%). That is still in the upper half of its 140-180% target range. The buffer also holds up under stress: if annuity customers lived six months longer than assumed, the SCCR would fall by only 8 points. Moving forward, we expect 2H26 capital generation to lift it back towards the top of its range.
Liquidity is sound too. Holding-company cash of GBP 556 million (FY25: GBP 846 million), GBP 1.8 billion of undrawn bank facilities and GBP 350 million from the July 2026 RT1 give about GBP 2.7 billion of resources. That covers known needs of about GBP 1.0 billion over the next 12 months (GBP 230 million of debt interest and the GBP 750 million Aegon UK cash payment), even with a full year of dividends (FY25: GBP 548 million). Standard Life’s liquidity profile is further supported by its demonstrated ability to generate solid cash flows.
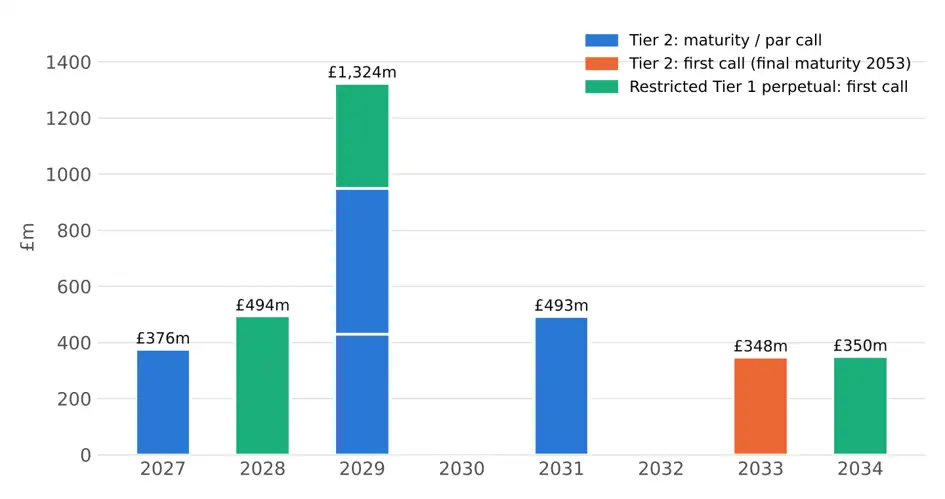
Looking at Chart 4 below, we think any near-term refinancing risk is minimal given 2027-2028 maturities are comfortably covered by available liquidity. 2029 introduces a maturity wall when GBP 1.3 billion in Tier 2 notes mature, or RT1 perpetuals first become callable. We expect these to be refinanced, as the issuance of July RT1 perpetuals shows market access is intact, although a weaker market would make this costlier.
Table 1: Improving Leverage and Coverage, With Solvency Stable Within Range
|
Credit Metric |
FY25 |
1H25 |
1H26 |
|
Solvency II leverage (SII debt / regulatory own funds) |
33% |
34% |
29% (pro forma c.31%*) |
|
Shareholder capital coverage ratio (SCCR) |
176% |
175% |
169% |
|
Regulatory coverage (own funds / SCR) |
151% |
c.154%* |
c.147%* |
|
Solvency II surplus (GBP billions) |
3.6 |
3.6 |
3.2 |
|
OCG / debt interest |
6.4x |
6.3x |
6.6x |
|
Holding-company cash (GBP millions) |
846 |
957 |
556 |
|
Shareholder borrowings, carrying value (GBP millions) |
3,050 |
3,414 |
2,541 |
|
*iFAST estimate. Data as of 30 June 2026 Source: Company data, iFAST compilations. |
|||
Chart 4: Light refinancing needs for 2027-2028 with a maturity wall in 2029
Data as of 30 June 2026
Source: Company data, iFAST compilations.
The Next Chapter: Aegon UK and a New PRT Venture Bring Growth and Fresh Risks
Earlier in 2026, Standard Life agreed to buy Aegon UK, Aegon's UK pensions and insurance business, for GBP 2 billion, with completion expected around the end of 2026. It will pay GBP 750 million in cash and 181 million new shares, making Aegon a 15.3% shareholder. Of the GBP 650 million debt earmarked for the deal, GBP 350 million came from the July RT1 perpetuals issuance, leaving GBP 300 million to raise.
As a result, leverage will edge up to about 31% after the July RT1 issuance by our estimate, before the remaining deal debt. Management, however, expects it to settle below c.30% once Aegon's capital is added. Separately, Standard Life will put GBP 500 million over five years into a new partnership with CVC, Prudential Financial and others, launching in 1H27 to take on the largest companies’ pension schemes. We see sound strategic logic in both moves, but also execution risk, as they run alongside a systems overhaul that management itself flags.
Recommendations
Overall, we think Standard Life’s credit profile has improved. Having cut Solvency II leverage to its c.30% target, it now covers debt interest 6.6x, while its shareholder bond portfolio remains 99.4% investment grade. Solvency also sits in the upper half of its target range. That said, the Aegon UK deal and the new PRT partnership bring execution risk, and the GBP 300 million deal debt still to be raised will lift leverage for a time. Even so, with management expecting leverage to settle below 30% after completion, we view Standard Life's credit profile as decent.
In Table 2 below, we highlight a couple of Standard Life’s outstanding investment-grade bonds in both GBP and USD. Do note that all these issues are subordinated. The Tier 2 bonds can defer coupons (on a cumulative basis) and suspend principal repayment if Standard Life breaches, or would breach, its regulatory capital requirements. The RT1 perpetuals rank below the Tier 2 bonds and carry more risk. Their coupons are fully discretionary and non-cumulative, so any skipped coupon is lost for good, and the bonds can convert into ordinary shares if solvency falls well below regulatory requirements. Investors should also be mindful of non-call risk.
In general, its Tier 2 bonds offer yields-to-worst of 5.93% (USD) to 6.41% (GBP) with expected tenors ranging from 0.67 years to 4.50 years. Against comparable US Treasuries and UK Gilts, we find an attractive yield spread of 130+ bps to 220+ bps. We also highlight an outstanding perpetual: SDLF 5.750% Perpetual Corp (GBP), which offers a yield-to-worst of 7.14%, with 1.48 years to call.
In sum, we think Standard Life’s GBP and USD investment-grade bonds present attractive income opportunities backed by an established issuer with sound credit metrics.
Table 2: Standard Life's Outstanding GBP and USD Bonds
|
Issue |
Issuer |
Ask Price |
Yield to Worst / Yield to next call |
Years to Maturity / Call |
Credit Rating (Fitch) |
|
Standard Life plc |
99.63 |
5.93% / - |
0.67 / - |
BBB+ |
|
|
Standard Life plc |
99.21 |
6.20% / - |
2.61 / - |
BBB+ |
|
|
Standard Life plc |
96.77 |
6.37% / 6.41% |
4.48 / 4.23 |
BBB+ |
|
|
Standard Life plc |
98.08 |
7.14% / 7.14% |
- / 1.48 |
BBB+ |
|
|
Data as of 4 November 2026 Source: Bloomberg, Bondsupermart, iFAST Compilations. |
|||||
Declaration: For specific disclosure, at the time of publication of this report, IFPL (via its connected and associated entities) and the analyst who produced this report holds NIL positions in the abovementioned securities. This research report was prepared with the assistance of artificial intelligence (AI) tools. iFAST Financial Pte Ltd does not rely exclusively on AI for content generation; the content of this report – including all investment theses, ratings, price targets and conclusions – has been independently reviewed and verified by the research analyst(s) to ensure accuracy and professional integrity.