- T-bills have been appearing everywhere
- It just hit another record high of 4.4%
- Edging over the SSBs and the FDs, but yields have been falling in November
- However, we still recommend T-bills as the Fed funds rate continues to increase
(Note: The article was mainly written prior to the T-bills auction on 8 December 2022 which saw an all-time high cut-off yield of 4.4%. Updates to the data have been made where applicable.)
Why are T-bills suddenly everywhere?
The T-bills, short for treasury bills, offered under the Singapore Government Securities (“SGS”) by the Monetary Authority of Singapore (“MAS”) are short-dated issues with a period of either 6 months or 1 year. Over 2022, we have seen the growing popularity of the T-bills, be it its growing coverage in media or an increasing demand for it – T-bills have seen a change in status from “lowly” to “sexy” (though this was for the US T-bills, it is apt for MAS T-bills as well).
2022 had been volatile thus far. The equity markets have seen double digits percentage drops year-to-date as of 30 November 2022, with S&P 500 at -14.9%, NASDAQ Composite at -27.6% and the MSCI World Index at -15.9%. Investors have been scrambling to find alternative instruments to park their money in, and the fixed income instruments never looked better with the rise in interest rates. T-bills, being one of the most liquid and risk-less of them all, became one of the top choices to consider – and even more so for investors who are looking at extremely short-term instruments to temporarily park their monies before pivoting elsewhere when the opportunity arises.
Popularity for the 6-months T-bills overwhelmingly exceeds the 1-year T-bills, where the 6-months T-bills had been rising faster in yields than the 1-year T-bills with its increased sensitivity to interest rates. Yields for the 1-year T-bills continue to lag, which is at 3.82% as of 7 December 2022, lower than the 3.93% on the 6-months T-bills. The more frequent bi-weekly issuance of 6-month T-bills against the quarterly issuance of 1-year T-bills may have had an impact on its popularity also. In this article, we will focus on the 6-month T-bills, though the points are valid on the 1-year T-bills, albeit the lagging yields.
For readers who are curious about T-bills in general, we highly recommend reading our article comparing the Singapore Savings Bond (“SSB”), T-bills and SGS, some of which will be highlighted again later.
Does T-bills really deserve the popularity it has seen so far? Or perhaps we just missed something that might have been better than it? Let us examine the recent T-bills and take a look.
Is it because T-bills hit a record high of 4.4%?
Chart 1Cut-off
yields for 6-months T-bills from 2021 to 2022 (%)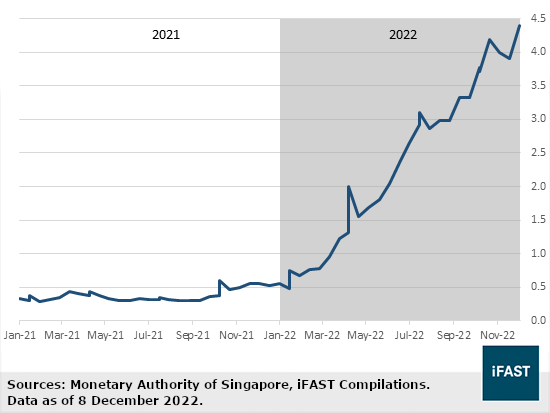
Looking
at Chart 1, yields for the T-bills in 2021 were reflective of the economy then,
with a larger focus on boosting demand and allowing the economy to recover from
the pandemic. Subsequently, driven largely by the need to control excessive
inflation in 2022, the Federal Reserve funds rate has been rising since the start of
the year, pulling up the yields on the MAS T-bills as well. For reference, the Fed fund rates have hiked from the 0% to 0.25%
range beginning this year, to the current level of 3.75% to 4.00% range.
The 6-month MAS T-bills hit a 4.4% cut-off yield in the 8 December 2022 auction, though previously the cut-off yields fell off the previous record high of 4.19% in the 27 October 2022 auction. Reflective of the increased yields from the T-bills, the overall demand climbed in 2022, with a total of SGD 283b applied in 2022 year-to-date as of 8 December 2022, approximately 9.9% higher (despite having one more issuance to go) than the total applications received in the entirety of 2021 at SGD 258b.
How
high is high?
As always, the concern is whether T-bills are truly comparatively better than their peers on the market, given the risk level – typically being SSBs and fixed deposits.
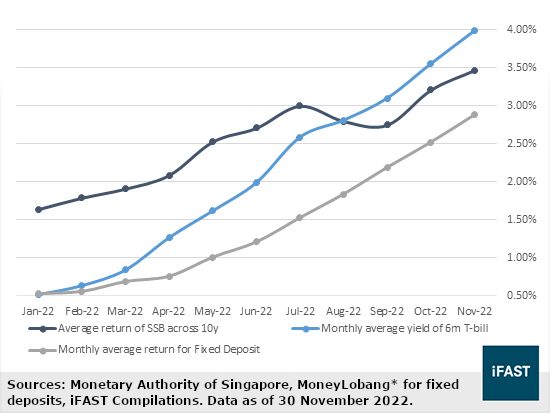
Chart 2Comparison
of returns across different instruments in 2022 year-to-date as of end November (% p.a.)
*There are no official sources of information for average fixed deposit rates, given the different tenors and different interest rates based on tenor, thus the closest average estimate is obtained from MoneyLobang. It might not be the most representative of the best option available to investors, especially considering CIMB offers a promotional rate of 4.15% in November 2022 for fixed deposits with a tenor of 18 months versus the indicated average fixed deposit rate of 2.88% in November 2022.
Chart 2 shows a clear trend in the rise of interest rates, and the rise in the monthly average yield of T-bills is the greatest across the three instruments. Do note the period of each instrument differs – SSBs last up to 10 years, T-bills in this case at 6 months and fixed deposits go between 3 to 18 months.
The reason behind T-bills getting more popular in this period is pretty straightforward – thanks to their overall outperformance over other suitable instruments. In addition, T-bills are beneficial for investors who are looking to park a larger amount of cash, given that typically SSBs and fixed deposits have a limit to be allocated to individual investors.
Should I still bother now that T-bill yields are falling?
After hitting the peak at 4.19% on 27 October, the following auction on 10 November saw the cut-off yield falling to 4.00%, followed by another drop to 3.90% on 24 November. The excessive non-competitive bids received on 10 November might have been the reason for the drop from 4.19% to 4.00%, which saw an estimated SGD 3.62b applied when there were only SGD 1.8b allocated to non-competitive bids. However, with the bid-to-cover ratio falling from 3.17 on 10 November to 2.48 on 24 November, the fall in yield from 4.00% to 3.90% is quite unlikely to be a result of increasing demand.
Chart 3Yields of US Treasury notes and SGD SGS across 2Y, 5Y
and 10Y (%)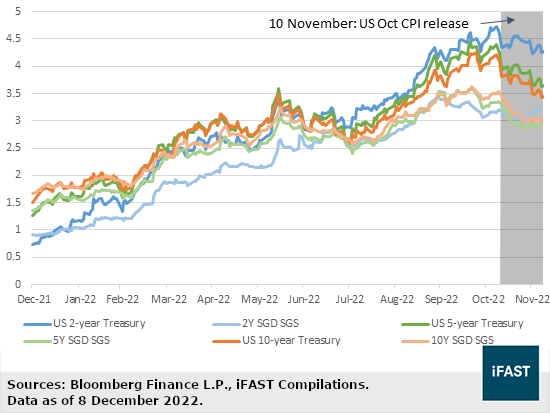
Chart 3 indicates the yields on the US Treasury
notes alongside the SGD SGS, which had been falling since the start of
November. The drop in yields coincides with the announcement of US inflation data
on November 10, which was lower than initially expected and had been a major market mover suggesting
that the Fed Reserve might consider slowing down the interest rate hikes. On
the other hand, the market may have slightly overreacted to the announcement,
considering the fall in yield being off-tangent from the expectations on
interest rates in the period ahead.
Chart 4Implied Fed Rates (%) (Left) andEconomic Projections for the Median Federal Funds Rate
(%) in Sept’s FOMC Meeting (Right)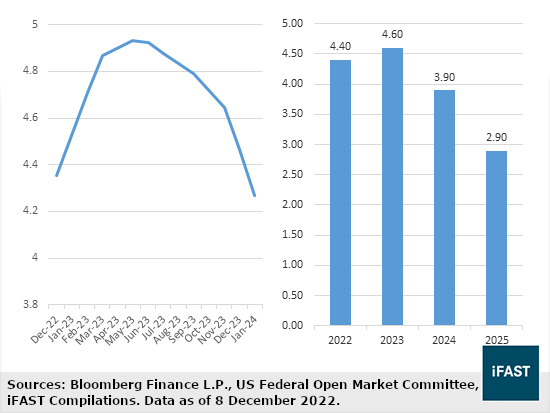
Chart 5Historical Fed Funds Rate against 2Y SGD SGS, 1Y SGD
SGS and 3M SIBOR (%)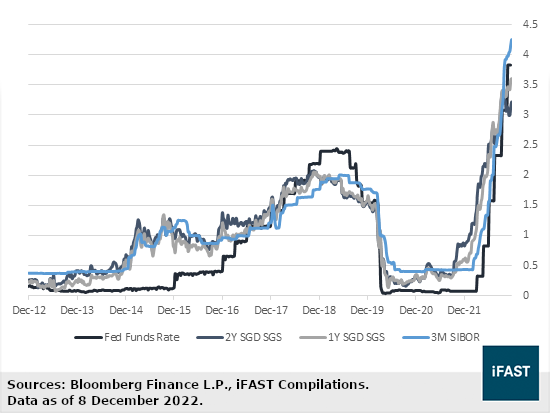
In Chart 4, we see the current market implied
expectations of the Fed funds rate and the Federal Open Market Committee’s
projection of year-end median rates in the September meeting. The
Fed funds rate is expected to be further adjusted upwards in the upcoming year,
which is expected to reach a peak rate in the middle of 2023. And given the correlation between the
short-term rates in Singapore against the Fed funds rate as observed
historically in Chart 5, we expect the continuous increase until the peak is near.
So, do I continue buying T-bills?
The answer is yes, given that yields fell across the board rather than T-bills alone. As such, comparatively, T-bills remain ideal for the liquidity and optimal risk-free rates. At the same time, we are likely to continue seeing the yields adjust upwards as the Federal Reserve continue to hike the rates at least until 2023. Yields on the T-bills have correlated relatively closely to the Fed funds rate across 2022, with the exception of the 4.19% being a possible overreaction.
MAS holds the auction for the T-bills every 2 weeks, and more information on how to participate in the auction may be found here for direct participation and purchase of the T-bills. Alternatively, for the purchase of the T-bills through our FSMOne platform, please refer to this article here.
Declaration: For specific disclosure, at the time of publication of this report, IFPL (via its connected and associated entities) holds a position in BS22124H; SITB ZERO 13Jun2023 Govt (SGD), and the analyst who produced this report holds a NIL position in the abovementioned securities.
Our podcast series, Yield Hunters, is available on Spotify, iTunes Podcasts and Google Podcasts. We share our thoughts on new bond issues and hold discussions on the fixed income space. Listen to our latest episode below and follow us!